AARRR pirate metrics
AARRR is a five-stage framework (acquisition, activation, retention, referral, revenue) that gives a product team five separate numbers instead of one vague growth conversation, so they can see which stage is limiting growth.
AARRR is a five-stage framework (acquisition, activation, retention, referral, revenue) that investor Dave McClure introduced in 2007 to replace vague growth talk with five specific numbers. Reading all five for one cohort of users shows which stage is limiting growth. Retention usually decides the most, because referral and revenue can only come from the users who stayed.
- Origin
- Dave McClure, 2007
- Level
- 201 · Tool
- Fits
- Startup, Small and mid-size, Scale-up
- Time to apply
- An afternoon to define the five events and pull one month's numbers, once tracking already exists
- What you need
- event tracking that already logs signup, first-value action, return visits, referrals and payment as separate events · one full cohort (a week or a month of signups) old enough for retention and referral to have happened
AARRR is a five-stage framework (acquisition, activation, retention, referral, revenue) that investor Dave McClure put together in 2007 to give startups five specific numbers instead of one vague growth conversation. The name is a joke: the initials of the five stages spell out a pirate’s yell, and the deck McClure built around it, “Startup Metrics for Pirates,” still circulates today in the version hosted on SlideShare. McClure kept reissuing and updating that same deck for years afterward, but the five stages barely moved.
No single post or talk is agreed on as the definitive first appearance, only the deck itself and the year, 2007. What is settled is the order and the idea behind it: five separate numbers, one per stage, each answering a different question about the same group of users.
What the five letters measure
Acquisition is how a person first shows up (a click, a download, a signup), counted by the channel that brought them in. Activation is the first moment that person gets value out of the product, past simply opening it once. Retention is whether that same person comes back later on their own, without another ad pulling them in. Referral is whether a retained person brings someone else along. Revenue is whether any of this turns into money (a subscription, a purchase, a paid upgrade).
A product can be strong at acquisition and weak everywhere else, and only reading all five together shows which stage is the block.
Two variants: one adds a stage, one reorders them
A later variant adds a stage in front: Awareness, making AAARRR, an addition commonly credited to the growth-training firm Growth Tribe around 2016. The argument: a person cannot be acquired by a product they have never heard of, so awareness earns its own count before acquisition starts.
A different variant keeps the same five letters and reorders them. RARRA puts Retention first, followed by Activation, Referral, Revenue, and Acquisition last, an idea credited to growth consultant Thomas Petit and written up with Gabor Papp in 2017. Their argument: for a mobile app losing most new users within days, spending on acquisition before fixing retention means paying, repeatedly, to refill a bucket that leaks from the bottom. AAARRR and RARRA are both practitioner variants layered onto McClure’s original five.
Why retention is the stage the other four depend on
Bain’s Fred Reichheld made the case that keeping customers drives profit in a 1990 Harvard Business Review paper with Earl Sasser. He is also the source of the figure HBR repeated in 2014: raising customer retention by five percentage points increases profits by 25% to 95%. Amplitude’s retention guide goes further, stating that improving retention moves monthly active users more than acquisition or virality does. Both Amplitude and Mixpanel build their retention reports around a cohort returning inside a fixed window (day seven, day thirty, a custom bracket) because one average return rate hides how fast a cohort thins out.
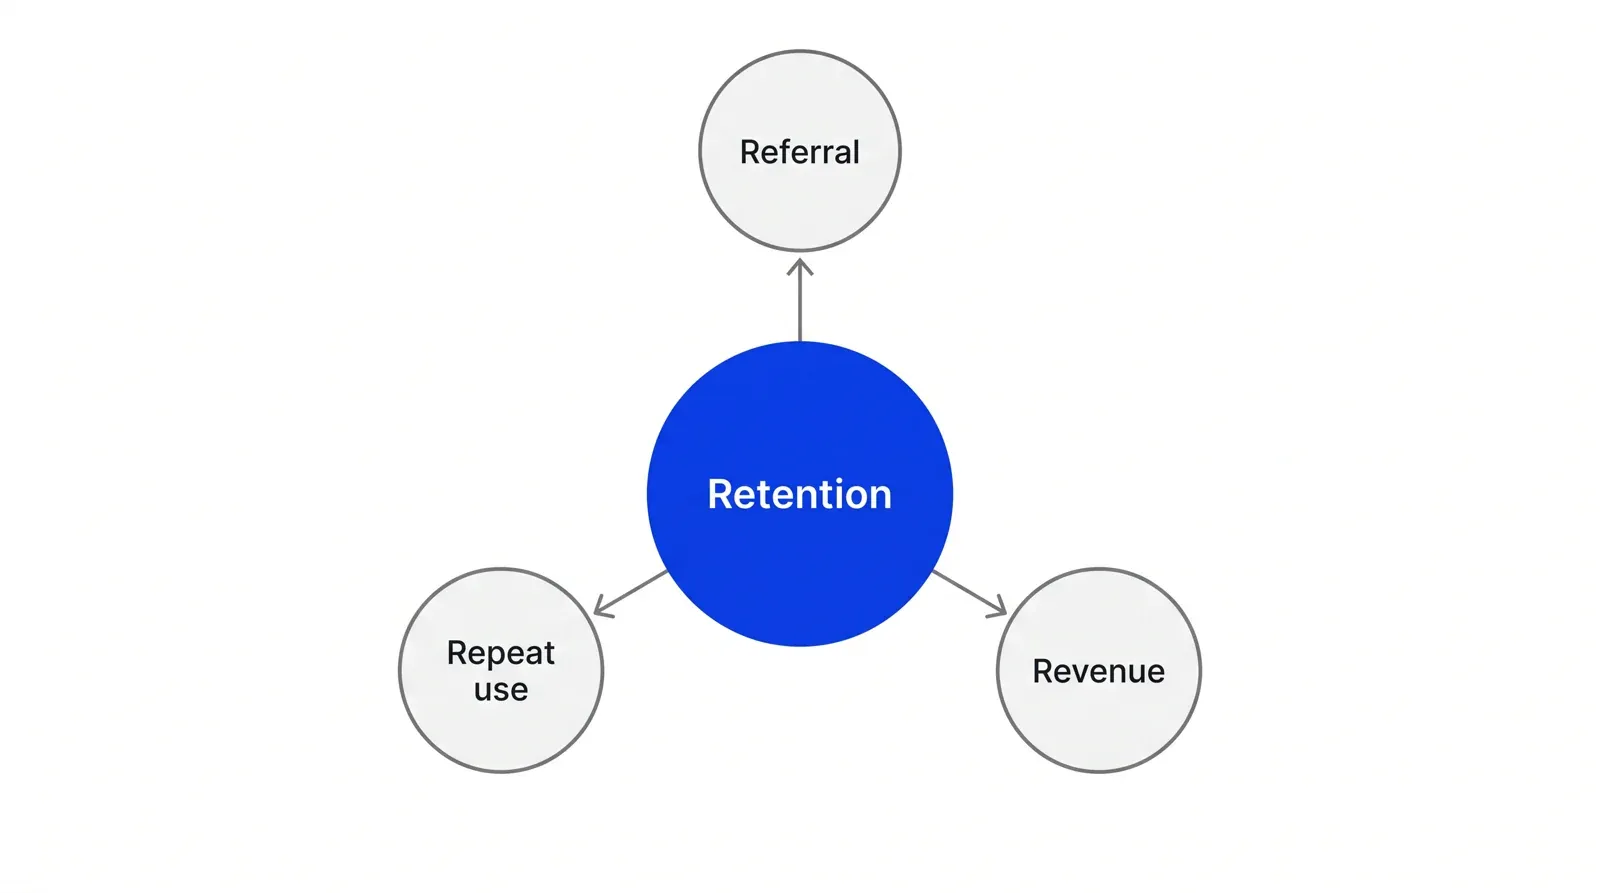
The dependency runs one direction. A referral only happens if the person referring is still around to send it. Revenue past a first purchase mostly comes from people who kept using the product. Fix acquisition and activation while retention stays broken, and referral and revenue stay capped by however few people are left to produce them.
A cohort worked through the five stages
Take a budgeting app, illustrative, round numbers, for one month’s new cohort. 20,000 people download it. 10,000 link a bank account and complete setup within 48 hours, activation at 50%. Of those, only 2,000 still open the app a month after activating, retention at 20% of activated users. Of that retained group, 300 invite a friend, referral at 15% of retained. And 600 pay for a premium feature, revenue at 30% of retained users.
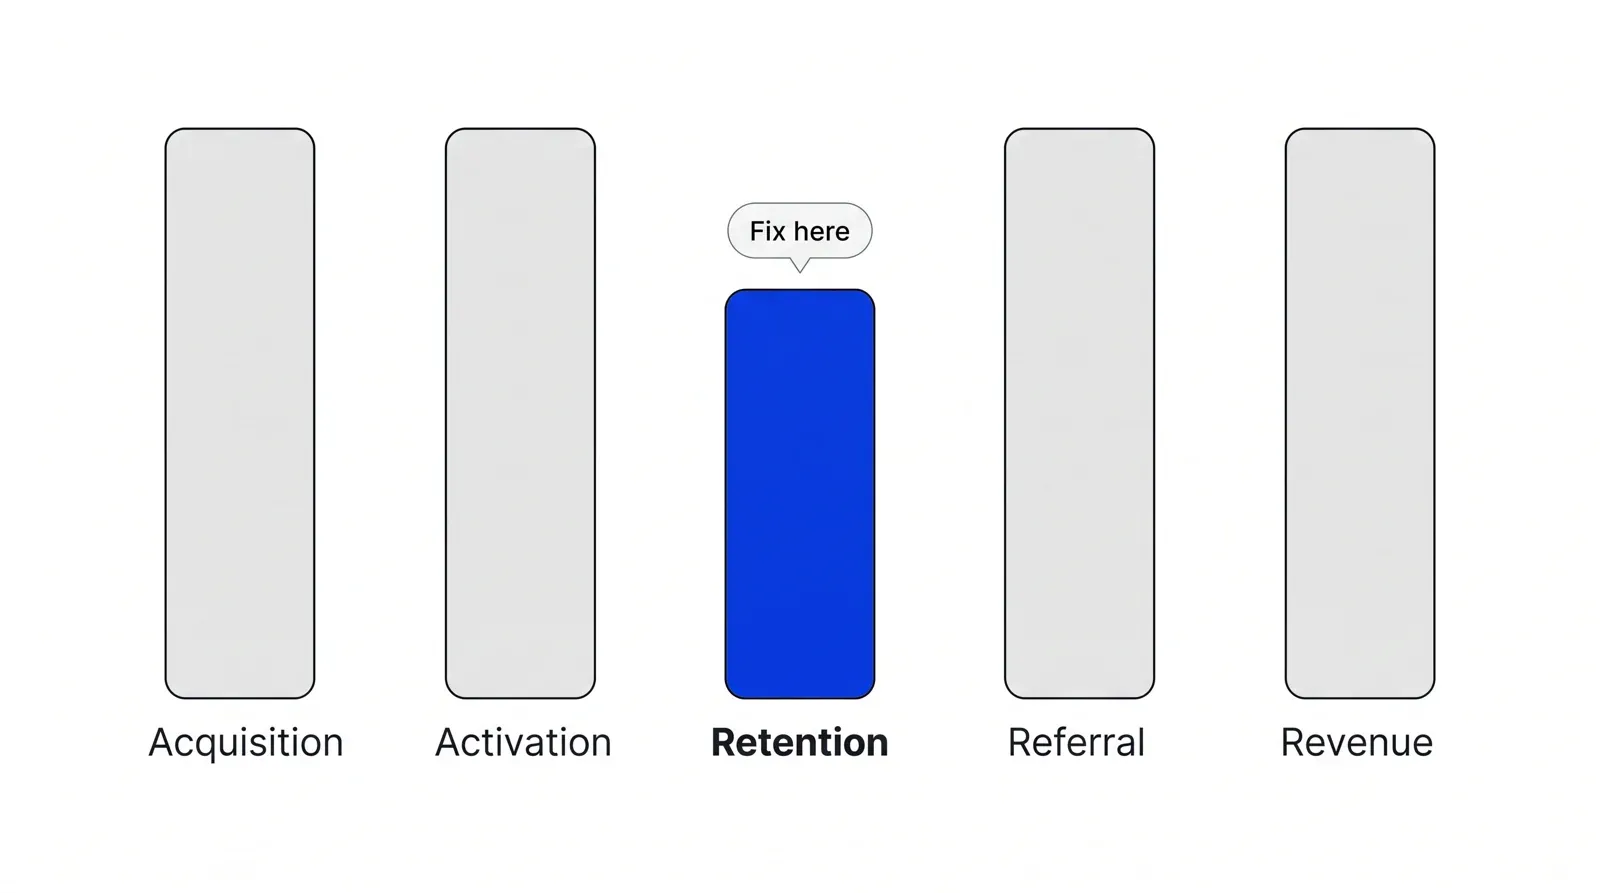
Acquisition and activation both look healthy. Retention is the number that stands out: one in five activated users stuck around. Referral and revenue are both counted against that shrunk pool of 2,000. The original 20,000 downloads, or even the 10,000 who activated, don’t factor into either number. A team chasing a bigger download count this month would be adding to the top of a funnel that already loses four out of five people one step later.
Turning word of mouth into one number
Referral is often run on instinct instead of a number. A 2009 Journal of Marketing study of an online social network found that referrals carried substantially longer effects and produced a stronger response than traditional marketing spend, tracked directly because the platform logged every invitation sent. A 2010 Journal of Marketing study went further and built a way to score which customers are worth prompting to refer, based on their own value to the business and their likely referral value, rather than asking everyone equally.
Treated this way, referral stops being a guess about whether people liked the product enough to mention it, and becomes a count: how many retained users sent an invitation this month, and how many of those invitations produced a new acquisition next month.
AARRR versus the marketing funnel and funnel analysis
AARRR, the marketing funnel and funnel analysis all get called a funnel, and each answers a different question.
| AARRR (pirate metrics) | AIDA / marketing funnel | Funnel analysis | |
|---|---|---|---|
| Measures | Five behaviors across a product’s whole lifecycle | Four stages of buyer psychology before a purchase | Real counts inside one defined sequence of steps |
| Tracks | A cohort of actual users, after signup | A prospect who is not yet a user | Users moving through one specific flow |
| Answers | Which lifecycle stage is limiting growth | What a page or ad should say next | Where inside one flow people drop off |
| Output | Five separate numbers, one per stage | A stage assigned to one piece of copy | Step-to-step and overall conversion rates |
The marketing funnel plans what to say before anyone has signed up. Funnel analysis reads one specific flow once real steps are tracked (a checkout, a KYC process). AARRR sits above both: it tracks a whole cohort’s behavior across weeks or months, from first contact through paying and referring, and its five numbers point to which of the other two tools is worth running next.
Reading the five numbers once a month, for the same cohort definitions every time, is what turns AARRR from a slide people remember into a working growth review. That is the shape of the regular numbers work inside Pushers’ Growth Lab, where the five stages sit next to whatever experiment is running rather than getting redrawn from scratch each quarter.
How to apply AARRR pirate metrics, step by step
- Define what counts as each of the five events. Write one specific, trackable action for each stage (a download, a completed setup, a return visit inside a set window, a sent invite, a payment) so two people looking at the same cohort count the same users. Result: five yes-or-no events instead of five vague ideas.
- Pick one cohort and pull all five numbers for it. Choose one group of users who all started in the same period (a week or a month) and count how many of them hit each of the five events. Result: one AARRR snapshot built from a single cohort, comparable across months because every number in it started from the same group of people.
- Rank the five stages against the product's own history. Compare each stage's rate to the stage before it and to the same cohort's number last month, since a healthy activation rate for a marketplace and for a fintech app are different figures entirely. Result: a ranked list of which stage looks weakest for this specific product.
- Rule out a downstream stage that's only capped upstream. Before committing a sprint to the weakest-looking stage, check whether a downstream stage that looks weak is only capped by an upstream one, since referral and revenue both draw from whoever stayed retained. Result: one stage identified as the lever worth pulling, separate from whichever number simply happens to look smallest.
- Fix one thing at that stage. Change one variable at the chosen stage (an onboarding step, a reminder, a referral incentive) and leave everything else untouched. Result: a single change whose effect on that stage's number can be read cleanly.
- Re-pull the same five numbers for the next cohort. Run the exact same definitions and window against next month's cohort and compare the five numbers side by side. Result: proof the fix moved the number, or proof it didn't and the next stage needs a look.
Examples
A clinic's patient app
Illustrative. Acquisition is a local search ad for symptom booking. Activation is completing a first appointment and turning on two-way texting. Retention is a second booked visit within 90 days. Referral is sharing the booking link with a family member. Revenue is an appointment that gets kept and paid for.
A B2B project management tool
Illustrative. Acquisition is a signup from a free-trial ad. Activation is inviting one teammate and creating a first project board. Retention is a login in week three. Referral is inviting a second company's workspace. Revenue is converting from the free trial to a paid seat.
A two-sided marketplace app
Illustrative. Acquisition is a seller or buyer downloading the app. Activation is a seller listing one item or a buyer completing one search. Retention is a return visit inside two weeks. Referral is a buyer inviting a friend with a discount code. Revenue is one completed, paid transaction.
When to use it
Use it once a product has users to measure and event tracking in place, and the team wants one view across the whole lifecycle (beyond top-of-funnel signups) to see which stage is limiting growth.
When not to use it
Skip it before launch, or in the first weeks after it, when there aren't enough users yet for retention or referral numbers to mean anything. It also doesn't fit a business built on one infrequent purchase with no return visit to track (a used-car sale or a home renovation), where the five stages don't map onto repeat behavior.
Common mistakes
- Chasing a bigger acquisition number first because it is the most visible one, while retention, the stage the other four depend on, stays broken.
- Leaving activation as a vague feeling ("people seem engaged") instead of one specific tracked action, so two people report two different activation rates for the same cohort.
- Comparing a stage's rate to a generic industry benchmark instead of to the same product's own history, since a normal activation or referral rate varies hugely by category.
- Declaring referral or revenue weak without checking whether retention capped them first, since both stages are usually counted against the same retained pool.
- Never rebuilding the same five numbers after a change, so nobody finds out whether the fix moved anything.
FAQ
What is AARRR, or pirate metrics?
AARRR, also called pirate metrics, is a five-stage framework (acquisition, activation, retention, referral, revenue) that investor Dave McClure introduced in 2007. Reading all five numbers for the same cohort of users shows which stage of a product's growth is limiting the rest, instead of judging growth from one number alone.
Who invented AARRR pirate metrics?
Investor Dave McClure put the framework together in 2007 and published it as a slide deck, Startup Metrics for Pirates, still hosted on SlideShare. No single talk or post is agreed on as the definitive first appearance; the deck itself, reissued in several versions since, is what survives.
What does each letter in AARRR stand for?
Acquisition is how a user first arrives. Activation is the first time they get value from the product, past simply opening it. Retention is whether they come back on their own. Referral is whether they bring someone else along. Revenue is whether any of it produces money.
What is RARRA and how is it different from AARRR?
RARRA reorders the same five letters to put Retention first, then Activation, Referral, Revenue and Acquisition last. Growth consultant Thomas Petit proposed it, written up with Gabor Papp in 2017, arguing that acquisition spending gets wasted while a mobile app's retention is still broken.
Is AARRR the same as a marketing funnel or funnel analysis?
No. A marketing funnel like AIDA plans what to say to someone who isn't a customer yet. Funnel analysis reads one tracked flow, like a checkout. AARRR tracks a whole cohort of users across weeks or months, acquisition through revenue, to see which lifecycle stage is limiting growth.
Sources
- Dave McClure, Startup Metrics for Pirates (long version), SlideShare, 2007
- Thomas Petit, Gabor Papp, Patrick Vlaskovits, Casey Armstrong, Why Focusing Too Much on Acquisition Will Kill Your Mobile Startup, Phiture Mobile Growth Stack, 2017
- Growth Tribe, What Is a Growth Marketing Framework? And How To Do It
- Frederick F. Reichheld, W. Earl Sasser Jr., Zero Defections: Quality Comes to Services, Harvard Business Review, 1990
- Amy Gallo, The Value of Keeping the Right Customers, Harvard Business Review, 2014
- Bain & Company, The Loyalty Effect
- Frederick Reichheld, The One Number You Need to Grow, Harvard Business Review, 2003
- Michael Trusov, Randolph E. Bucklin, Koen Pauwels, Effects of Word-of-Mouth versus Traditional Marketing: Findings from an Internet Social Networking Site, Journal of Marketing 73(5), 2009
- V. Kumar, J. Andrew Petersen, Robert P. Leone, Driving Profitability by Encouraging Customer Referrals: Who, When, and How, Journal of Marketing 74(5), 2010
- Amplitude, Interpret your retention analysis, Amplitude Docs
- Amplitude, N-Day LTV in retention analysis, Amplitude Docs
- Amplitude, Retention Rate: Complete Definition & Calculation Guide
- Amplitude, The 7% Retention Rule Explained
- Amplitude, Retention Analytics For Stopping Churn In Its Tracks
- Mixpanel, Retention, Mixpanel Docs
- Mixpanel, A primer on retention analytics for product leaders, Signals & Stories
- Eric Ries, Vanity Metrics vs. Actionable Metrics, The Blog of Author Tim Ferriss, 2009
- Bessemer Venture Partners, The Five Accounting Metrics for Cloud Companies, State of the Cloud
- Marc Andreessen, The Only Thing That Matters, Pmarchive (The Guide to Startups, Part 4), 2007
- Frank V. Cespedes, Sales Teams Need to Stop Focusing on the Customer Funnel, Harvard Business Review, 2023
- Amplitude, What Is Retention Analysis & Why It Matters for Growth
Last updated Sep 25, 2026

