CSAT & CES
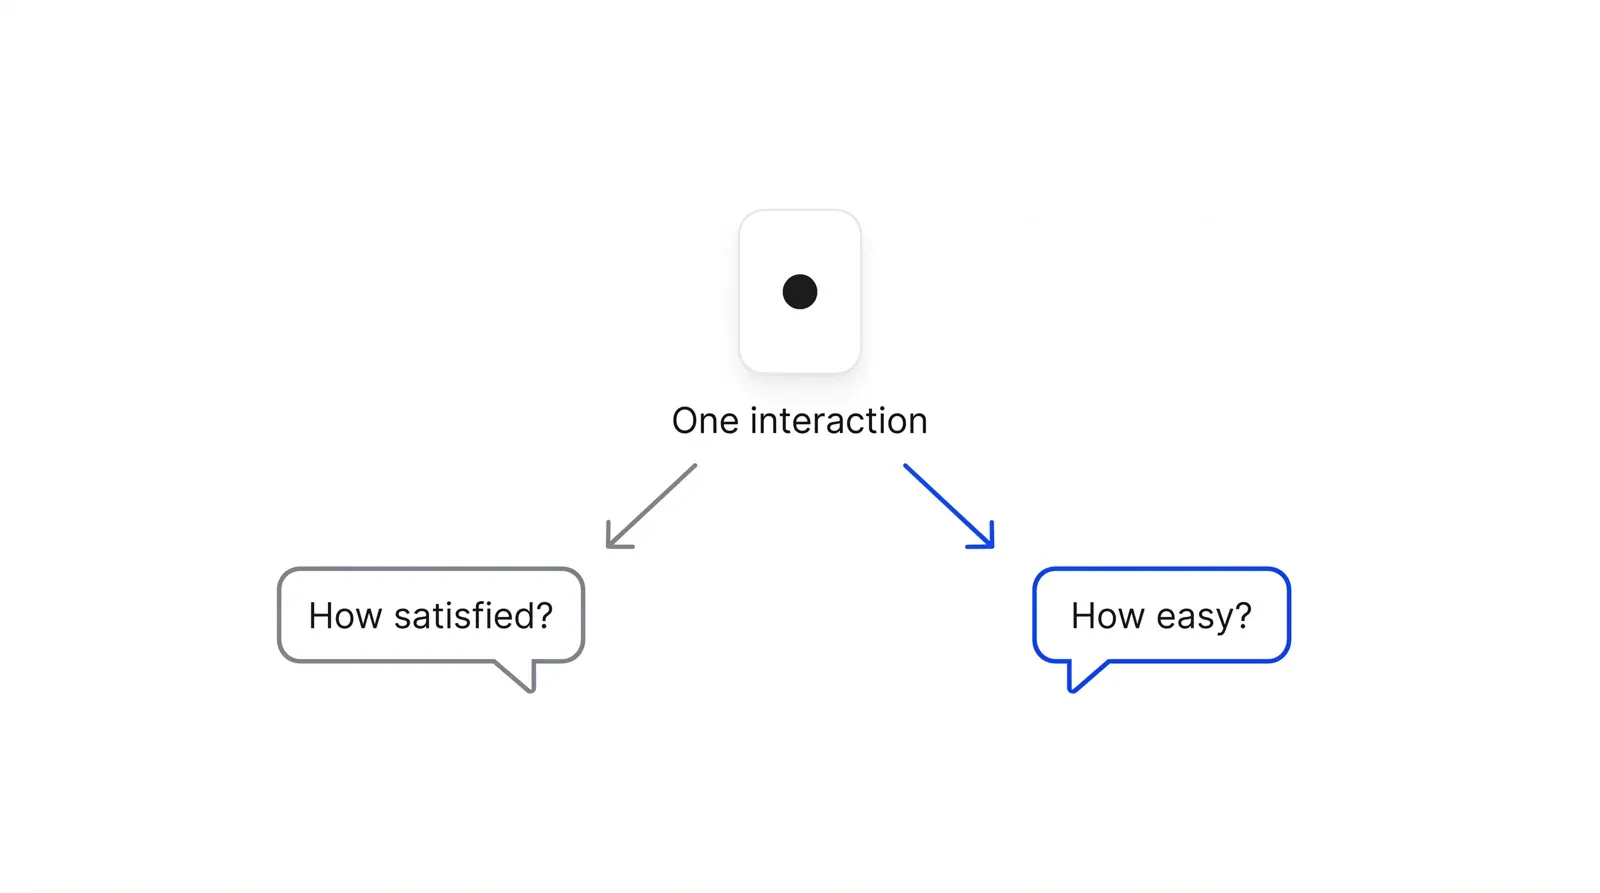
CSAT and CES are two short survey scores taken right after one interaction: CSAT measures how satisfied the customer felt, CES measures how much effort it took, and read together they show where an experience breaks even when the outcome was fine.
CSAT (customer satisfaction score) is the share of respondents who rate one interaction favorably, usually on a 1-to-5 scale. CES (customer effort score) is a companion metric for the same moment, measuring effort as agreement with 'the company made it easy,' on a 1-to-7 scale. Asked together after a call or chat, the two catch what one number hides: a satisfied customer who had to fight for it.
- Origin
- Customer satisfaction measurement: general survey practice, formalized academically by Claes Fornell and colleagues (ACSI); Customer Effort Score: Matthew Dixon, Karen Freeman, Nick Toman for CEB, CSAT: practice from the 1990s; CES: 2010, revised 2013
- Level
- 201 · Tool
- Fits
- Small and mid-size, Scale-up, Enterprise
- Time to apply
- a day to set up a two-question survey and a trigger; a few weeks of responses before the score is stable enough to act on
- What you need
- a trigger right after one interaction ends: a call, a chat, a resolved ticket or claim · a place to read both scores next to the open-text answers, not just a dashboard number
CSAT, or customer satisfaction score, is the share of respondents who rate a single interaction favorably right after it happens, usually on a 1-to-5 scale. CES, or customer effort score, is a companion score for the same moment, measured as agreement with a statement like “the company made it easy,” on a 1-to-7 scale. Asked together after the same call, chat or resolved case, the two answer different questions: did the outcome please the customer, and did getting it cost more than it should have.
Where they came from
CSAT descends from a much older discipline. The American Customer Satisfaction Index, launched by Claes Fornell and colleagues in the mid-1990s and detailed in their 1996 Journal of Marketing paper, formalized satisfaction as something a company could measure the same way every quarter, across an entire economy. By the time support teams began asking a version of the same question after a single ticket, satisfaction scoring was already decades-old research practice.
CES is younger and easier to date. Matthew Dixon, Karen Freeman and Nick Toman, researchers at the Corporate Executive Board (CEB, later acquired by Gartner), introduced it in a July 2010 Harvard Business Review article, “Stop Trying to Delight Your Customers.” Working from a study of more than 75,000 customers across phone, chat and self-service, they asked respondents how much effort they personally had to put forth to handle their request, on a 1-to-5 scale, and found the answer predicted loyalty better than satisfaction or likelihood to recommend. Three years later, in the 2013 book The Effortless Experience, Dixon, Toman and Rick DeLisi rewrote the question into a statement, “[Company] made it easy for me to handle my issue,” rated on a 1-to-7 agreement scale. That revision, known as CES 2.0, is the version most companies use today, because agreeing or disagreeing with a statement produces steadier answers than a self-reported effort rating.
How to ask and calculate each one
Both scores use the same arithmetic: count the top ratings, divide by total responses, multiply by 100. For CSAT on a 5-point scale, a 4 or a 5 counts as satisfied. For CES 2.0 on a 7-point scale, a 6 or a 7 counts as easy.
Take a software company’s live chat support. In one week, 250 chats close and 150 customers answer the two-question survey sent right after. On CSAT, 114 respondents rate the chat 4 or 5, for a CSAT of 76% (114 divided by 150). On CES, only 87 respondents agree the company made it easy, a CES of 58% (87 divided by 150). The gap matters more than either number alone: most customers left satisfied, but a large minority worked harder than they should have to get there, exactly the pattern a single averaged score would hide.
A one-line open-ended follow-up, “What made that easy or hard?”, turns the CES number from a symptom into a diagnosis. Without it, a team knows effort was high somewhere in the chat and has to guess where.
Why effort predicted loyalty better than delight
In the CEB research behind CES, 96% of customers who put in high effort to resolve an issue became more disloyal afterward, and a service interaction was reported to be almost four times more likely to drive disloyalty than to build it, according to the same 2010 CEB findings. Companies that had spent years training staff to delight customers, free upgrades and handwritten notes, were solving the wrong problem for most people. What most customers wanted from a service interaction was for it to be over, correctly, on the first try.
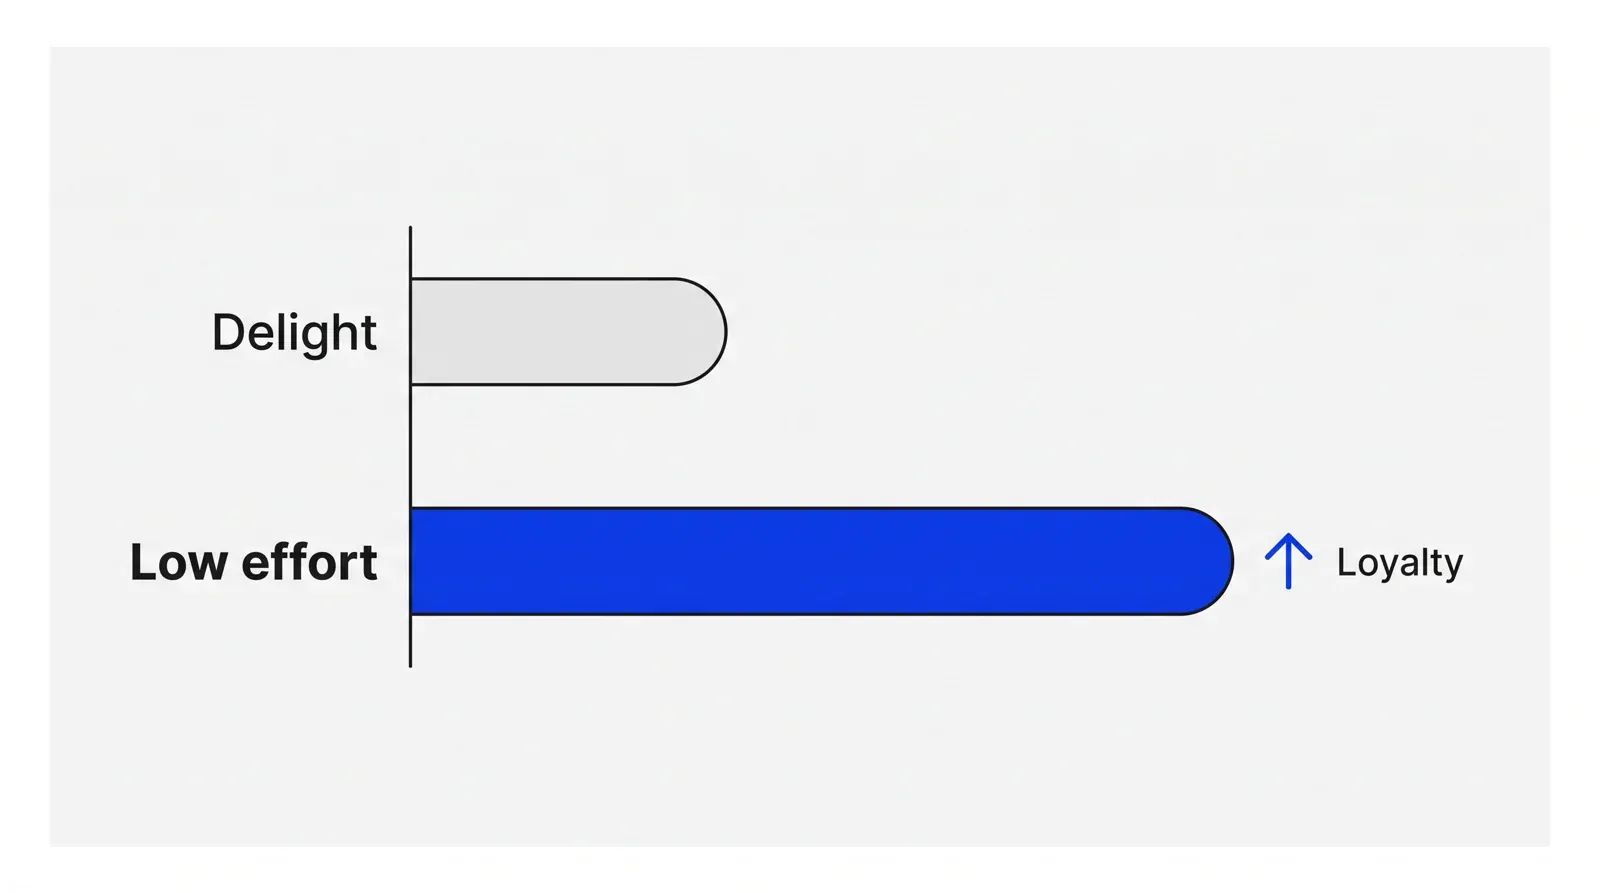
This is why CES is worth tracking next to CSAT rather than instead of it. CSAT shows whether the outcome pleased the customer. CES shows whether the process punished them on the way there. A high CSAT next to a high CES is the best pairing a team can see; a high CSAT next to a low CES is a warning most businesses only find once they ask the second question.
How CSAT and CES relate to NPS
Net Promoter Score answers a third question: how the customer feels about the whole relationship, beyond any one interaction. Fred Reichheld introduced NPS in a 2003 Harvard Business Review article, “The One Number You Need to Grow,” arguing that a single question, how likely a customer is to recommend the company to a friend or colleague, on a 0-to-10 scale, predicted growth better than any other measure his research tested.
| CSAT | CES | NPS | |
|---|---|---|---|
| Asks | How satisfied were you with this interaction? | Did the company make it easy to handle your issue? | How likely are you to recommend the company? |
| Scope | One interaction | One interaction | The whole relationship |
| Timing | Right after the interaction | Right after the interaction | Periodically, independent of any single interaction |
| Best for | Whether the outcome pleased the customer | Whether the process cost the customer unnecessary work | Whether the relationship is growing or shrinking overall |
CSAT, CES and NPS answer different questions at different points in the relationship, and a team tracking only one of them is missing at least one of the other two.
The academic debate over single-question metrics
Reichheld’s claim that NPS outperforms every other metric has not held up cleanly in later, independent research. Timothy Keiningham and colleagues retested it in a 2007 Journal of Marketing paper, using 21 Norwegian firms and more than 15,500 interviews from the Norwegian Customer Satisfaction Barometer: NPS correlated strongly with revenue growth in some industries, negatively in others, and the paper concluded NPS is “not always a clear winner” over ordinary satisfaction measures. The study won the Marketing Science Institute’s H. Paul Root Award.
Neil Morgan and Lopo Rego reached a similar conclusion from a different angle in a 2006 Marketing Science paper. Studying 80 publicly traded companies against the American Customer Satisfaction Index database, they found satisfaction and loyalty metrics together explained only 1% to 16% of the variance in financial outcomes like market share and cash flow, and that plain average satisfaction, not their version of NPS, was the strongest single predictor of market share.
None of this means a single survey question is inherently weak. Lars Bergkvist and John Rossiter’s 2007 Journal of Marketing Research study found that single-item measures predict as well as longer, multi-item scales for a concrete, singular construct, which one specific interaction’s satisfaction or effort usually is. The debate is narrower than it sounds: a short question can carry weight, and what matters is which one, about which scope, asked at which moment, predicts the outcome a business cares about. A team can settle that question with its own data instead of borrowing a conclusion from someone else’s industry.
Timing, scale and the missing follow-up
Three practical choices decide whether CSAT and CES produce a usable signal or a vanity number.
Timing comes first. Send the survey immediately after the interaction closes, while the details are fresh, the same discipline that makes a customer journey map useful: both work better built from recent, real behavior than from a customer’s memory weeks later.
Scale choice matters less than keeping the scale fixed. A 5-point scale for CSAT and a 7-point agreement scale for CES 2.0 are what most sources use, but the length matters far less than never changing it mid-series, since a jump in the score after a scale change looks like a real change when it isn’t one.
Response bias is the quiet problem underneath both scores. A 2018 study of more than 170,000 Samsung customer service chats found that the small share of customers who rated a chat skewed sharply positive, while the majority who never rated would likely have scored the same chats lower. A CSAT or CES built only from people who chose to answer overstates how the average customer experienced the interaction, a bias worth naming rather than treating the score as a full picture.
A score with no open-text follow-up is hard to act on for the same reason: the number says something broke, only the comment says where. Run CSAT and CES as a standing part of a marketing operational system, read next to each other and against the comments behind them, and checked again next quarter instead of filed away after the first survey goes out.
How to apply CSAT & CES, step by step
- Pick the one moment to ask about. Choose a single interaction to trigger the survey: a support call ends, a chat closes, a dispute resolves. A score attached to a whole relationship instead of one moment tells a team nothing about which step to fix. Result: one clear trigger, the same one every time.
- Write both questions on a fixed scale. Ask CSAT as 'How satisfied were you with this call?' on a 1-to-5 scale, and CES as 'The company made it easy for me to handle my issue' on a 1-to-7 agreement scale. Keep the wording and the scale fixed every time the score gets compared. Result: two short questions a customer can answer in seconds.
- Add one open-ended follow-up. Ask a single free-text question after the rating: 'What made that easy or hard?' A score with no comment attached says something is wrong without saying what. Result: a reason attached to every low score, not just a number.
- Calculate CSAT and CES separately. CSAT: count the top-two-box responses (4s and 5s on a 5-point scale), divide by total responses, multiply by 100. CES: the same top-two-box method on the 7-point scale (6s and 7s), the same formula. Result: two percentages, tracked on their own, never averaged into one number.
- Read the gap, not just each score. Compare the two numbers for the same period. A high CSAT next to a low CES means customers got what they wanted but had to work harder than they should have, a pattern a single blended score would hide. Result: one sentence describing where the experience broke.
- Give the low score an owner. Route interactions with a low CES, or a CSAT paired with an effort comment, to whoever owns that step: a script, a form, a policy. Result: one person accountable for the fix, with a date to recheck the score.
Examples
A clinic after a booking call
Illustrative: a physiotherapy clinic texts a two-question survey after every booking call, 180 calls in a month, 120 replies. CSAT lands at 80% (96 of 120 rate the call 4 or 5). CES lands at 55% (66 of 120 agree the clinic made it easy), because callers were put on hold twice before reaching someone who could book them. The gap between 80% and 55% is the finding, not either number alone.
A fintech after a card-dispute resolution
Illustrative: a card issuer surveys customers once a dispute closes, 90 resolved cases, 60 replies. CSAT reads 85% (51 of 60 rate 4 or 5), because most customers got their money back. CES reads 40% (24 of 60 agree the process was easy), because the same customers submitted evidence twice and called three times to get there. A team watching CSAT alone would miss the process problem completely.
When to use it
Use CSAT and CES together right after a single transactional interaction, a support call, a chat, a claim or a dispute resolution, when a team needs to know not just whether the customer was satisfied but whether getting that outcome cost them unnecessary work.
When not to use it
Skip both when the goal is the health of the overall relationship rather than one interaction; that question belongs to NPS, asked periodically, not after every touch. Skip CES specifically when an interaction requires real effort by design, a mortgage application with mandatory documentation, where a low score describes the product rather than a fixable friction point.
Common mistakes
- Averaging CSAT and CES into one blended score, which hides the exact gap the two questions exist to reveal.
- Asking about the whole relationship instead of one interaction, which produces a score closer to NPS than to CSAT or CES and confuses the two.
- Changing the question wording or the scale between periods, which breaks any trend line built from the score.
- Reading a score with no open-ended follow-up and guessing at the cause instead of asking directly.
- Treating the small group of people who bother to answer as representative of everyone who had the interaction, when the quiet middle rarely responds at all.
FAQ
What is the difference between CSAT and CES?
CSAT asks how satisfied a customer felt with one interaction, on a 1-to-5 scale. CES asks how much effort that interaction took, as agreement with 'the company made it easy,' on a 1-to-7 scale. A customer can rate CSAT high and CES low when they got what they wanted only after unnecessary work.
Is CES a better predictor of loyalty than CSAT?
A 2010 CEB study behind the original Harvard Business Review article on Customer Effort Score found effort predicted loyalty better than satisfaction or Net Promoter Score in that data set. It is one research team's finding, not a settled result across the field, so a business is better off tracking whichever gap shows up in its own numbers.
How do you calculate CSAT?
Count responses of 4 or 5 on a 5-point satisfaction scale, divide by the total number of responses, and multiply by 100. A CSAT of 75% means three out of four respondents rated the interaction as satisfying. The same top-two-box method applies to CES on its own scale.
Is Net Promoter Score better than CSAT and CES?
Fred Reichheld's 2003 research argued NPS was the single best predictor of growth. Peer-reviewed replications since then, including Keiningham et al. (2007) and Morgan and Rego (2006), did not find NPS reliably superior to satisfaction metrics across industries. NPS also answers a different question, relationship-level loyalty, than CSAT and CES, which cover one interaction.
How soon after an interaction should you send a CSAT or CES survey?
Send it immediately after the interaction closes, while the details are still fresh, not days later when a customer is recalling an impression rather than an event. A delayed survey also skews toward whoever remembers to reply, rarely a neutral sample of everyone who had the interaction.
Sources
- Matthew Dixon, Karen Freeman, Nick Toman, Stop Trying to Delight Your Customers, Harvard Business Review, July-August 2010
- Matthew Dixon, Nick Toman, Rick DeLisi, The Effortless Experience, Portfolio, 2013
- Matthew Dixon, Lara Ponomareff, Scott Turner, Rick DeLisi, Kick-Ass Customer Service, Harvard Business Review, January-February 2017
- Fred Reichheld, The One Number You Need to Grow, Harvard Business Review, December 2003
- Timothy L. Keiningham, Bruce Cooil, Tor Wallin Andreassen, Lerzan Aksoy, A Longitudinal Examination of Net Promoter and Firm Revenue Growth, Journal of Marketing 71(3), 2007
- Neil A. Morgan, Lopo L. Rego, The Value of Different Customer Satisfaction and Loyalty Metrics in Predicting Business Performance, Marketing Science 25(5), 2006
- Lars Bergkvist, John R. Rossiter, The Predictive Validity of Multiple-Item versus Single-Item Measures of the Same Constructs, Journal of Marketing Research 44(2), 2007
- Claes Fornell, Michael D. Johnson, Eugene W. Anderson, Jaesung Cha, Barbara Everitt Bryant, The American Customer Satisfaction Index: Nature, Purpose, and Findings, Journal of Marketing 60(4), 1996
- Kunwoo Park, Meeyoung Cha, Eunhee Rhim, Positivity Bias in Customer Satisfaction Ratings, arXiv:1803.03346 (WWW'18), 2018
- Ipsos, Paper 'A Longitudinal Examination of Net Promoter and Firm Revenue Growth' Awarded the 2007 Marketing Science Institute/H. Paul Root Award
- MeasuringU, article summary of A Longitudinal Examination of Net Promoter and Firm Revenue Growth
- MeasuringU, article summary of The Value of Different Customer Satisfaction and Loyalty Metrics in Predicting Business Performance
- Quality Digest, Study: Reducing Customer Effort Is Key to Managing Loyalty, June 2010
- Qualtrics, What is CSAT and How Do You Measure It?
- Qualtrics, Customer Effort Score (CES) and How to Measure It
- Qualtrics, What is Response Bias and How Can You Avoid It?
- Zendesk, What is customer satisfaction score (CSAT) and how to measure it
- IBM, What is a customer effort score?
- CustomerGauge, NPS vs CES vs CSAT: Which Customer Experience Metric To Use?
- Jim Tincher, Heart of the Customer, Customer Effort Score 2, Is it easy?
- Nice Reply, Introduction to Customer Effort Score
- HubSpot, Net Promoter Score, glossary
- Nielsen Norman Group, Rating Scales
Last updated Sep 25, 2026


The compliance layer under fintech marketing operations
A fintech marketing agency can build campaigns. It cannot own the compliance review, the KYC drop-off or the multi-market licensing rules that decide whether a lead ever becomes a customer.

Fractional CMO: what you get, and what has to exist underneath
A fractional CMO brings strategy and judgment. Without reporting, CRM hygiene and a named owner per number, the engagement produces a slide deck instead of a system.

The operations layer behind healthcare patient acquisition
Ads and search bring the request in. What happens between the click and the booked, attended visit decides whether the spend paid off.