GE-McKinsey matrix
The GE-McKinsey matrix scores a company's business units on two composite measures, industry attractiveness and business unit strength, so leaders can weigh several factors into one investment call per unit instead of relying on two raw numbers.
The GE-McKinsey matrix is a nine-cell grid that scores a company's business units on two composite measures, industry attractiveness and business unit strength, each built from several weighted factors rather than one number. McKinsey developed it for General Electric in the early 1970s, after GE's portfolio outgrew the two clean numbers behind BCG's growth-share matrix.
- Origin
- McKinsey & Company, for General Electric, early 1970s
- Level
- 201 · Tool
- Fits
- Enterprise
- Time to apply
- a day to agree the factor weights as a team, then an afternoon to score and plot each business unit
- What you need
- a list of the business units or products you plan to compare · agreement in the room on which factors define an attractive industry and a strong position, before any scoring starts
The GE-McKinsey matrix is a nine-cell grid that scores a company’s business units on two composite measures, the attractiveness of each unit’s industry and the unit’s strength inside it, and uses the result to decide which units get investment, which get a selective bet and which get harvested for cash. McKinsey built it for General Electric in the early 1970s, a few years after Boston Consulting Group’s growth-share matrix, according to McKinsey’s own 2008 account of the tool, aimed at a gap that matrix left open: a portfolio too varied for two measured numbers to sort fairly.
The history behind the label runs through both consultancies. Fred Borch, GE’s CEO from 1963 to 1972, created the Chief Executive Office in 1968 and, working with outside consultants from both Boston Consulting Group and McKinsey, developed the concepts of Strategic Business Units and portfolio planning, according to a 2008 Long Range Planning history of GE’s strategic planning by William Ocasio and John Joseph. McKinsey’s consultants argued the right level for competitive analysis did not match GE’s existing group-division-department structure and proposed SBUs superimposed on top of it. Under Borch’s successor, Reginald Jones, the SBU count and its review load grew fast enough that Jones later said the corporate office was spending too much of its own time on it, one pressure behind GE’s push for a faster way to sort its businesses.
The two axes, and what feeds each one
Two composite scores place a business unit on the grid. Industry attractiveness asks how good the unit’s market is to compete in, built from factors such as market size, growth rate, industry-wide margins, competitive intensity, pricing trends and barriers to entry, per a 2019 overview from EBSCO Research Starters. Business unit strength asks how well positioned the unit already is: market share, cost position, brand reputation, distribution reach, management depth.
Both axes compress a bigger question than a single metric can answer alone. Porter’s five forces is one accepted way to ground the attractiveness axis in industry structure, rivalry, buyer and supplier power, new entrants and substitutes, rather than in a manager’s impression of a market.
Turning several factors into one score
A composite score is a weighted average. Each factor gets a weight that reflects how much it matters, the weights on one axis add up to 1.0, and each rating, usually scored 1 to 5, gets multiplied by its weight and summed.
Take a logistics company scoring its freight-forwarding unit, illustrative numbers only. On industry attractiveness, the team weights five factors and rates the market on each one:
| Factor | Weight | Rating | Weighted score |
|---|---|---|---|
| Market growth rate | 0.30 | 4 | 1.20 |
| Industry-wide profit margins | 0.25 | 3 | 0.75 |
| Competitive intensity (low intensity rates higher) | 0.20 | 2 | 0.40 |
| Regulatory stability | 0.15 | 4 | 0.60 |
| Barriers to entry | 0.10 | 3 | 0.30 |
| Total | 1.00 | 3.25 |
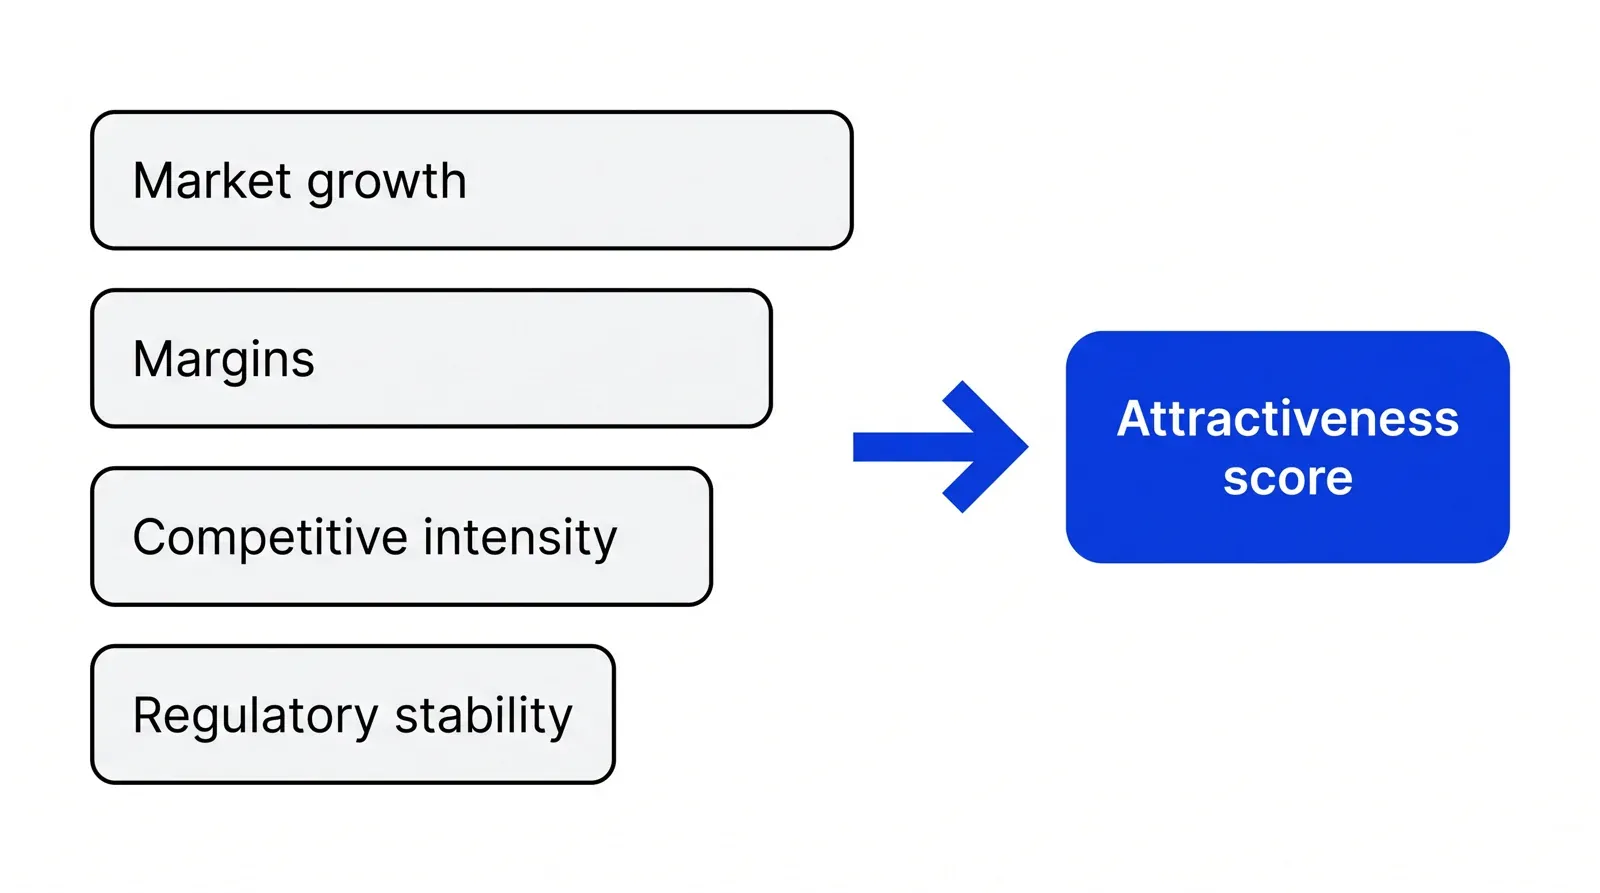
The weights add up to 1.00 and the weighted scores add up to 3.25 out of a possible 5, a market this team would likely call medium attractiveness rather than high or low. Business unit strength works the same way, with its own factors and its own weights:
| Factor | Weight | Rating | Weighted score |
|---|---|---|---|
| Market share | 0.30 | 4 | 1.20 |
| Cost position vs rivals | 0.25 | 4 | 1.00 |
| Brand reputation | 0.20 | 3 | 0.60 |
| Distribution reach | 0.15 | 3 | 0.45 |
| Management depth | 0.10 | 2 | 0.20 |
| Total | 1.00 | 3.45 |
The nine cells and three zones
The two composite scores place a unit in one of nine cells, and the nine cells group into three zones read straight off the diagonal: above it, invest and grow; along it, selective investment; below it, harvest or divest, in McKinsey’s own description of how the grid works.
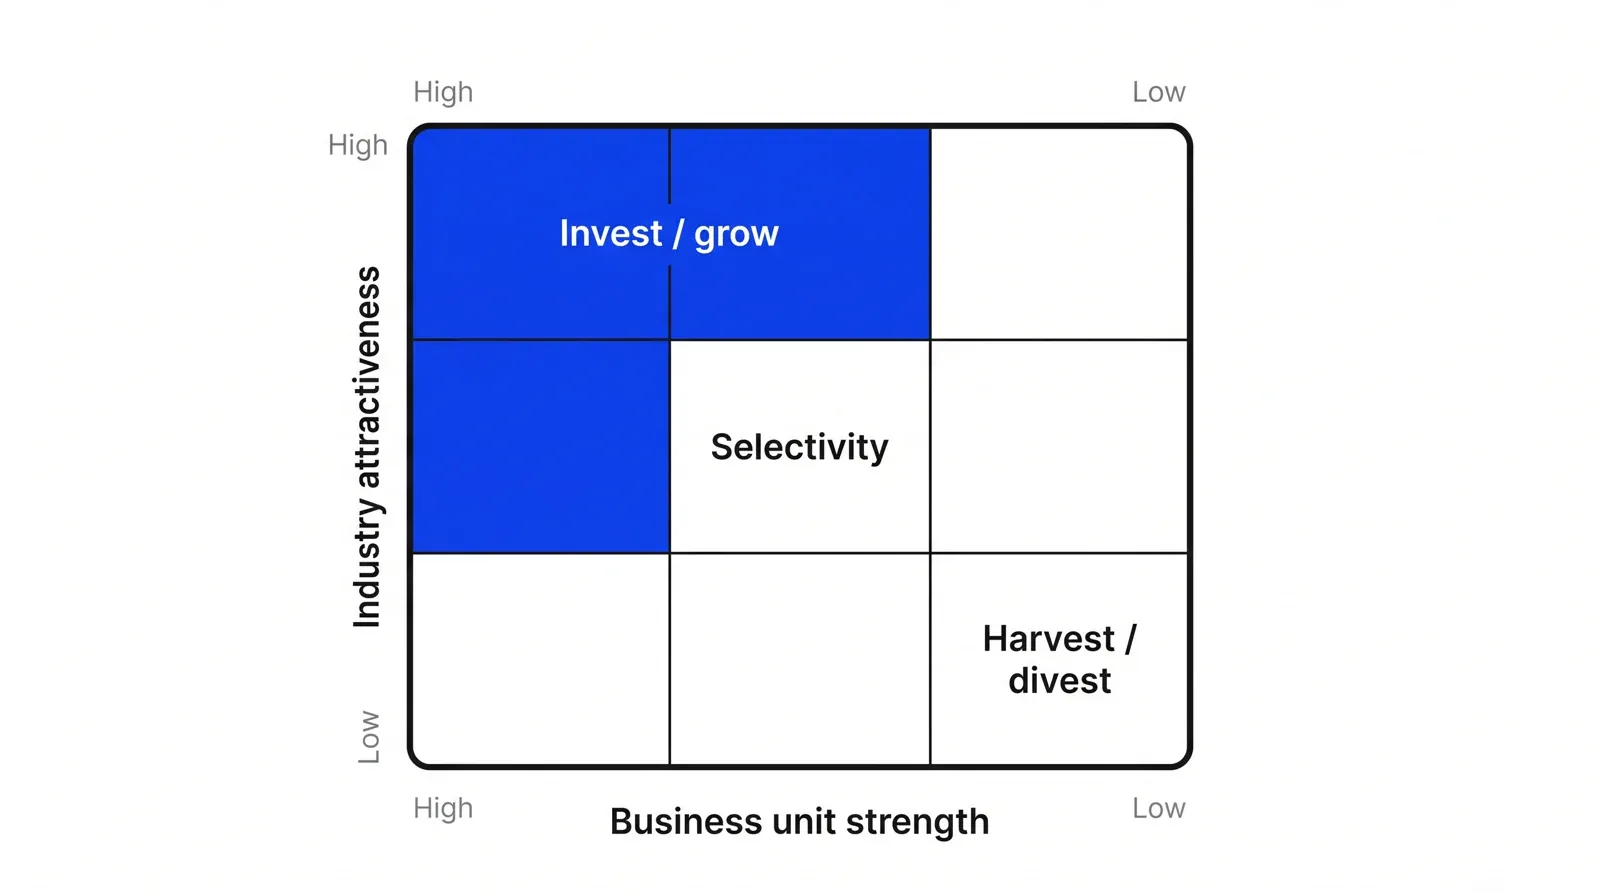
A unit high on both axes gets the clearest case for funding, a unit low on both the clearest case for harvesting its cash and walking away. Everything near the diagonal, strong today in a middling market or middling today in a strong market, needs a decision instead of a default, the reason for three zones rather than a single verdict. The freight-forwarding unit scored above, medium on both axes at 3.25 and 3.45, lands in that middle band, a case for a decision, with a deadline, before the next planning cycle. Once a unit clears into Invest and grow, the Ansoff matrix answers the next question: which direction that growth should come from.
GE-McKinsey matrix against the BCG matrix
Both are two-axis grids from the same era of strategy consulting, built to answer a similar question with different amounts of judgment.
| BCG growth-share matrix | GE-McKinsey matrix | |
|---|---|---|
| Axes | Market growth rate, relative market share | Industry attractiveness, business unit strength |
| Built from | Two measured numbers | Several weighted factors per axis, chosen by the team |
| Grid | Four boxes | Nine cells, grouped into three zones |
| Best fit | A portfolio simple enough for two numbers to sort fairly | A large or uneven portfolio where two numbers overlook differences that matter |
Use BCG’s growth-share matrix when a portfolio is simple enough for two numbers to sort it fairly, and reach for the GE-McKinsey matrix once it is too mixed, in regulation, technology or competitive intensity, for two numbers to carry the weight alone, the exact gap GE’s own planners hit once its business lines stopped looking alike.
Where the weights and scores get criticized
Critics aim less at the grid’s shape and more at the judgment inside every weight and every rating. Philippe Haspeslagh’s 1981 INSEAD working paper, later published in Harvard Business Review as “Portfolio Planning: Uses and Limits,” named the GE-McKinsey grid alongside BCG’s and A.D. Little’s as one of several competing grids, and argued that the choice of grid barely matters next to the harder problem underneath it: defining the business correctly and assigning it a strategic mission, work he found “heavily influenced by administrative considerations” rather than by the numbers on the page. Corporate officers, in his 1979 survey of Fortune 1000 companies, could still feel “too far away to see the trees yet standing too close by to take in the forest” with a completed grid in front of them.
Academic assessments through the 1980s reached similar conclusions from different angles. Robin Wensley’s 1982 Strategic Management Journal review found that BCG’s matrix and the PIMS-based approach it was compared against both failed to capture the full effect of competitor response and risk, a gap that survives translation into a weighted score just as easily. Jean-Claude Larréché and V. Srinivasan built a computerized alternative, STRATPORT, in 1982, because grid-based judgment calls were too easy to misapply alone. Michael Nippa, Ulrich Pidun and Harald Rubner’s 2011 review of four decades of research on these tools found academic attention falling sharply after the 1980s, even as McKinsey’s own account claims most large companies with a formal approach to modeling their businesses still use the nine-box grid or a descendant of it.
The labels carry a separate risk from the scoring itself. J. Scott Armstrong and Roderick Brodie’s experiment with over a thousand subjects found that simply knowing about BCG’s Star and Dog labels pushed most subjects toward the labeled Star even when the numbers favored the labeled Dog, an effect tied to the mental accounting Amos Tversky and Daniel Kahneman described in their research on framing. A cell named Invest or Harvest can carry the same pull. Checking the arithmetic and revisiting the weights on schedule, rather than trusting whatever a cell happens to be named this quarter, is what keeps a nine-box grid closer to analysis than to a label that talks a team into a decision it already wanted.
Run the weighting session as a live discussion inside the capital-allocation cadence Pushers’ Growth Lab work is built around, weights written down and revisited on schedule, and a nine-cell grid from the 1970s earns its place in a planning meeting instead of decorating one.
How to apply GE-McKinsey matrix, step by step
- List the units competing in distinct markets. Include only units that face distinct customers, regulation or competitors. A feature or a sales channel inside one business is not its own unit to score separately.
- Choose and weight the industry attractiveness factors. Agree, as a team, on the handful of factors that make a market attractive: market size, growth rate, industry-wide margins, competitive intensity, regulatory stability. Give each one a weight, and check that the weights add up to 1.0 before anyone scores anything.
- Score each unit's industry and compute the composite. Rate each factor for each unit, usually 1 to 5, multiply by its weight, and add the results into one attractiveness score per unit. Recheck the arithmetic; a wrong weight quietly moves a unit into the wrong third of the axis.
- Repeat the same process for business unit strength. Weight a separate set of factors, market share, cost position, brand, distribution, management depth, and score each unit against them the same way, into one strength score.
- Plot each unit on the nine cells. Mark attractiveness on the vertical axis, high at the top, and strength on the horizontal axis, high on the left. Size each circle to the unit's revenue so the chart also shows where the money already sits.
- Assign a zone and a resourcing decision. Read the diagonal: cells above it get investment and growth funding, cells along it get a selective, time-boxed bet, cells below it get harvested or sold. Revisit the whole exercise on the next planning cycle, since both axes move as markets and competitors change.
Examples
A fintech's three business units
Illustrative. A card-payments business sits in a mature, tightly regulated market the group already leads: strong on the strength axis, only medium on attractiveness once thinning margins and competitive intensity are scored in, a case for selective, defensive investment rather than a blank check. A cross-border FX product competes in a market still growing fast, where the group holds the third-largest share behind two bigger rivals: attractive industry, a weaker position today, worth a real funding bet if the group can close the share gap quickly. A newer consumer-lending unit scores high on both axes, an attractive market and a cost and distribution edge over its two nearest rivals: the clearest case for growth funding of the three.
A healthcare group's clinic lines
Illustrative. General outpatient care is the group's largest line, its attractiveness score held down by thin margins and heavy price competition, but the group's scale and reputation keep its strength score high, a case for selective investment: protect the lead, fund only what defends it. A cosmetic and aesthetic-medicine line scores high on attractiveness, growing demand and healthy margins, while the group is still building its position against two established local rivals, worth real growth funding if leadership backs it with a real budget. An in-house physiotherapy service scores low on both axes, a shrinking referral base and a position the group never really built, the case the matrix flags for harvesting rather than funding.
When to use it
Use it when a company runs a diverse portfolio, different industries, regulatory regimes or competitive dynamics, where BCG's two clean numbers stop being a fair comparison and a leadership team needs a structured way to weigh several factors into one investment call per business unit.
When not to use it
Skip it for a small or single-industry portfolio, where BCG's simpler growth and share numbers already sort things fairly, or when leadership will not spend the time agreeing on which factors matter and how much each one counts. A rushed set of weights produces a false sense of precision rather than a real judgment.
Common mistakes
- Treating the weighted score as objective when the choice of factors and their weights is itself a judgment call, one easy to tilt toward a result leadership already wants.
- Skipping the arithmetic check, so weights that do not actually add up to 1.0 quietly warp a business unit's score without anyone noticing.
- Scoring the industry once and never updating it, so a unit plotted years ago keeps its old zone long after its market has changed.
- Using the same factor weights for every business unit in a diverse portfolio, when a fair attractiveness scale for a lending business does not fit an FX business.
- Treating Selectivity as a polite word for indecision instead of naming what evidence, and what deadline, would move a unit into Invest or Harvest.
FAQ
What is the GE-McKinsey matrix?
The GE-McKinsey matrix is a nine-cell grid that scores a company's business units on two composite measures, industry attractiveness and business unit strength, each built from several weighted factors. McKinsey developed it for General Electric in the early 1970s to sort a portfolio too varied for BCG's growth-share matrix to sort fairly.
What is the difference between the GE-McKinsey matrix and the BCG matrix?
The BCG matrix places a business on two measured numbers, market growth rate and relative market share. The GE-McKinsey matrix places it on two composite scores, industry attractiveness and business unit strength, each built from several weighted factors that the team doing the scoring chooses itself.
How do you score industry attractiveness in the GE-McKinsey matrix?
Pick factors such as market size, growth rate, industry margins, competitive intensity and barriers to entry, give each one a weight that adds up to 1.0 across all factors, rate the market on each factor, usually 1 to 5, and multiply and sum to get one composite score.
What are the three zones of the GE-McKinsey matrix?
Reading off the diagonal of the nine cells: above it is Invest and grow, along it is Selectivity, a case for a time-boxed bet rather than an automatic decision, and below it is Harvest or divest, McKinsey's own description of how the grid's zones work.
Is the GE-McKinsey matrix still used today?
McKinsey's own 2008 account claims most large companies with a formal approach to modeling their businesses still use the nine-box grid or a descendant of it, while a 2011 Academy of Management Perspectives review found academic attention to these tools falling sharply after the 1980s. Both can be true: the tool persists in practice more than it does in research.
Sources
- McKinsey Quarterly, Enduring Ideas: The GE–McKinsey Nine-Box Matrix, 2008
- Philippe Haspeslagh, Portfolio Planning: Uses and Limits, Harvard Business Review, 1982
- Philippe Haspeslagh, Portfolio Planning, Use and Usefulness, INSEAD Working Paper 81/19, 1981
- Yoram Wind, Vijay Mahajan, Designing Product and Business Portfolios, Harvard Business Review, 1981
- Arnoldo C. Hax, Nicolas S. Majluf, The Use of the Industry Attractiveness-Business Strength Matrix in Strategic Planning, Interfaces, 1983
- Robin Wensley, PIMS and BCG: New Horizons or False Dawn?, Strategic Management Journal, 1982
- Jean-Claude Larreche, V. Srinivasan, STRATPORT: A Model for the Evaluation and Formulation of Business Portfolio Strategies, Management Science, 1982
- George S. Day, Diagnosing the Product Portfolio, Journal of Marketing, 1977
- Michael Nippa, Ulrich Pidun, Harald Rubner, Corporate Portfolio Management: Appraising Four Decades of Academic Research, Academy of Management Perspectives, 2011
- William Ocasio, John Joseph, Rise and Fall, or Transformation? The Evolution of Strategic Planning at the General Electric Company, 1940-2006, Long Range Planning, 2008
- Charles W. Hofer, Dan Schendel, Strategy Formulation: Analytical Concepts, West Publishing, 1978, Internet Archive record
- EBSCO Research Starters, Edwin D. Davison, Corporate Strategy, 2019
- EBSCO Research Starters, Janine Ungvarsky, Growth-Share Matrix, 2020
- Bruce Henderson, The Product Portfolio, BCG Perspectives, 1970
- BCG, What Is the Growth Share Matrix?
- BCG, BCG Classics Revisited: The Growth Share Matrix, 2014
- Michael Porter, How Competitive Forces Shape Strategy, Harvard Business Review, 1979
- Michael Porter, From Competitive Advantage to Corporate Strategy, Harvard Business Review, 1987
- J. Scott Armstrong, Roderick Brodie, Effects of Portfolio Planning Methods on Decision Making: Experimental Results, International Journal of Research in Marketing, 1994
- Amos Tversky, Daniel Kahneman, The Framing of Decisions and the Psychology of Choice, Science, 1981
Last updated Sep 25, 2026


How to calculate channel payback and unit economics
A CAC number that only marketing believes is not a finance number. Here is how to calculate channel payback so both teams work from the same model.

Fractional CFO vs finance operations: which gap do you actually have
A fractional CFO is a person. Finance operations is a system. Most companies searching for one are missing the other, or both.

Why channel tests stall after month three
Most paid channel tests do not end with a decision. They end when the budget runs out, the attribution model changes, or everyone quietly stops looking at the dashboard.