BPMN process mapping
BPMN is a small, standard set of shapes, events, activities, gateways, sequence flow, pools and lanes, for drawing a business process so a manager and a developer read the same diagram.
BPMN, Business Process Model and Notation, is a standard set of shapes for drawing a business process: events, activities, gateways, sequence flow, pools and lanes. BPMI.org released BPMN 1.0 in 2004, written mainly by Stephen A. White of IBM. The Object Management Group took over the standard in 2005 and finalized BPMN 2.0 in December 2010.
- Origin
- BPMI.org, principal author Stephen A. White (IBM); standard taken over by the Object Management Group (OMG), 2004; 2011
- Level
- 201 · Tool
- Fits
- Small and mid-size, Scale-up, Enterprise
- Time to apply
- Half a day to map one process end to end; a short review whenever the process changes
- What you need
- a process with an actual start and an actual end · one person from each role who does the work, not just their manager
BPMN, Business Process Model and Notation, is a small, fixed set of shapes for drawing how a business process runs: events, activities, gateways, sequence flow, pools and lanes. A manager reads the same diagram a developer builds software from, because every shape on the page carries one agreed meaning instead of whatever the person drawing it happened to intend that day.
Where the notation came from
BPMN was written by an industry group, not one company, and it changed hands twice before it became an international standard. The Business Process Management Initiative, BPMI.org, released BPMN 1.0 to the public on May 3, 2004. Stephen A. White of IBM was the specification’s principal author and edited it on behalf of the BPMI Notation Working Group, whose members had already spent more than two years on the effort.
BPMI then merged its business process management work into the Object Management Group, announced on June 29, 2005. OMG’s own Business Modeling and Integration group finalized its formal version of BPMN 1.0 afterward, a document OMG’s own specification history lists with an adoption date of March 2007. So the notation has two correct dates, depending on what is being counted: BPMI wrote and released it in 2004, OMG finished absorbing and formally publishing it by 2007.
OMG kept developing the standard, adding a formal way to tie a diagram to executable software, and finalized BPMN 2.0 in December 2010, publishing the formal specification in January 2011. BPMN 2.0.1 then became an international standard, ISO/IEC 19510, in 2013, the version most tools implement today.
The few shapes that carry the meaning
A BPMN diagram needs only a handful of shapes to say something useful, and White’s own introduction to the notation makes that an explicit design goal: the core shapes exist so that “modelers do not have to learn and recognize a large number of different shapes.”
| Shape | What it means | Drawn as |
|---|---|---|
| Event | Something that happens: a start, a point along the way, or an end | Circle |
| Activity | A task a person or a system performs | Rounded rectangle |
| Gateway | A point where the process branches or comes back together | Diamond |
| Sequence flow | The order tasks happen in, inside one process | Solid arrow |
| Pool | One participant in the diagram, a whole company or system | Large rectangle |
| Lane | One role or team working inside a pool | A stripe inside the pool |
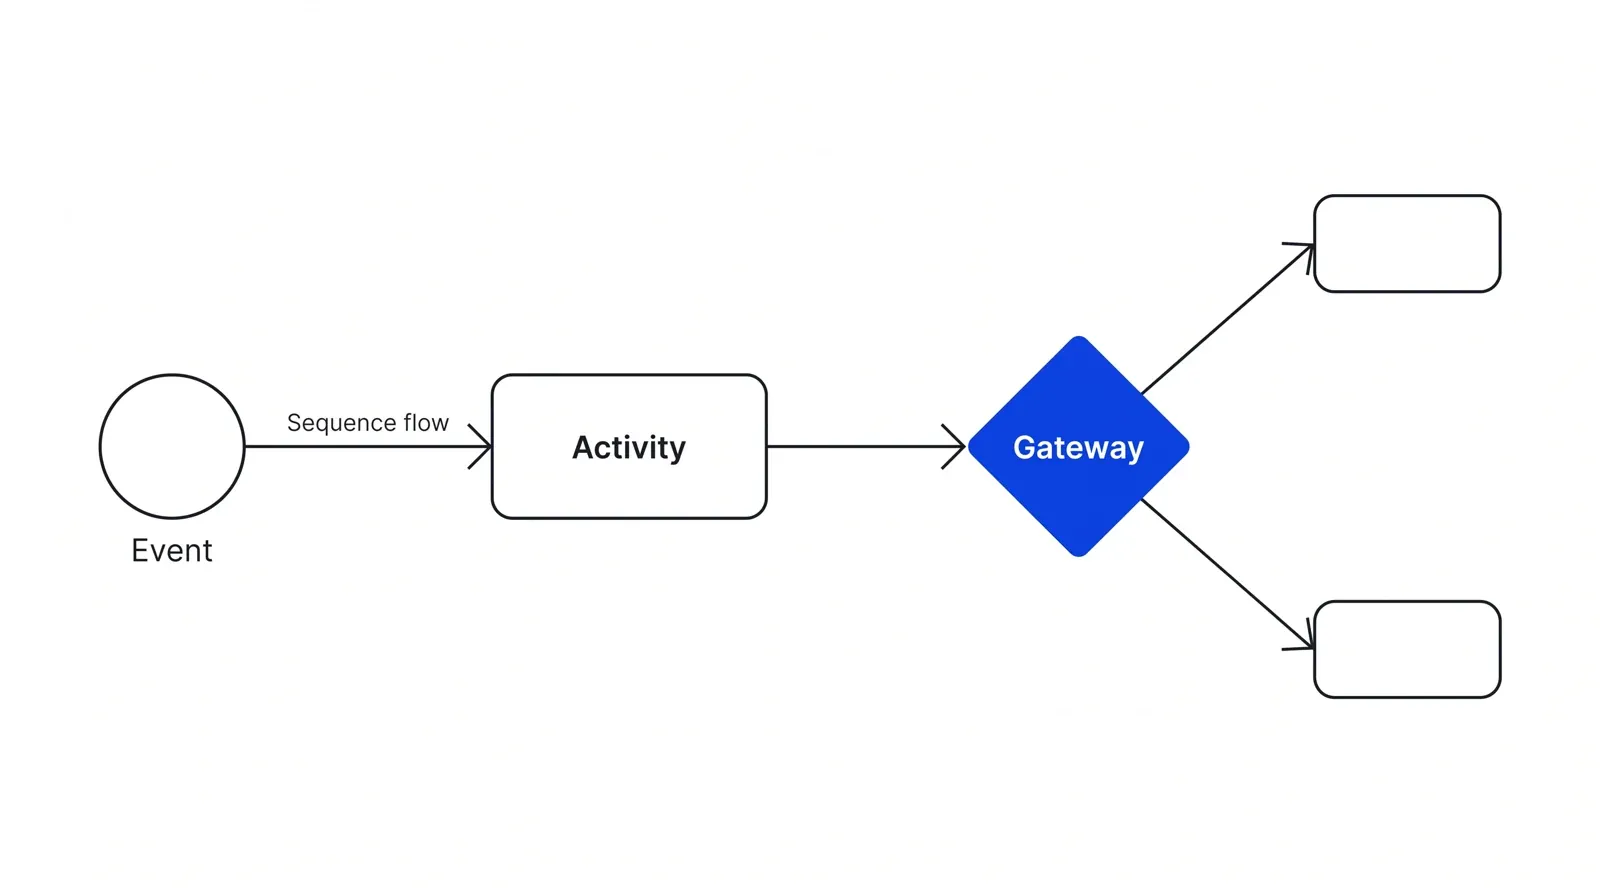
The full BPMN specification defines 53 constructs, far beyond this table, for orchestration, choreography and exception handling that most teams never touch. A 2010 survey of practicing BPMN users found that only about a third stick to the core set alone; the rest reach for extra symbols mostly because a tool offered them, not because the process demanded them. Start with the six shapes above. Add more only when a real gap in the diagram forces the question.
Gateways are where the decision happens
An exclusive gateway, marked with an X or left plain, sends the process down exactly one path: the payout is approved or it is declined, never both. A parallel gateway, marked with a plus, sends it down every path at once, useful when two teams work in parallel at the same time. Both are easy to read at a glance.
The third type, the inclusive OR gateway, lets any number of paths fire depending on the conditions, and it is the one type the research behind BPMN’s own modeling guidelines singles out to avoid. The guidelines are blunt about it: “avoid OR routing elements,” because a reader cannot tell from the diagram alone how many of the branching paths will run. An AND or an XOR gateway almost always says the same thing with far less room for misreading.
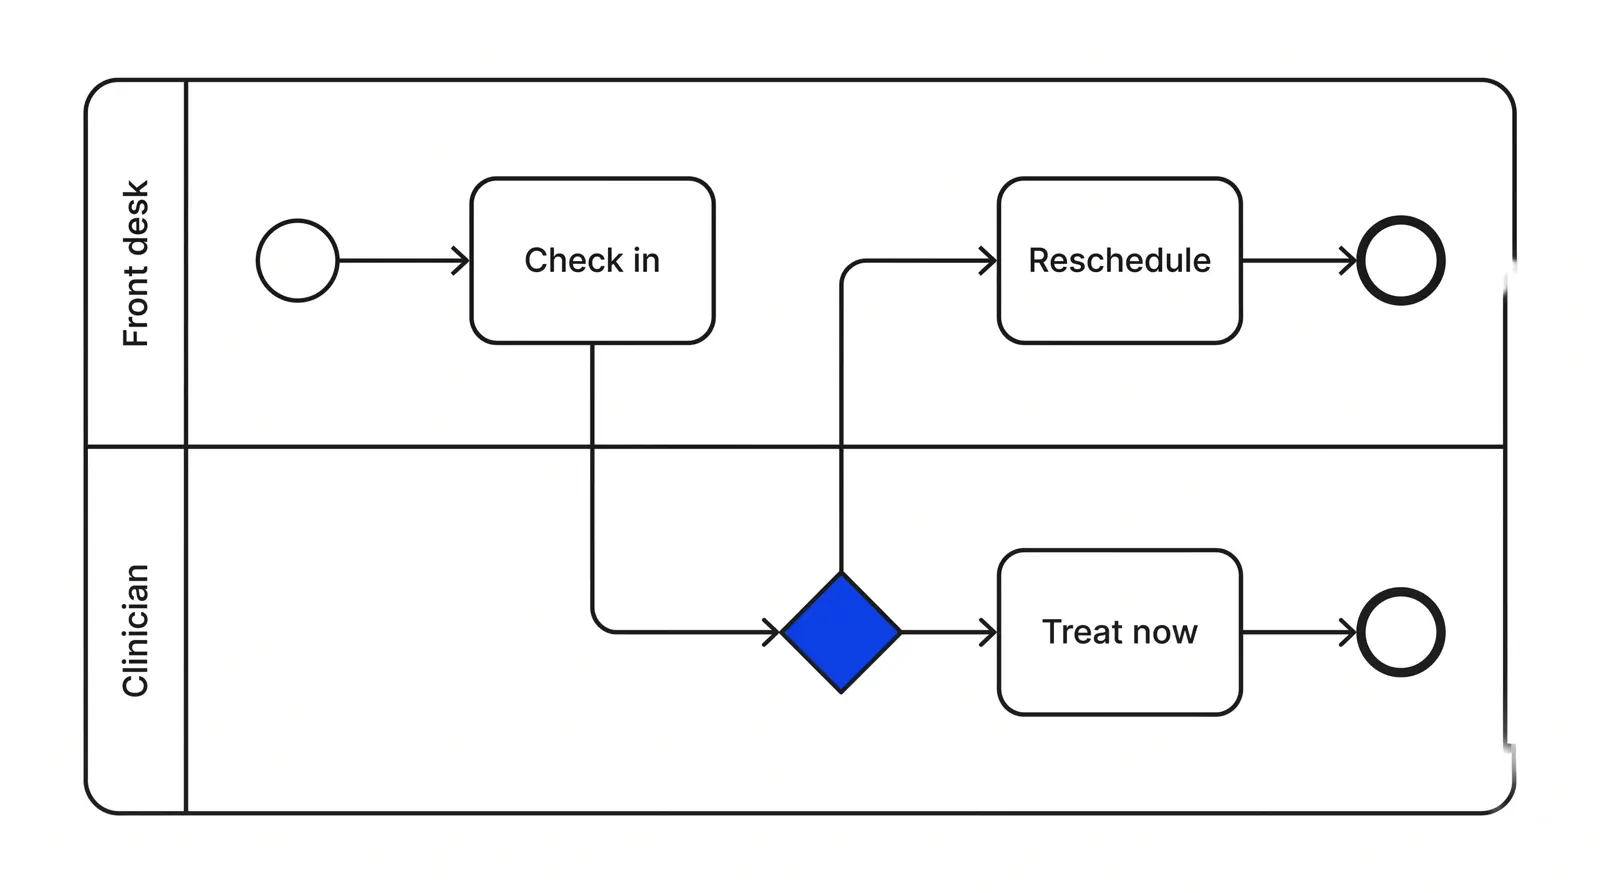
A process with one clean gateway, like the clinic example further down the page, is usually a sign the team already understands the process. A process with six gateways stacked in a row is usually a sign nobody has decided what the process is supposed to do.
Why a simpler diagram gets read
Research into what makes a process model understandable keeps landing on the same answer: size beats almost everything else. A study tracking students and professional modelers across three universities found that the number of elements in a diagram was the strongest single predictor of whether readers understood it correctly, ahead of how experienced the reader was. The finding reaches beyond BPMN. A classic 1987 study on diagrams versus plain text found that a well-built diagram lets a reader search for what they need by location on the page, instead of scanning line by line through a paragraph, and that advantage disappears the moment the diagram gets crowded enough to need its own search.
A 2017 review of more than seventy studies on process model comprehension reached a similar conclusion from a different direction: the diagrams people misread are rarely wrong on any single shape, they are simply carrying more elements and more tangled structure than a reader can hold in their head at once. This is the practical case for the six-shape table above: for most business audiences, the diagram with fewer shapes is the one that gets read.
When it gets confused with a plain flowchart
Teams that have used flowcharts for years sometimes treat a BPMN diagram as the same thing with fancier boxes. It solves a related but different problem.
| BPMN | A plain flowchart | |
|---|---|---|
| Shape meaning | Fixed by a published standard | Whatever the person drawing it intends |
| Who does the work | Pools and lanes assign every task to a role | Usually left out |
| Between two organizations | A separate message flow arrow | No distinction from any other arrow |
| Can drive software | Yes, since BPMN 2.0’s execution model | No |
| Learning curve | A short one, six shapes | None |
Most teams reach for BPMN once a plain flowchart stops answering who does this next, the moment a process crosses two roles or two companies. Pair it with a RACI matrix once the map is drawn: BPMN’s lanes show which role performs each step, RACI settles who is accountable when a step touches more than one lane. Run it inside the kind of process maps and playbooks Pushers builds into a client’s operating system, and the diagram survives past the workshop that drew it.
How to apply BPMN process mapping, step by step
- Name the start and the end. Pick the exact trigger that kicks the process off, a form submitted, a call answered, and the exact event that closes it, a payment settled, a patient discharged. A diagram with no clear start or end is the most common reason a reader gets lost.
- List every task in the order it happens. Write each task as a short verb-object phrase, check documents, approve refund, not a department name. Order them by what really happens on the floor, not by what the org chart says should happen.
- Put each role in its own lane. Draw one lane per person or role who does work in the process, not one lane per department. A lane called Compliance holds the compliance analyst's tasks, not the whole department's org chart.
- Turn every real decision into a gateway. Wherever the process branches, add a diamond and name each way out, approved and declined, not yes and no. A gateway with an unlabeled arrow is a decision nobody can audit later.
- Connect with the right kind of arrow. Use a solid sequence flow arrow for work moving inside one pool, and a dashed message flow arrow only when the process crosses into a separate participant's pool. Mixing the two is the most common syntax error in a first draft.
- Walk it with the person who does the job. Sit down with whoever performs each lane and trace the diagram step by step. Every place they hesitate or correct you is a task, a gateway or a handoff the diagram got wrong.
Examples
A fintech payout process
Take a payments company approving payouts to merchants, an illustrative example. A merchant's payout request starts the process. The operations lane checks the balance and runs a routine risk score; one gateway asks whether the score clears the threshold. Below it, the payout goes straight to a scheduled-payment activity. Above it, the compliance lane runs a manual KYC review first, then the same payout activity. Both paths end at payout sent. Drawing it this way shows that most payouts skip compliance entirely, and that the one gateway is the only real decision in the process.
A clinic appointment flow
Take a small clinic scheduling same-day visits, illustrative again. A patient's call starts the process. The front-desk lane checks whether a slot is open today, the single gateway in the diagram. If yes, the clinician's lane books the visit and the process ends at appointment confirmed. If no, the front desk offers the next open day and the process ends at appointment rescheduled. Two lanes, one gateway, four activities, nothing else. A new front-desk hire can read it in under a minute.
When to use it
Use BPMN once a process crosses more than one role or one system, and the team already argues about who does what next. It earns its keep on processes that run often enough to be worth mapping once and reusing: onboarding, claims, fulfillment, KYC, not a one-off project plan.
When not to use it
Skip it for a process with one person doing every step; a numbered checklist says the same thing faster. Skip it too for a rough sketch meant for a five-minute conversation, a hand-drawn flowchart works fine and nobody has to learn gateway types first.
Common mistakes
- Modeling every exception in the first draft, so the diagram needs a legend to read; a 2010 survey of BPMN users found most teams use well under half of its 53 defined constructs.
- Drawing a sequence flow arrow across two separate pools instead of a message flow, documented as the most common syntax error in classroom studies of BPMN diagrams.
- Leaving a gateway's branches unlabeled, so a reader has to guess which arrow means yes and which means no from its position on the page.
- Skipping the walk-through with whoever does the work, so a diagram that looks finished on screen turns out to skip a step nobody remembered.
- Reaching for an OR gateway to avoid a hard modeling decision, when an AND or an XOR usually says the same thing with less room for misreading.
FAQ
What does BPMN stand for?
BPMN stands for Business Process Model and Notation, a standard set of shapes, events, activities, gateways, sequence flow, pools and lanes, for drawing how a business process runs. The Object Management Group maintains the standard today; BPMI.org, the group that wrote the first version, released BPMN 1.0 in 2004.
What is the difference between BPMN 1.0 and BPMN 2.0?
BPMN 1.0, released by BPMI.org in 2004 and later adopted by OMG, defined the notation itself, the shapes and what each one means. BPMN 2.0, finalized by OMG in December 2010 and published in January 2011, added a formal execution model, so the same diagram can also drive software, not just document a process for people.
What are the basic shapes in a BPMN diagram?
Four shapes carry most of the meaning: a circle for an event, a rounded rectangle for an activity, a diamond for a gateway, and a solid arrow for sequence flow. Pools and lanes, rectangles that group activities by participant or role, are the other shape most process maps need. The full standard defines far more; most teams never touch them.
Is a BPMN diagram the same as a flowchart?
A BPMN diagram is a flowchart with fixed rules attached. Both use boxes and arrows for steps and decisions, but BPMN gives each shape one standard meaning, adds pools and lanes for who does the work, and uses a separate arrow type for messages between two companies. That standard meaning is what lets a developer build software from the same diagram a manager reads.
How is BPMN different from a RACI matrix?
BPMN draws the order work happens in, task by task, decision by decision. A RACI matrix assigns who does each task once the tasks are already known. Teams often build both for one process: BPMN's lanes show which role performs each step, and RACI settles who is accountable when a step touches more than one lane.
Sources
- Object Management Group, About the Business Process Model And Notation Specification Version 1.0
- Object Management Group, About the Business Process Model And Notation Specification Version 2.0
- Object Management Group, Information technology, Object Management Group Business Process Model and Notation (ISO/IEC 19510 text)
- BPMI.org, Business Process Modeling Notation (BPMN) Version 1.0, May 3, 2004
- Stephen A. White, IBM Corporation, Introduction to BPMN
- Stephen A. White, IBM, BPMN Fundamentals, OMG-BPMI joint meeting, November 2004
- Object Management Group, Business Process Model & Notation (BPMN) landing page
- Object Management Group mailing-list archive, RE: BPMI.org and OMG Announce Strategic Merger of Business Process Management Activities, June 2005
- Jan Recker, Marta Indulska, Michael Rosemann, Peter Green, How Good is BPMN Really? Insights from Theory and Practice, 14th European Conference on Information Systems, 2006
- Jan Recker, Opportunities and Constraints: The Current Struggle with BPMN, Business Process Management Journal 16(1), 2010
- Jan Recker, Michael zur Muehlen, Keng Siau, John Erickson, Marta Indulska, Measuring Method Complexity: UML versus BPMN, 15th Americas Conference on Information Systems, 2009
- Jan Mendling, Hajo A. Reijers, Wil M.P. van der Aalst, Seven Process Modeling Guidelines (7PMG), Information and Software Technology 52(2), 2010
- Hajo A. Reijers, Jan Mendling, A Study into the Factors that Influence the Understandability of Business Process Models, IEEE Transactions on Systems, Man, and Cybernetics - Part A
- Kathrin Figl, Comprehension of Procedural Visual Business Process Models: A Literature Review, Business & Information Systems Engineering 59(1), 2017
- Tomislav Rozman, Gregor Polancic, Romana Vajde Horvat, Analysis of Most Common Process Modelling Mistakes in BPMN Process Models, EuroSPI 2007 Industrial Proceedings
- Jill H. Larkin, Herbert A. Simon, Why a Diagram is (Sometimes) Worth Ten Thousand Words, Cognitive Science 11, 1987
- David A. Garvin, The Processes of Organization and Management, MIT Sloan Management Review, 1998
- Robert D. Landel, Andrew Snyder, Business Process Mapping, Darden Business Publishing, distributed via Harvard Business Publishing, 2010
- Bain & Company, Management Tools: Business Process Reengineering
- Natalia Iglesias, Jose M. Juarez, Manuel Campos, Business Process Model and Notation and openEHR Task Planning for Clinical Pathway Standards in Infections: Critical Analysis, Journal of Medical Internet Research 24(9), 2022
Last updated Sep 25, 2026


Fractional COO or embedded operations team? How to choose at Series A
The two models solve different problems. Here is how to tell which one your company has, and what each costs you in time and control.

What a revenue operations manager actually owns
Pipeline definitions, CRM hygiene, forecasting and the handoffs between marketing, sales and success. What the role covers, and how it differs from sales ops.

What is a fractional executive? Models, pricing and failure points
Fractional, interim, advisory or embedded team: four different models get lumped under one word. Here is how they differ and when each one fails.