Ansoff matrix
The Ansoff matrix sorts a company's growth options into four strategies, market penetration, market development, product development and diversification, by whether the product and the market are already known or new.
The Ansoff matrix is a two-by-two grid that sorts a company's growth options by whether its product and its market are already known or new: market penetration, market development, product development and diversification. H. Igor Ansoff introduced the four strategies in a 1957 Harvard Business Review article and set out the full grid in his 1965 book Corporate Strategy.
- Origin
- H. Igor Ansoff, 1957; expanded 1965
- Level
- 201 · Tool
- Fits
- Startup, Small and mid-size, Scale-up
- Time to apply
- half a day to place today's growth options on the grid, longer to build the case for a diversification move
- What you need
- a precise list of the products or services the company sells today · a precise list of the markets, segments or geographies it already serves
The Ansoff matrix is a two-by-two grid that sorts a company’s growth options into four strategies by one test applied twice: is the product already known, and is the market already known. H. Igor Ansoff, a mathematician turned strategist who later became known as the father of strategic management, introduced the four strategies in a 1957 Harvard Business Review article, “Strategies for Diversification,” and set out the grid in full in his 1965 book Corporate Strategy. The question it answers is narrow on purpose: how far a growth idea asks the company to move from what it already knows how to do.
The two axes, and where each strategy sits
Products run along the horizontal axis, existing on the left and new on the right. Markets run along the vertical axis, existing at the top and new at the bottom. Four strategies sit at the four corners: Market Penetration where both are existing, Product Development where the market is existing but the product is new, Market Development where the product is existing but the market is new, and Diversification where both are new.
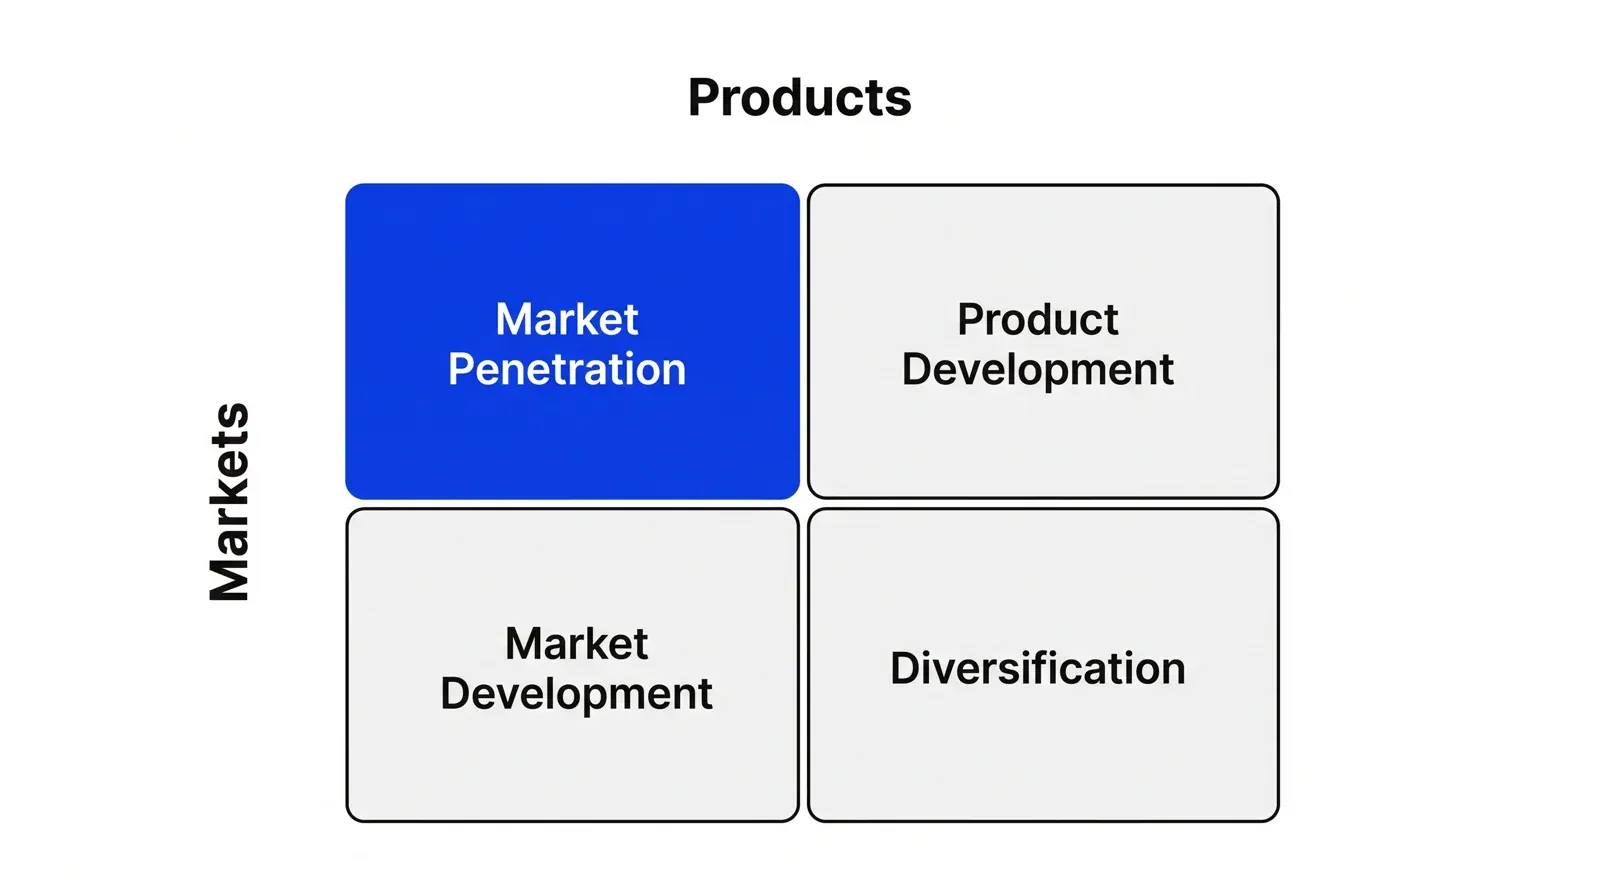
Market penetration means selling more of an existing product to an existing market: a bigger share of wallet from current customers, a price change, a sharper sales motion. It is the cheapest strategy to test because the company already knows the product, the buyer and the channel. That is also why it comes first in practice: it is the fastest way to find out whether growth is available at all before spending on something less familiar.
Two different kinds of unfamiliar
Market development and product development both introduce exactly one unknown, but not the same one, and the research on each points in different directions.
Market development takes an existing product into a new market: a new country, a new customer segment, a new channel. Jan Johanson and Jan-Erik Vahlne’s 1977 study of Swedish manufacturers found that companies expand in stages, usually starting in markets that feel psychically close, similar language, similar business practices, similar regulation, before moving further out. The pattern exists because distance in market development is measured in the company’s working knowledge of how buyers and regulators behave, more than in kilometres.
Product development builds a new product for an existing market. It is often assumed to be the riskiest kind of unfamiliar, on the strength of an old claim that roughly 80% of new products fail. Gary Castellion and Stephen Markham’s 2013 review of nineteen empirical studies of new product launches found that claim overstated: real failure rates cluster closer to 40%, reaching about 49% in consumer goods. Product development is riskier than penetration, just not as catastrophic as the folklore suggests.
Diversification: the documented risk
Diversification moves both variables at once, and the evidence that this is the hardest of the four strategies is old and consistent. Ralph Biggadike documented the pattern in a 1979 Harvard Business Review piece, “The Risky Business of Diversification,” tracing how companies from GE to Gillette to John Deere pushed into product markets they had never competed in before. Chris Zook and James Allen’s 2003 study of growth into adjacent markets, drawing on Bain research, put a number on it: “three-quarters of the time, the effort fails.”
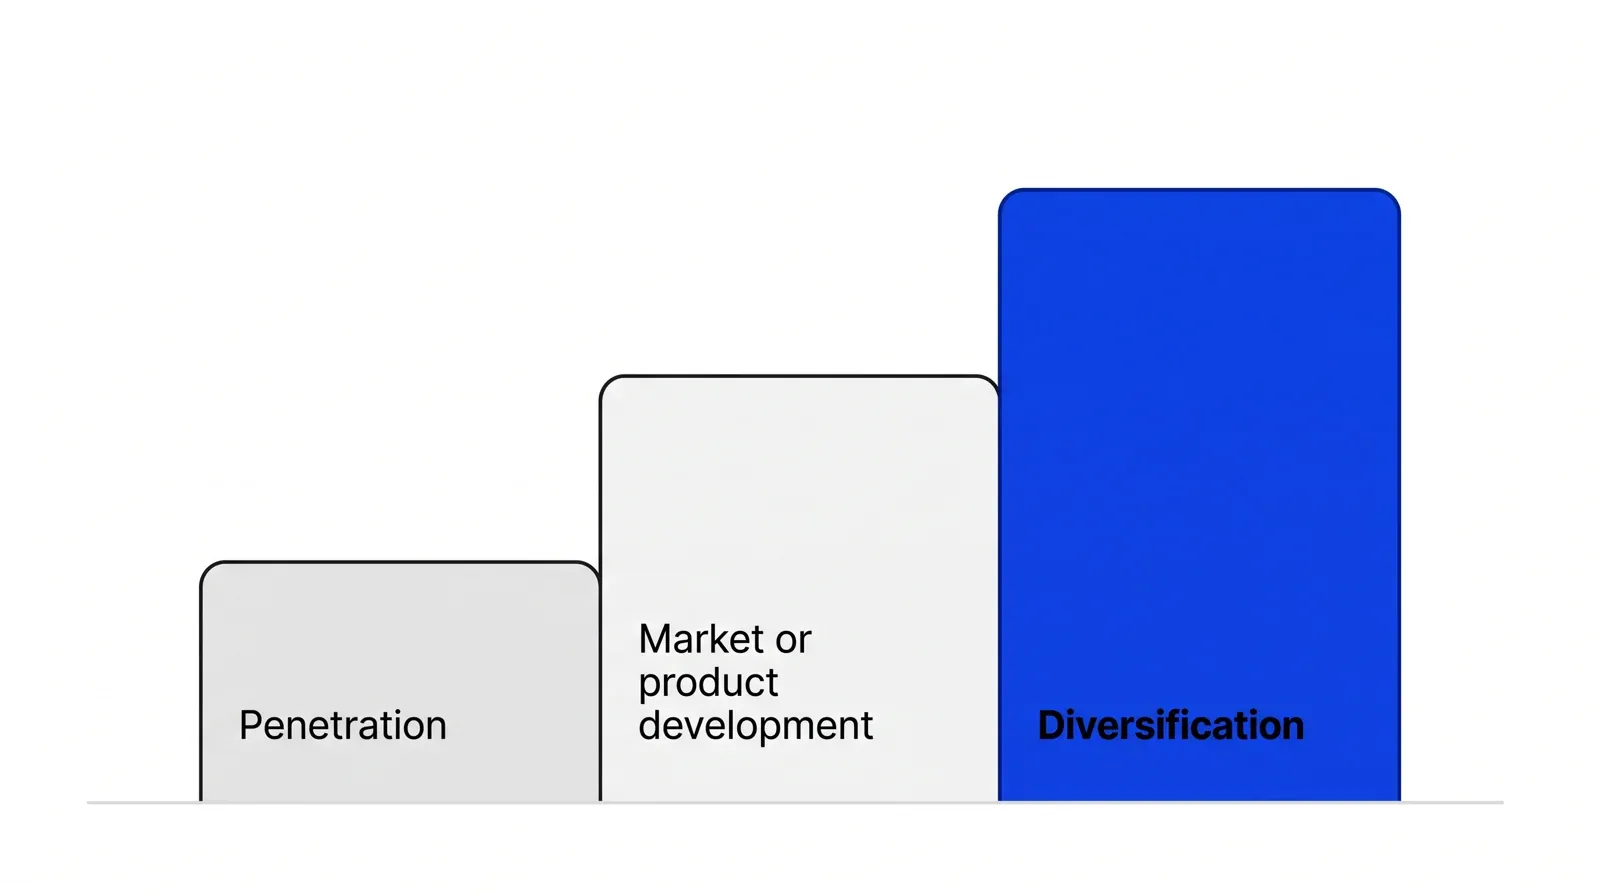
The risk shows up in company valuations too. Philip Berger and Eli Ofek’s 1995 study of diversified US firms found an average 13% to 15% value loss compared to a portfolio of equivalent standalone businesses, a gap researchers call the diversification discount.
Does relatedness explain why some diversification pays off?
Richard Rumelt’s 1974 study, later confirmed in his 1982 Strategic Management Journal paper, found that among diversified firms, the ones that grew into businesses built on a shared core skill or resource outperformed the ones that grew into businesses with no such link. Richard Bettis’s 1981 study tied that gap to concrete differences: related diversifiers tended to spend more on advertising and R&D relative to their unrelated peers, spending the matrix itself says nothing about. Berger and Ofek’s own data backs the same pattern from the finance side, the value loss they measured shrank when a diversified firm’s business segments shared an industry classification, evidence of relatedness rather than a scattershot portfolio.
None of this means diversification is a mistake by default. Cynthia Montgomery’s 1994 review of the question found little support for the idea that companies diversify mainly to build market power, and more support for reasons tied to a surplus of skills or capacity looking for a use. Graham Kenny’s 2024 Harvard Business Review piece pushes back directly on the “stick to your knitting” advice, arguing diversification can work when a company follows a clear discipline rather than treating the move as a hedge against a slowing core business.
Where the matrix gets criticized
The matrix belongs to a school of strategy that assumes a company can lay out its options, score them and choose, before it acts. Henry Mintzberg challenged that assumption directly in a 1990 Strategic Management Journal paper, arguing that strategy more often emerges through learning and adjustment than through analysis performed in advance. Ansoff replied in the same journal in 1991, defending formal planning and arguing Mintzberg’s own descriptive claims did not hold up against how strategic management was practiced. Neither side won the argument outright, and the exchange is worth knowing before treating a filled-in grid as a finished decision: the matrix sorts options and leaves open whether the company can execute the one it picks.
Ansoff matrix against the BCG growth-share matrix
Both are two-by-two grids from the same era of strategy, and teams sometimes reach for one when they mean the other.
| Ansoff matrix | BCG growth-share matrix | |
|---|---|---|
| Question | Which direction should the company grow in | Where should cash go across businesses it already runs |
| Axes | Product familiarity, market familiarity | Market growth rate, relative market share |
| Unit of analysis | A growth option, before it exists | A business unit that already earns its own revenue |
| Output | A choice of penetration, development or diversification | A Star, Cash Cow, Question Mark or Dog |
Use this matrix to choose a direction before a business exists in its new form, and the BCG growth-share matrix once several businesses already exist and the question shifts to funding. Whichever direction a company picks, Porter’s five forces is the separate check on whether the market at the other end is worth entering at all.
Score today’s growth options against the matrix before committing next quarter’s budget, the kind of decision Pushers’ Growth Lab work is built around, and the four boxes stop being a slide from 1957 and start being the reason one option gets funded over another.
How to apply Ansoff matrix, step by step
- List what you already sell, and to whom. Write down today's products and today's markets precisely enough that everyone agrees what counts as existing and what counts as new. A vague list turns every later box into a guess.
- Score each growth option against the two axes. For every option on the table, ask whether the product is existing or new, and whether the market is existing or new. The two answers place it in one of four boxes.
- Start with market penetration. Check first whether the option in front of you is really market penetration, selling more of what you already sell to the customers you already have, before reaching for a new product or a new market. It is the cheapest test of whether growth is available at all.
- Weigh market development and product development against each other. Both carry real but different risk: a new market tests distribution, regulation and buyer trust; a new product tests build cost and adoption. Compare the two against what the company is actually good at, not which one sounds more exciting.
- Treat diversification as its own decision. A move into a new product and a new market at once needs its own business case, its own budget and its own kill criteria, not a line item inside next quarter's growth plan.
- Set a decision date and a stop-loss. Before committing budget, agree what result by what date keeps the option alive, and what result kills it. Growth options without a stop-loss keep drawing budget long after the evidence has turned.
Examples
A cross-border payments fintech
Illustrative. Offering the same transfer product to senders in a new country is market development: the product stays the same and only the market changes. Building a new lending product for that same existing customer base is product development, the market stays the same and only the product changes. Launching a new lending product in a country the company has never operated in moves both axes at once, diversification.
A multi-clinic group
Illustrative. Opening a clinic in a new city with the same services and the same brand is market development. Adding a diagnostic imaging service inside the existing clinics, same patients, same buildings, is product development. Opening a new service in a city the group has never operated in combines both moves, diversification, and carries the risk of both at once.
When to use it
Use it when a leadership team is choosing where to point next year's growth effort and needs a fast, shared way to compare a handful of concrete options before any one of them gets a full business case.
When not to use it
Skip it once the team has already agreed on a direction and needs to plan execution, budgets, hiring or a go-to-market motion; the matrix sorts options, it does not replace the plan for the one that gets picked. It also says nothing about whether the target market itself is attractive, a separate question about industry structure.
Common mistakes
- Calling a move market development when it is really diversification, because the market looks only slightly new and the added risk gets waved away.
- Skipping market penetration and reaching straight for a new product or a new market, when the cheapest growth was already sitting in the existing customer base.
- Running a diversification bet through the same budget and review cadence as a market-penetration bet, instead of giving it its own case and its own stop-loss.
- Treating the matrix as proof a direction will work, when it only sorts options by what is already known, not by whether the market or the product idea is any good.
- Scoring a quadrant once and never revisiting it, when a market that was new last year is existing knowledge now and deserves a cheaper, faster push.
FAQ
What is the Ansoff matrix?
The Ansoff matrix is a two-by-two grid that sorts a company's growth options into four strategies, market penetration, market development, product development and diversification, based on whether the product and the market are already known or new. H. Igor Ansoff introduced it in a 1957 Harvard Business Review article and expanded it in his 1965 book Corporate Strategy.
What are the four strategies in the Ansoff matrix?
Market penetration sells more of an existing product to an existing market. Market development takes an existing product into a new market. Product development builds a new product for an existing market. Diversification launches a new product into a new market, the riskiest of the four because nothing on either axis is already known.
Why is diversification the riskiest Ansoff strategy?
It changes both variables at once, the product is unproven and the market is unfamiliar, so a company loses the advantage of prior experience on either side. Research since Richard Rumelt's 1974 study has repeatedly found that related diversification, staying close to a company's existing skills, outperforms unrelated diversification.
Is market development or product development riskier?
Neither is consistently riskier than the other; they carry different kinds of risk. Market development risks distribution, regulation and buyer trust in an unfamiliar market. Product development risks build cost and adoption for an unfamiliar product. Which one to pick depends on which risk the company is better equipped to manage.
Does diversification always destroy value?
No. Diversified firms have traded at an average discount to focused firms in several studies, but the discount shrinks sharply when the new business is related to the core one, and some research finds firm-specific reasons for diversifying explain much of the gap. The matrix flags the risk; it does not settle whether one specific move will pay off.
Sources
- H. Igor Ansoff, Strategies for Diversification, Harvard Business Review, September-October 1957
- H. Igor Ansoff, Corporate Strategy: An Analytic Approach to Business Policy for Growth and Expansion, McGraw-Hill, 1965, Open Library record
- Richard P. Rumelt, Strategy, Structure, and Economic Performance, Harvard Business School, 1974 (rev. ed. 1986), Internet Archive record
- Richard P. Rumelt, Diversification Strategy and Profitability, Strategic Management Journal 3(4), 1982
- Cynthia A. Montgomery, Corporate Diversification, Journal of Economic Perspectives 8(3), 1994
- Philip G. Berger, Eli Ofek, Diversification's Effect on Firm Value, Journal of Financial Economics 37(1), 1995
- Richard A. Bettis, Performance Differences in Related and Unrelated Diversified Firms, Strategic Management Journal 2(4), 1981
- H. Igor Ansoff, Critique of Henry Mintzberg's 'The Design School', Strategic Management Journal 12(6), 1991
- Henry Mintzberg, The Design School: Reconsidering the Basic Premises of Strategic Management, Strategic Management Journal 11(3), 1990
- Rene M. Puyt et al., The Ansoff Archive: Revisiting Ansoff's Legacy and the Holistic Approach to Strategic Management, Strategic Change 33(1), 2024
- Strategic Change, Igor Ansoff, the Father of Strategic Management, 11(8), 2002
- Thinkers50, H. Igor Ansoff 1918-2002
- Gary Castellion, Stephen K. Markham, Perspective: New Product Failure Rates, Journal of Product Innovation Management 30(5), 2013
- Jan Johanson, Jan-Erik Vahlne, The Internationalization Process of the Firm, Journal of International Business Studies 8(1), 1977
- EBSCO, Ansoff Matrix, Research Starters
- Ralph Biggadike, The Risky Business of Diversification, Harvard Business Review, May 1979
- Chris Zook, James Allen, Growth Outside the Core, Harvard Business Review, December 2003
- Graham Kenny, 4 Rules for Diversifying Your Business, Harvard Business Review, March 2024
- Bain & Company, A History of Bain's Management Tools & Trends Survey
- EBSCO, Market Penetration, Research Starters
Last updated Sep 25, 2026

