Brand positioning map
A brand positioning map, or perceptual map, plots customer ratings of a brand against its competitors on two attributes that matter, so a team can see where the market is crowded and where it might be open.
A brand positioning map, also called a perceptual map, is a chart that plots how customers rate a brand and its competitors on two attributes they use when choosing between them. Marketers build it from survey or interview data and read it for two things: which competitors cluster together, and which parts of the map nobody occupies.
- Origin
- No single inventor; Paul Green, John Hauser and Glen Urban among the researchers credited, 1960s to 1970s
- Level
- 201 · Tool
- Fits
- Small and mid-size, Scale-up
- Time to apply
- A day to collect ratings from customers and plot a first map; longer if you run a new survey from scratch
- What you need
- two attributes customers use when choosing between you and competitors · customer ratings of your brand and each competitor (your own team's opinion does not count) · a way to reach customers (a short survey, interviews, or existing reviews)
A brand positioning map, also called a perceptual map, is a chart that plots how customers rate a brand and its competitors on two attributes, usually drawn as a simple grid with one attribute on each axis. Marketing teams use it to see where competitors cluster, where a brand sits relative to them, and where the map is empty. The ratings behind a perceptual map come from people who buy in the category, gathered through interviews, reviews or a survey.
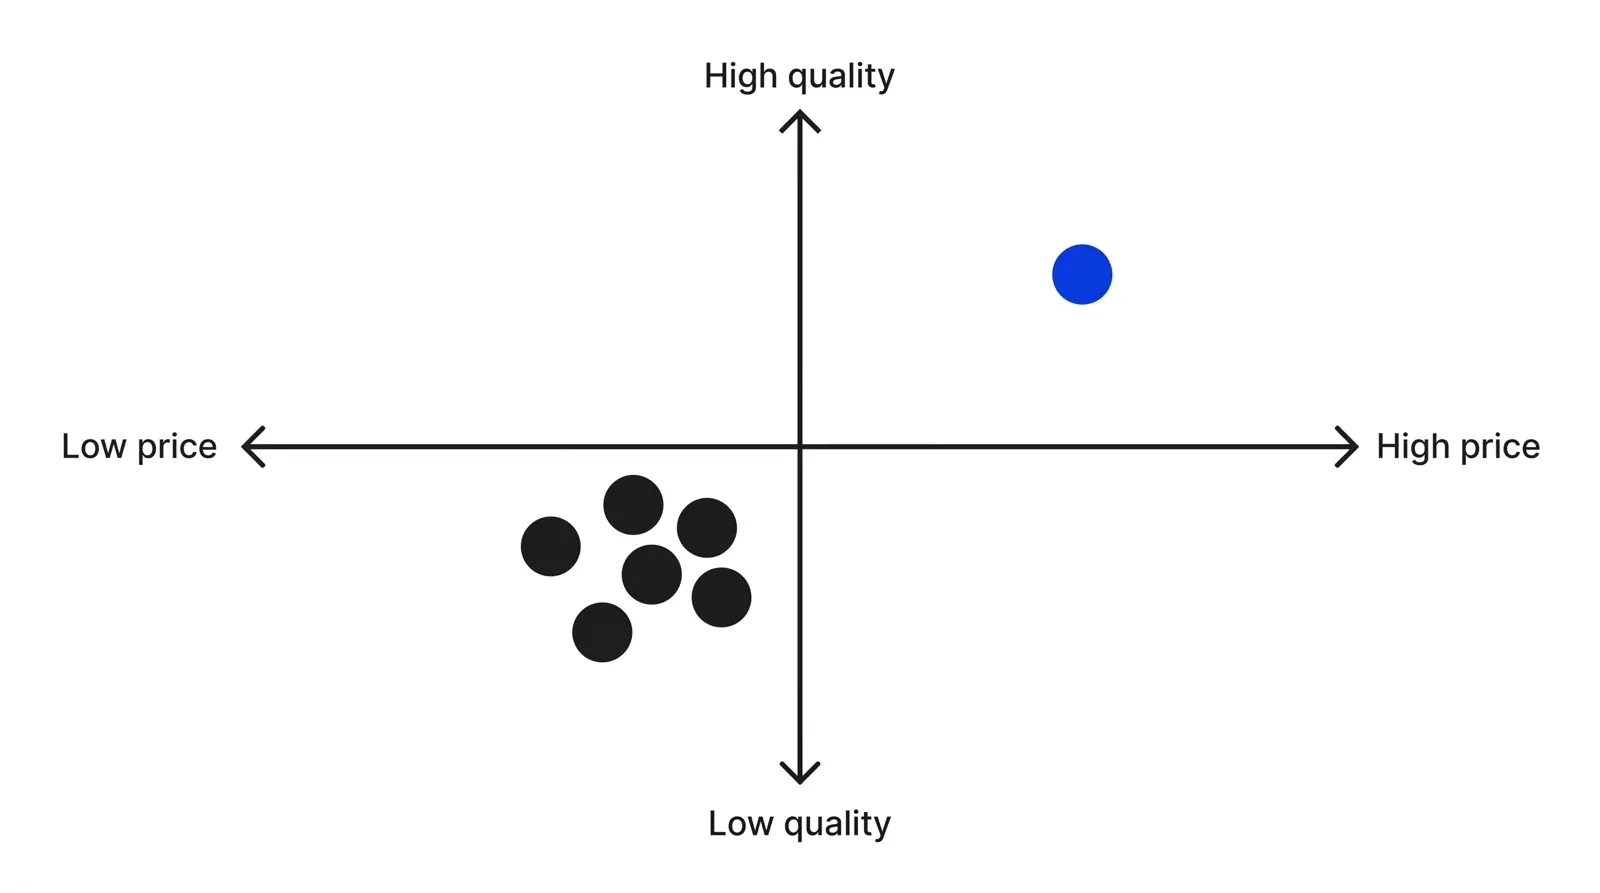
No source names a single inventor. What the record documents instead is a cluster of marketing researchers who adapted multidimensional scaling and factor analysis, both built earlier in psychometrics, to study how customers perceive brands, across the 1960s and 1970s. Paul Green, at the Wharton School, published early applications of multidimensional scaling to marketing problems, including Applied Multidimensional Scaling with Vithala Rao in 1972. John Hauser and Glen Urban, writing in Operations Research in 1977, used factor analysis to identify the perceptual dimensions behind consumer response to new products. Two years later, Hauser and Frank Koppelman ran a direct, empirical comparison of three ways to build a perceptual map (factor analysis, discriminant analysis and similarity scaling) in the Journal of Marketing Research. Their conclusion was specific: factor analysis outperformed the other two on predictive ability, on how easily managers could interpret the result, and on ease of use, a finding later teaching material still points back to when explaining why factor analysis became the default method.
Perceptual map or positioning map
The two terms get used loosely, but they are worth separating. A perceptual map is built from customer data (survey ratings, interview notes or scored reviews) and shows how customers currently see the brands in a category. A positioning map, in the stricter sense several sources use, is drawn from a company’s own plan or opinion, with no customer data behind it. A positioning map answers what a team wants to be true. A perceptual map answers what a sample of customers currently believes.
| Perceptual map | Positioning map | |
|---|---|---|
| Built from | Customer ratings, interviews or reviews | The team’s own plan or opinion |
| Answers | How customers currently see the brands | Where the team wants the brand to sit |
| Weakness | Needs real data collection to build | Can pass off internal opinion as customer evidence |
A few practitioner guides use the two terms interchangeably. Others draw the line above, and the distinction is worth keeping: a chart built from opinion can carry the same confident visual weight as one built from a hundred customer ratings, with none of the evidence behind it.
Why the axes have to be attributes customers use
The two axes only work if they measure attributes customers weigh when choosing between brands, sometimes called determinant attributes, rather than the two things a company is proudest of. A safety feature only belongs on the map if customers weigh safety against the alternatives when deciding. If everyone in the category is already considered safe enough, the safety axis goes flat and stops separating anyone. Attributes come from where customers already talk: interviews, reviews, support tickets, or a short survey question asking what made someone pick one option over another.
Two methods turn that customer input into the ratings behind the axes. In attribute-based mapping, customers score each brand directly on the chosen attributes, and factor analysis condenses those scores into the two axes, the method Hauser and Koppelman found most reliable. In similarity-based mapping, customers only judge how alike pairs of brands feel to them, and multidimensional scaling infers the axes afterward, without asking customers to name what those axes mean. Both methods start from customer judgment gathered outside the building.
Does empty space mean demand?
A blank quadrant draws the eye immediately, and several build-it guides treat that blank space as an automatic opportunity. That reading skips a step. An empty area can mean unmet demand, or it can mean nobody wants what would sit there at a price the business could still profit from. Two checks separate the two cases: the interviews and ratings gathered while building the map should already show whether customers described wanting the combination that empty space represents, and a small follow-up test (a landing page, a handful of interviews, a pricing question) can confirm demand for that specific corner before anyone commits budget to it.
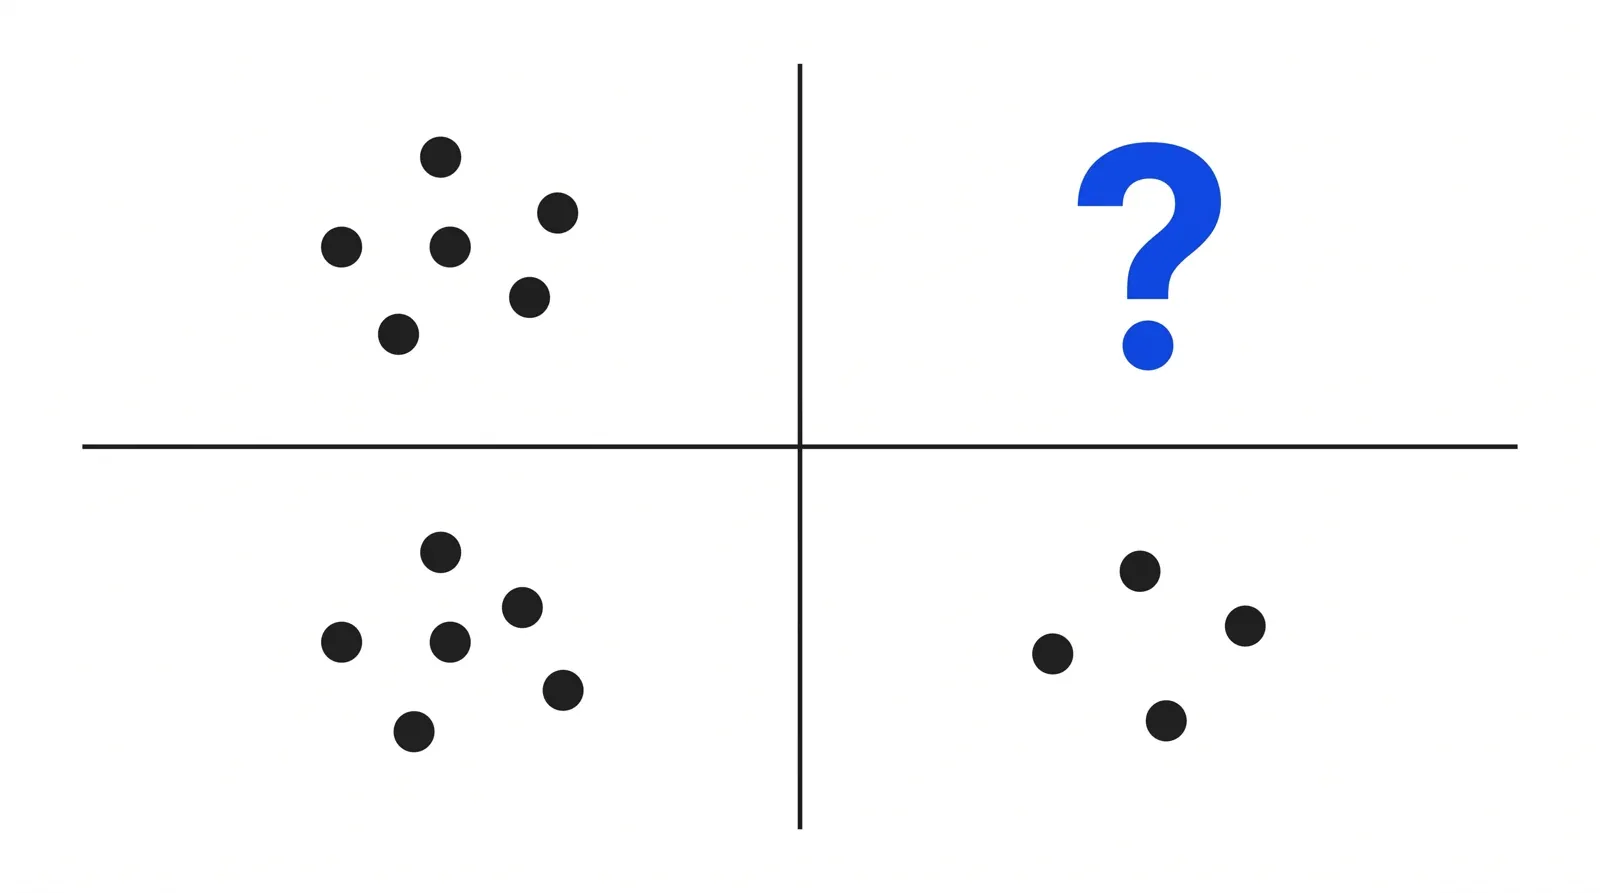
Clusters matter too. A group of competitors sitting on top of each other is often just as informative, since it shows where the category has settled into sameness and stopped competing on that attribute at all.
Joint-space maps add what customers want
A joint-space map extends the same chart with one more layer: where a customer segment’s ideal combination of attributes would sit, alongside where the existing brands sit. That ideal combination is called an ideal point, and a segment’s preference for a real brand depends on how close that brand sits to its ideal point on the map. The Marketing Engineering technical note built on Lilien, Rangaswamy and De Bruyn’s textbook describes joint-space mapping as one of three families of positioning analysis, alongside plain perceptual maps and preference maps, useful specifically when different customer segments want different things from the same category and a single competitor map would blur that apart.
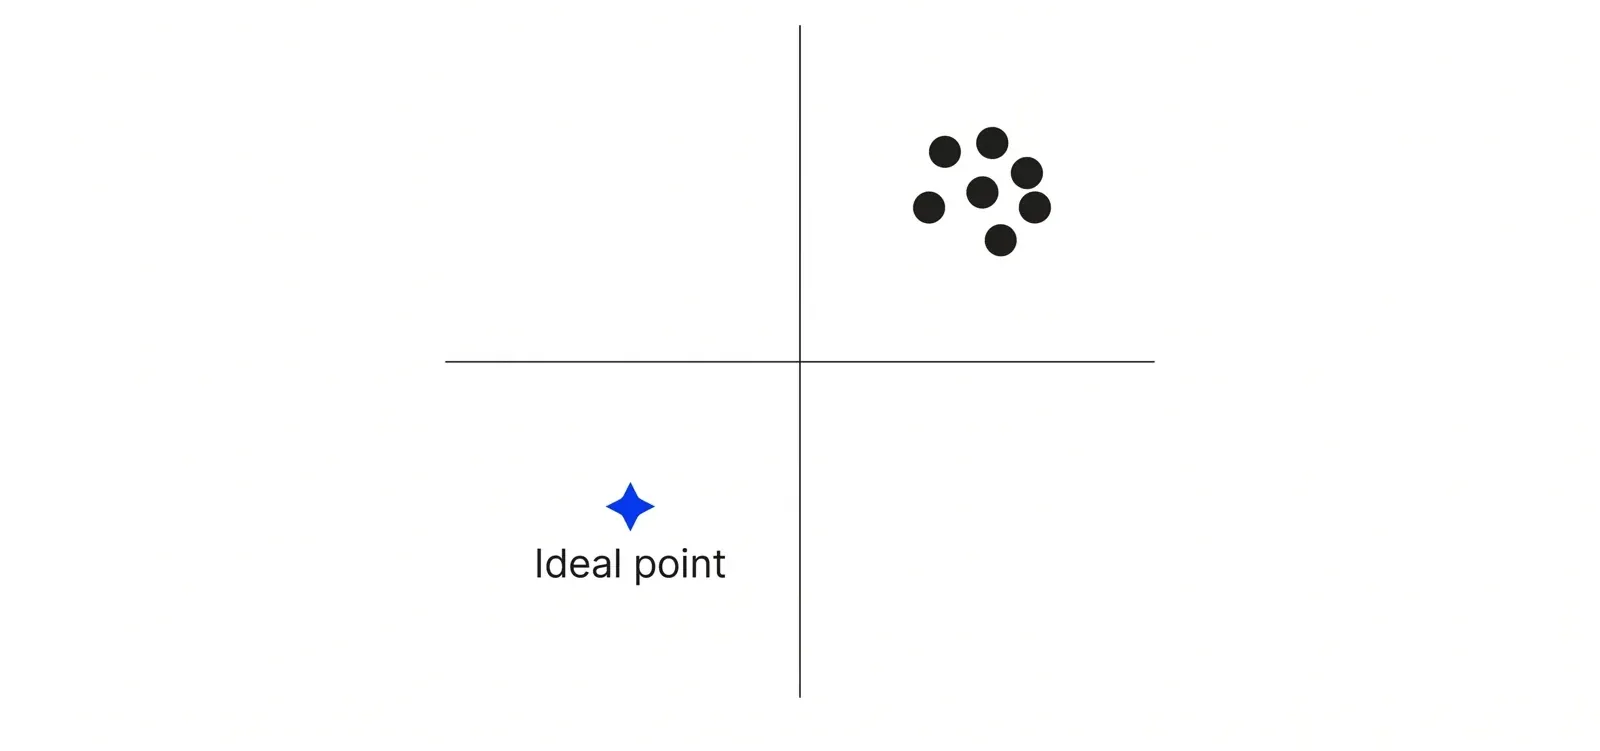
A first pass rarely needs a joint-space map. A plain two-axis map, built from customer ratings and checked before anyone commits to filling a gap, already answers the question that sent them looking for a framework: how customers see the brand relative to the competition. Mapping perception this way fits the customer research Pushers runs as part of growth lab work: a positioning claim is only as strong as the customer evidence collected before it was made.
How to apply Brand positioning map, step by step
- Pick two attributes customers use. Find the two things customers weigh when choosing between you and competitors, rather than the two things your team is proudest of. Pull them from reviews, support tickets, win-loss interviews or a short survey question asking what made someone choose one option over another. The result is two attributes worth testing.
- Rate every competitor from the customer's side. Ask a sample of customers to rate your brand and each competitor on both attributes, or pull ratings from reviews and interviews if a formal survey is not possible. The result is a set of average scores per brand per attribute, built from outside the building rather than from your team's internal view of where things stand.
- Plot the map and read it by area. Draw the two attributes as axes and place every brand, including yours, at its average score. The result is a picture of where brands cluster into a crowded, similar-looking group, and where the map is empty.
- Check whether customers want the empty space. Before treating open space as an opportunity, ask whether customers want what would sit there, using the same interviews or survey you started with. The result is a tested hypothesis about the gap instead of an assumption that blank space equals unmet need.
- Decide whether to move or to defend. Use the map to decide whether the brand should shift toward the open space, defend a crowded position with a sharper claim, or leave the gap alone because nothing supports it. The result is a positioning decision backed by where customers place the brand.
- Re-run it when perception might have shifted. Perception drifts as competitors change their offer or message, so revisit the map on a trigger (a competitor relaunch, a pricing change, a new entrant) rather than on a fixed schedule. The result is a map that still matches what customers think today.
Examples
A cross-border payments app
Illustrative: a remittance app maps itself against competitors on speed and fees, two attributes customers often name when picking a way to send money abroad. Most competitors cluster in the same middle range on both. One corner of the map, high speed paired with low fees, sits empty. Before building toward it, the team checks whether that combination is achievable at the volumes it handles. Some corners stay empty because the unit economics do not support them, and a product nobody can afford to run does not close the gap.
A private clinic network
Illustrative: a group of private clinics maps itself against nearby competitors on price and perceived expertise, drawn from patient reviews and a short intake survey. Most competitors sit in the mid-price range with a reputation for competent, ordinary care. One corner, high price paired with high perceived expertise, holds a single occupant and a visible gap beside it. The network checks whether local patients would pay for that positioning, since a nearby hospital system's existing reputation in that same corner could mean the space is already claimed in practice, just not drawn on anyone's map yet.
When to use it
Use it when setting or revisiting how a brand competes against named rivals: a new entrant is changing the market, a rebrand is on the table, or leadership disagrees about what separates the brand from the next few competitors. It works best in a market with enough competitors to plot, at least four or five, so the clusters and gaps mean something.
When not to use it
Skip it in a market with only one or two competitors, since there is nothing to cluster against and the map collapses into two dots. Skip it too when nobody can reach customers for ratings, since a map built from internal opinion is a positioning map wearing a perceptual map's name, and it will mislead more than it helps.
Common mistakes
- Building the map from the team's own opinion instead of customer ratings, so it shows what the team wants to be true rather than how customers see the brand.
- Choosing attributes the team cares about instead of the ones customers use to decide, which produces a map nobody's buying decision runs on.
- Treating every empty quadrant as an opportunity without checking whether customers want what would sit there.
- Picking two attributes that measure almost the same thing, so the map reads like a straight line instead of two independent dimensions.
- Never updating the map after a competitor repositions or a new entrant arrives, so decisions get made against a picture of the market that no longer exists.
FAQ
What is a brand positioning map?
A brand positioning map, or perceptual map, is a chart that plots how customers rate a brand and its competitors on two attributes they use when choosing between them. Teams build it from surveys, interviews or reviews, then read it for clusters of similar brands and for space nobody occupies.
What is the difference between a perceptual map and a positioning map?
A perceptual map is built from customer data (ratings, interviews or reviews) and shows how customers see the brands. A positioning map is drawn from a company's own plan or opinion, with no customer data behind it, which makes it a hypothesis rather than a finding.
Does empty space on the map always mean a business opportunity?
No. Empty space can mean unmet demand, or it can mean nobody wants what would sit there at a price the business could profit from. Check the gap against customer interviews, willingness to pay or existing search demand before committing budget to fill it.
What attributes should go on a brand positioning map?
Use two attributes customers name when explaining why they picked one brand over another, pulled from interviews, reviews or a short survey. Price and quality are common starting points, but the right pair depends on the category, and two attributes that measure nearly the same thing waste an axis.
What is a joint-space map?
A joint-space map adds a customer segment's ideal point (the combination of attributes that segment prefers most) onto the same chart as the competitor brands. It shows where a specific group of customers wishes a brand sat, next to where brands sit today. It helps when segments want different things from the category.
Sources
- John R. Hauser and Frank S. Koppelman, Alternative Perceptual Mapping Techniques: Relative Accuracy and Usefulness, Journal of Marketing Research 16(4), 1979
- John R. Hauser and Glen L. Urban, A Normative Methodology for Modeling Consumer Response to Innovation, Operations Research 25(4), 1977
- MIT (author copy), Alternative Perceptual Mapping Techniques: Relative Accuracy and Usefulness
- IDEAS/RePEc, MIT Sloan working paper record, A normative methodology for modeling consumer response to innovation
- Paul E. Green and Vithala R. Rao, Applied Multidimensional Scaling: A Comparison of Approaches and Algorithms, Holt, Rinehart and Winston, 1972, archive.org catalog record
- Gary L. Lilien, Arvind Rangaswamy and Arnaud De Bruyn, Positioning Analysis: Marketing Engineering Technical Note
- Wharton Magazine, The Father of Conjoint Analysis: Paul Green, Professor
- Harvard Business School Online, How to Use Perceptual Mapping to Assess Your Competition
- LogRocket, What is a perceptual map and how to build one
- Product Marketing Alliance, What is a perceptual product positioning map?
- Determ, Everything You Need to Know About a Positioning Map
- QuestionPro, How to Build A Perceptual Map?
- Strategic Management Insight, Perceptual Map Explained
- Analytics Team, What is a Perceptual Map?
- MindTools, Perceptual Mapping
- Umbrex, Visualize Brand Position with Perceptual Mapping
- Dovetail, What Is Perceptual Mapping?
- SurveySparrow, Perceptual Map: Definition, Types, Examples & How to Create One
- Creately, How to Create a Perceptual Map
- Alchemer, How to Create Perceptual Maps from Survey Data
- Formplus, Perceptual Map: What It Is & How to Build It
Last updated Sep 25, 2026


The compliance layer under fintech marketing operations
A fintech marketing agency can build campaigns. It cannot own the compliance review, the KYC drop-off or the multi-market licensing rules that decide whether a lead ever becomes a customer.

Fractional CMO: what you get, and what has to exist underneath
A fractional CMO brings strategy and judgment. Without reporting, CRM hygiene and a named owner per number, the engagement produces a slide deck instead of a system.

The operations layer behind healthcare patient acquisition
Ads and search bring the request in. What happens between the click and the booked, attended visit decides whether the spend paid off.