Funnel analysis
Funnel analysis tracks how many people complete each step of a defined sequence toward one outcome, so a team can see exactly where a process is losing people and which step to fix first.
Funnel analysis is a method for tracking how many people complete each step of a defined sequence toward one outcome, and where they drop off between steps. No single person invented it; tools like Google Analytics, Amplitude and Mixpanel formalized the practice. It reports step-to-step conversion and overall conversion separately, so a team can see exactly where, and how badly, a process is losing people.
- Origin
- Digital analytics practice (no single inventor), 2000s–2010s
- Level
- 201 · Tool
- Fits
- Startup, Small and mid-size, Scale-up
- Time to apply
- Half a day to build a first funnel from data you already track; longer if tracking gaps need fixing first
- What you need
- event tracking already in place for every step, ideally documented in a written tracking plan · one clear final action that counts as the outcome, not just a page view · enough people moving through each step for the percentages to mean something
Funnel analysis is the practice of tracking how many people complete each step of a defined sequence toward one outcome, and how many drop off between each step. A funnel is just an ordered list of steps a person has to pass through, a landing page, a signup form, an identity check, a first purchase, and the analysis is counting who makes it from one step to the next. Nobody owns the method. It grew out of web and product analytics practice through the 2000s and 2010s, and the version most teams use today is whatever their analytics tool builds for them: Google Analytics 4’s funnel exploration, Amplitude’s funnel charts, Mixpanel’s funnels report. The underlying question is the one a sales manager has always asked about a pipeline: where exactly are we losing people, and how many.
“Funnel” as a shape for a buying process predates any analytics software: marketing’s version has its own name and its own page on this site, the AIDA model, and product teams built a parallel version in 2007, when investor Dave McClure presented “Startup Metrics for Pirates,” five stages shortened to AARRR: acquisition, activation, retention, referral, revenue. Both are conceptual models of what a buyer is expected to go through. Funnel analysis checks such a model against what happened, using real events logged by real people.
Step-to-step conversion and overall conversion are different numbers
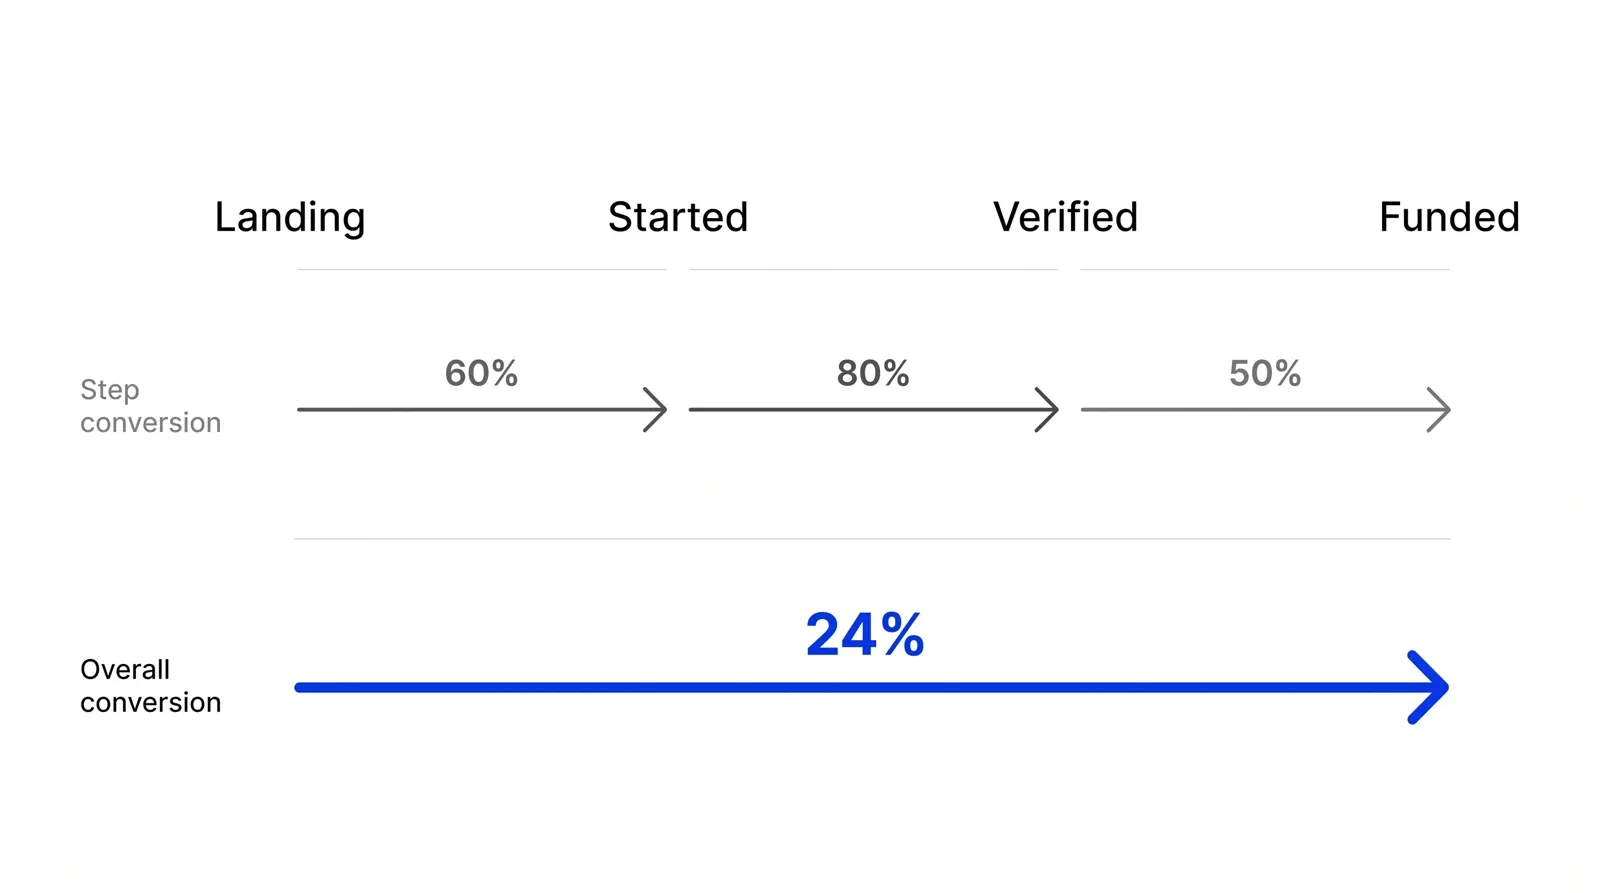
Step-to-step conversion is how many people who reached one step also reached the next one. Overall conversion is how many people who reached the first step also reached the last one, the product of every step-to-step rate multiplied together. Amplitude’s documentation defines total conversion as the users who triggered every event in the funnel divided by the users who triggered the first event, one number for the whole sequence. A funnel with four steps has three step-to-step rates and one overall rate: a healthy overall number can still hide one badly broken step, and a bad step-to-step rate late in the funnel affects a far smaller group than the same rate would earlier on.
Two settings decide how the tool counts people first. Google Analytics 4 asks whether the funnel is open or closed: in a closed funnel, a user has to enter at the first step to count at all; in an open funnel, they can join midway and still be tracked. Mixpanel calls the second setting the conversion window, the maximum time allowed between a user’s first and last step to still count as one completed run. Get either wrong and the counts stop answering the question anyone meant to ask.
A funnel worked through, with the arithmetic checked
Take a payments app’s signup funnel, illustrative, round numbers. 10,000 land on the signup page. 6,000 start the identity check, a 40% drop. 4,800 get verified, a 20% drop. 2,400 fund their first transfer, a 50% drop. Overall conversion, 2,400 divided by 10,000, is 24%.
Sorted by percentage, the step to fix looks obvious: verification-to-funded loses half its people, the worst rate in the funnel. Sorted by how many people are lost, the picture flips. Verification-to-funded costs 2,400 people. Landing-to-started costs 4,000, nearly twice as many, because it’s still working against the full pool of 10,000, not the 4,800 who made it that far. The worse percentage isn’t the step losing the most people, because a step near the end of a funnel is judged against whoever survived to reach it, not against everyone who started.
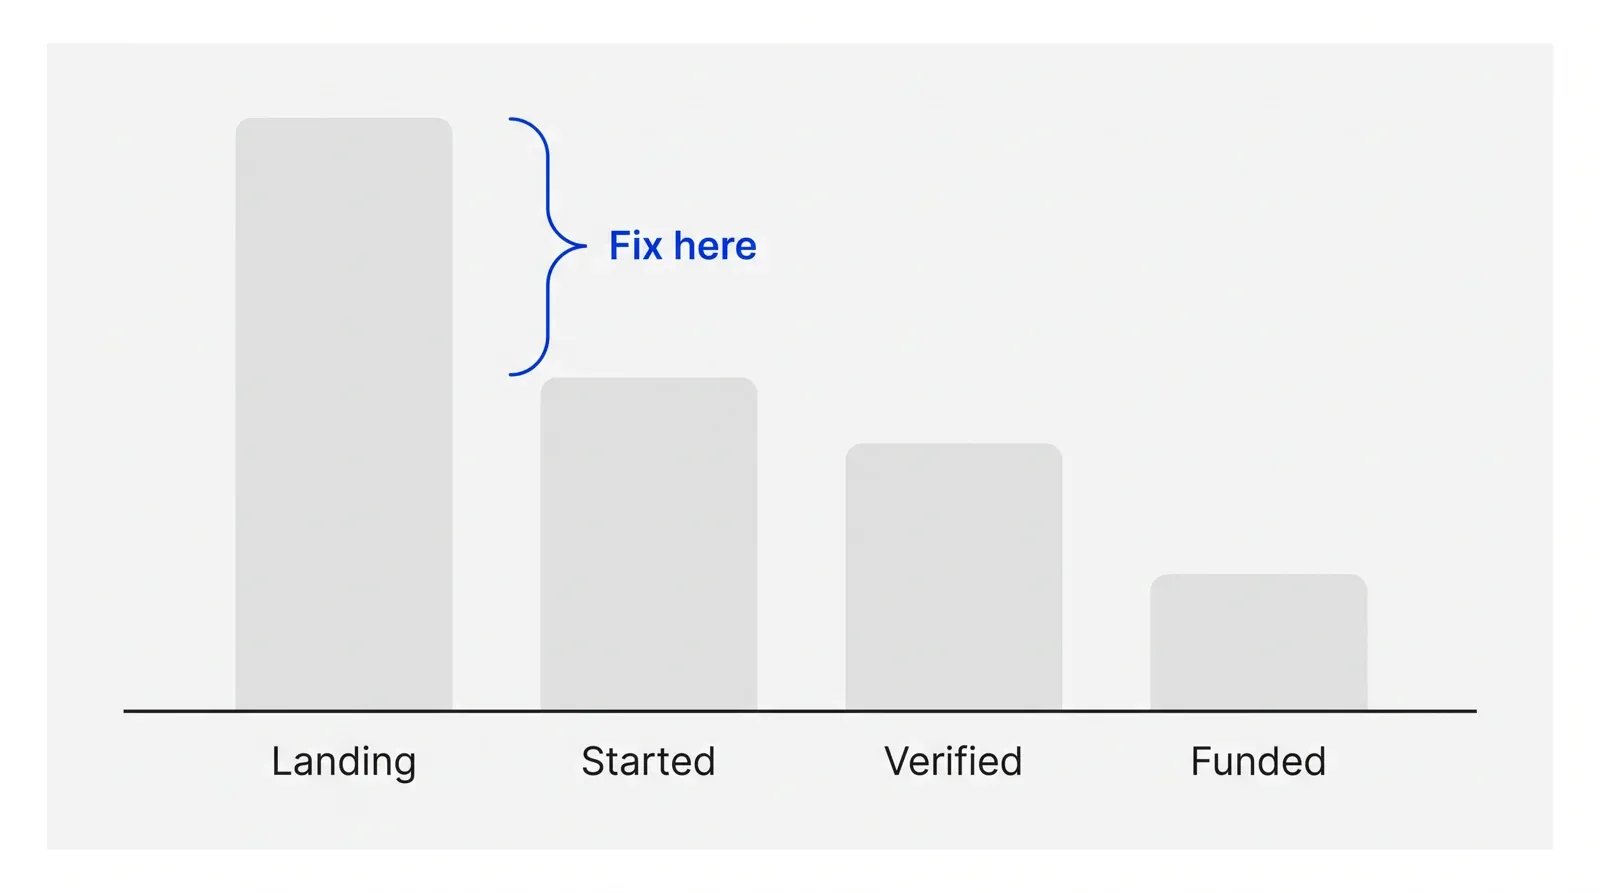
Amplitude’s own funnel documentation makes the same distinction explicit, with a metric called the largest drop-off step, defined by “the absolute decrease, and not the percentage decrease.” That’s the number to check before a team spends a sprint on whichever step looks worst on a percentage chart. A step’s percentage still matters for deciding whether a fix is realistic: a verification step failing half the time because of a compliance rule won’t move the way a confusing signup form will, however many people it costs.
Why the same funnel can look fine in aggregate and broken underneath
Reading one number for the whole funnel hides a well-documented failure: the aggregate can move one way while every real segment inside it moves the other. The classic illustration is a 1973 Berkeley graduate admissions dataset, published in Science in 1975. The university’s overall admission rate looked lower for women than men, a real and troubling gap, until the data was split by department, at which point most departments showed no significant bias, because women had applied in larger numbers to the departments that rejected almost everyone. A 1994 paper in The BMJ shows the same reversal with treatment data: open surgery for kidney stones looked worse overall than a newer keyhole procedure, 78% success against 83%, but split by stone size, open surgery won in both size groups, because surgeons had steered the larger, harder stones toward open surgery in the first place. It’s called Simpson’s paradox, first formally described by Edward Simpson in 1951, though Karl Pearson and Udny Yule had each noted versions of the reversal decades earlier.
A funnel is exactly the kind of aggregate this can hide inside. If the traffic mix changes, more of one channel, more returning users, the overall conversion rate can rise while it falls for every segment, or the reverse. A 2021 study of Covid-19 case fatality rates found this pattern between two countries: the rate was lower in one country for every age group taken separately, yet higher overall, purely because the age mix of confirmed cases differed. The practical fix is the segment Google Analytics 4 builds automatically: split the funnel by channel, device or new versus returning user before trusting the one aggregate line.
Two more ways the numbers mislead on their own
A conversion window matching how people decide matters more than it looks. Too short, and a funnel penalizes a normal, slower decision, a clinic patient who calls back three days later to confirm, as a lost conversion that just took longer. Too long, and it credits an unrelated return visit weeks later as if it belonged to the same journey. Peer-reviewed epidemiology describes a related failure, immortal time bias, misclassifying the tracked time window in a way that inflates or deflates the result; a badly set conversion window makes the same mistake.
The other trap is checking too early. Research on online experiments, including a widely cited Stanford and Optimizely paper on continuous monitoring, shows standard significance tests turn unreliable the moment a team watches results continuously and stops once a number looks good, exactly how “we fixed it” gets declared two days after a change, before the sample is large enough to mean anything.
Funnel analysis versus the marketing funnel
The two get confused because both use the word funnel for stages leading to a sale.
| Funnel analysis | Marketing funnel | |
|---|---|---|
| Measures | Real behavioral events logged by an analytics tool | A conceptual stage model of buyer psychology |
| Data needed | Actual step-by-step counts for a defined group of people | None required; used for planning and messaging |
| Output | Step-to-step and overall conversion percentages | Which stage a campaign or message is aimed at |
| Cadence | Rebuilt and reread continuously as tracking accumulates | Set once per campaign or positioning review |
Use funnel analysis once real steps are tracked. Use a marketing funnel earlier, to decide what a campaign should say before there’s any behavior to measure.
Reading a funnel once is a report. Reading it every week, against the same steps and segments, is what turns it into a system, the kind of regular numbers work built into Pushers’ Marketing-Operational System, where funnel conversion sits next to budgets and sales handoffs instead of getting rediscovered every quarter.
How to apply Funnel analysis, step by step
- Define the outcome and the steps that lead to it. Pick the one action that counts as success, a signup, a booking, a funded account, then list every step a person has to pass through first, in the order they happen, not the order a wireframe assumes.
- Decide open or closed, and set the window. Choose whether a person has to enter at step one to count at all (closed) or can join partway through and still be tracked (open), and set how long they have between the first and last step to still count as a conversion.
- Read step-to-step and overall conversion separately. For each transition, divide the people who reached the next step by the people who reached this one. Multiply every step-to-step rate together, or divide the last step's count by the first step's count, for the one overall conversion rate.
- Rank the drop-offs by people, not percentage. For every step, record how many actual people were lost, not just what percentage that represents. Start with the step losing the most people, then check whether that step's problem is realistically fixable before committing to it.
- Segment before deciding anything. Split the same funnel by channel, device, plan or new versus returning users. A step that looks fine in the aggregate can be quietly broken for one segment while a better-converting segment covers for it.
- Fix one step, then re-run the same funnel. Change one thing, wait past the conversion window before checking results, and compare the same funnel definition against the same baseline period before calling anything fixed.
Examples
A lending app's KYC funnel, split by channel
Illustrative: a lending app's identity-check funnel held a steady 22% overall completion rate for two months, so nobody flagged it. Split by acquisition channel, paid search had fallen from 28% to 19% over the same stretch, masked because referral traffic, which always converted near 40%, had grown from a fifth of volume to a third.
A clinic's online booking funnel
Illustrative: a clinic's booking flow, find a provider, pick a time, enter insurance, confirm, converted at 31% for returning patients and 9% for new patients, a gap invisible in the blended 26% the front desk reported monthly. Most of the new-patient drop-off sat at the insurance step, where the form rejected a policy-number format the clinic's own portal used.
When to use it
Use it once a sequence of steps leads to one outcome that is tracked as real events, a signup, a purchase, a booking, and the team wants to know exactly where people are leaving before deciding what to fix. It works whether the sequence takes seconds, like a checkout, or days, like a KYC review.
When not to use it
Skip it when the steps aren't a real tracked sequence yet, or too few people move through it each week for the counts to mean more than noise. It also isn't a substitute for a marketing funnel or a positioning model; it measures what people did, not what stage of interest they are in.
Common mistakes
- Sorting drop-off by percentage alone, which sends a team to fix a thin, already-filtered step instead of the one losing the most people.
- Setting a conversion window that doesn't match how people decide, penalizing a normal multi-day decision as a lost conversion, or crediting an unrelated return visit weeks later as part of a funnel it never belonged to.
- Reading one aggregate number for the whole funnel and missing that it's improving for most segments and getting worse for one, a mix shift a single overall line can hide completely.
- Declaring a fix successful after a day or two of better numbers, before the sample is large enough or the conversion window has even had time to close.
- Building the funnel once and never rebuilding it after the product changes, so steps get compared against a page order that no longer matches how people move.
FAQ
What is funnel analysis?
Funnel analysis tracks how many people complete each step of a defined sequence toward one outcome, and how many drop off between steps. Analytics tools like Google Analytics 4, Amplitude and Mixpanel calculate step-to-step conversion for each transition and overall conversion for the full sequence, so a team can see exactly where a process is losing people.
What is the difference between step-to-step conversion and overall conversion?
Step-to-step conversion measures how many people who reached one step also reached the next one. Overall conversion measures how many people who reached the first step also reached the last one, the product of every step-to-step rate multiplied together. A funnel can show a healthy overall number while one step-to-step rate is badly broken.
What is the difference between an open funnel and a closed funnel?
In a closed funnel, a person has to enter at the very first step to be counted at all. In an open funnel, a person can join at any step and still be tracked from wherever they entered. Google Analytics 4 supports both; which one to use depends on whether entry point matters to the question being asked.
Why doesn't the biggest percentage drop always show the step to fix first?
A step deep in a funnel is measured against whoever already survived to reach it, a much smaller group than the funnel started with. Its percentage drop can look worse than an earlier step's while costing fewer actual people. Amplitude's own funnel tools separate a step's percentage from its absolute drop-off for exactly this reason.
How does Simpson's paradox affect funnel analysis?
Simpson's paradox is when an aggregate number moves one way while every segment inside it moves the other, usually because the mix of segments shifted. A funnel's overall conversion rate can rise even as it falls for every channel or cohort inside it, unless the funnel gets checked by segment, not only in aggregate.
Sources
- Google, [GA4] Funnel exploration, Analytics Help
- Google, [GA4] Get started with Explorations, Analytics Help
- Google, [GA4] Create a custom funnel report, Analytics Help
- Google, [GA4] Ecommerce exploration solutions, Analytics Help
- Google, [GA4] Apply segments and filters, and view users, Analytics Help
- Amplitude, Interpret your funnel analysis, Amplitude Docs
- Amplitude, How Amplitude computes conversions through funnels, Amplitude Docs
- Amplitude, Discover Funnel Analysis: Find drop-offs and boost conversion rates
- Amplitude, What Is Funnel Drop-Off
- Mixpanel, Funnels: Measure conversions through a series of events, Mixpanel Docs
- Mixpanel, Funnels FAQ, Mixpanel Docs
- Mixpanel, Segment users by their behaviors in Funnels, Mixpanel Docs changelog
- P. J. Bickel, E. A. Hammel, J. W. O'Connell, Sex Bias in Graduate Admissions: Data from Berkeley, Science, 1975, ERIC record
- S. A. Julious, M. A. Mullee, Confounding and Simpson's paradox, The BMJ, 1994
- Judea Pearl, Comment: Understanding Simpson's Paradox, The American Statistician, 2014
- Julius von Kügelgen, Luigi Gresele, Bernhard Schölkopf, Simpson's paradox in Covid-19 case fatality rates: a mediation analysis of age-related causal effects, IEEE Transactions on Artificial Intelligence, 2021
- Samy Suissa, Immortal Time Bias in Pharmacoepidemiology, American Journal of Epidemiology, 2008
- Ramesh Johari, Leo Pekelis, David Walsh, Always Valid Inference: Bringing Sequential Analysis to A/B Testing (published as Peeking at A/B Tests, KDD 2017)
- Ron Kohavi, Diane Tang, Ya Xu, Trustworthy Online Controlled Experiments: A Practical Guide to A/B Testing, Cambridge University Press, 2020
- MIT Sloan Management Review, Avoiding Analytical Myopia
- Forrester, Customer Journey Management In 2026: From Maps To Measurable Impact
- Dave McClure, Startup Metrics for Pirates (AARRR), 2007
- Stanford Graduate School of Business, Developing Growth Initiatives
Last updated Sep 25, 2026

