BCG growth-share matrix
The BCG growth-share matrix sorts a company's products or business units by market growth and relative market share so leaders know which ones to fund, hold, fix or exit.
The BCG growth-share matrix is a two-by-two chart that sorts a company's businesses by market growth rate and relative market share, a business's share divided by its largest competitor's, into four boxes: Stars, Cash Cows, Question Marks and Dogs. Bruce Henderson of the Boston Consulting Group introduced it in 1970 to guide which businesses fund which.
- Origin
- Bruce Henderson, Boston Consulting Group, 1970
- Level
- 201 · Tool
- Fits
- Scale-up, Enterprise
- Time to apply
- half a day to gather growth and share numbers, an hour to plot and discuss them
- What you need
- the annual growth rate of the market each business competes in · each business's market share and its single largest competitor's share in that same market
The BCG growth-share matrix is a two-by-two chart that sorts a company’s products or business units by two numbers, how fast their market is growing and how much of it they hold against their biggest rival, and uses the result to decide where the company’s cash should go next. Bruce Henderson, founder of the Boston Consulting Group, introduced it in a 1970 essay called “The Product Portfolio,” arguing that a company running several businesses should treat them as one portfolio and move cash from the ones that generate more than they need into the ones that need more than they generate.
The two axes, precisely
Two numbers place a business on the grid: market growth rate on the vertical axis, relative market share on the horizontal one.
Market growth rate is the annual growth of the market the business competes in, usually measured in real terms and split into high and low at a cutoff the company sets itself, often close to the growth of the wider economy. Relative market share differs from plain market share: it is the business’s own share divided by the share of its single largest competitor. A business with 30% of a market whose largest rival holds 15% has a relative share of 2.0. A business with 10% against a leader’s 40% has a relative share of 0.25.
BCG’s original chart puts high relative share on the left and low share on the right, the reverse of most business charts, on a logarithmic scale running from roughly 10x down to 0.1x and centered on 1.0, the point where a business ties its biggest rival. Above 1.0 means the business leads its market. Below it means someone else does.
Why share was supposed to mean cash
The matrix rests on one causal claim: a business that has made more of something than any rival should have lower unit costs, and so more cash to reinvest or bank. BCG traced this to a 1966 cost study of a semiconductor manufacturer, later confirmed across other industries: unit costs fell by a fairly consistent 20% to 30%, in real terms, every time a business’s accumulated production doubled. Henderson called it the experience curve. A business with the largest accumulated volume in a market that has stopped growing, the matrix reasons, has walked furthest down that cost curve and should throw off more cash than it needs to defend its position, funding everything else in the portfolio.
The four boxes and what each one is supposed to do
Stars sit in high growth, high share, the top left. They are winning, but growing that fast costs money, so a Star usually needs close to as much cash as it makes. Cash Cows sit in low growth, high share, the bottom left, a business that has already won a market that stopped expanding; it needs little reinvestment and throws off the cash that funds the rest of the portfolio. Question Marks sit in high growth, low share, the top right, an attractive market the business has not yet won; it needs a real cash bet to become a Star, or it drifts into the last box as the market matures. Dogs sit in low growth, low share, the bottom right, and the standard advice is to stop feeding them and harvest or sell what is left.
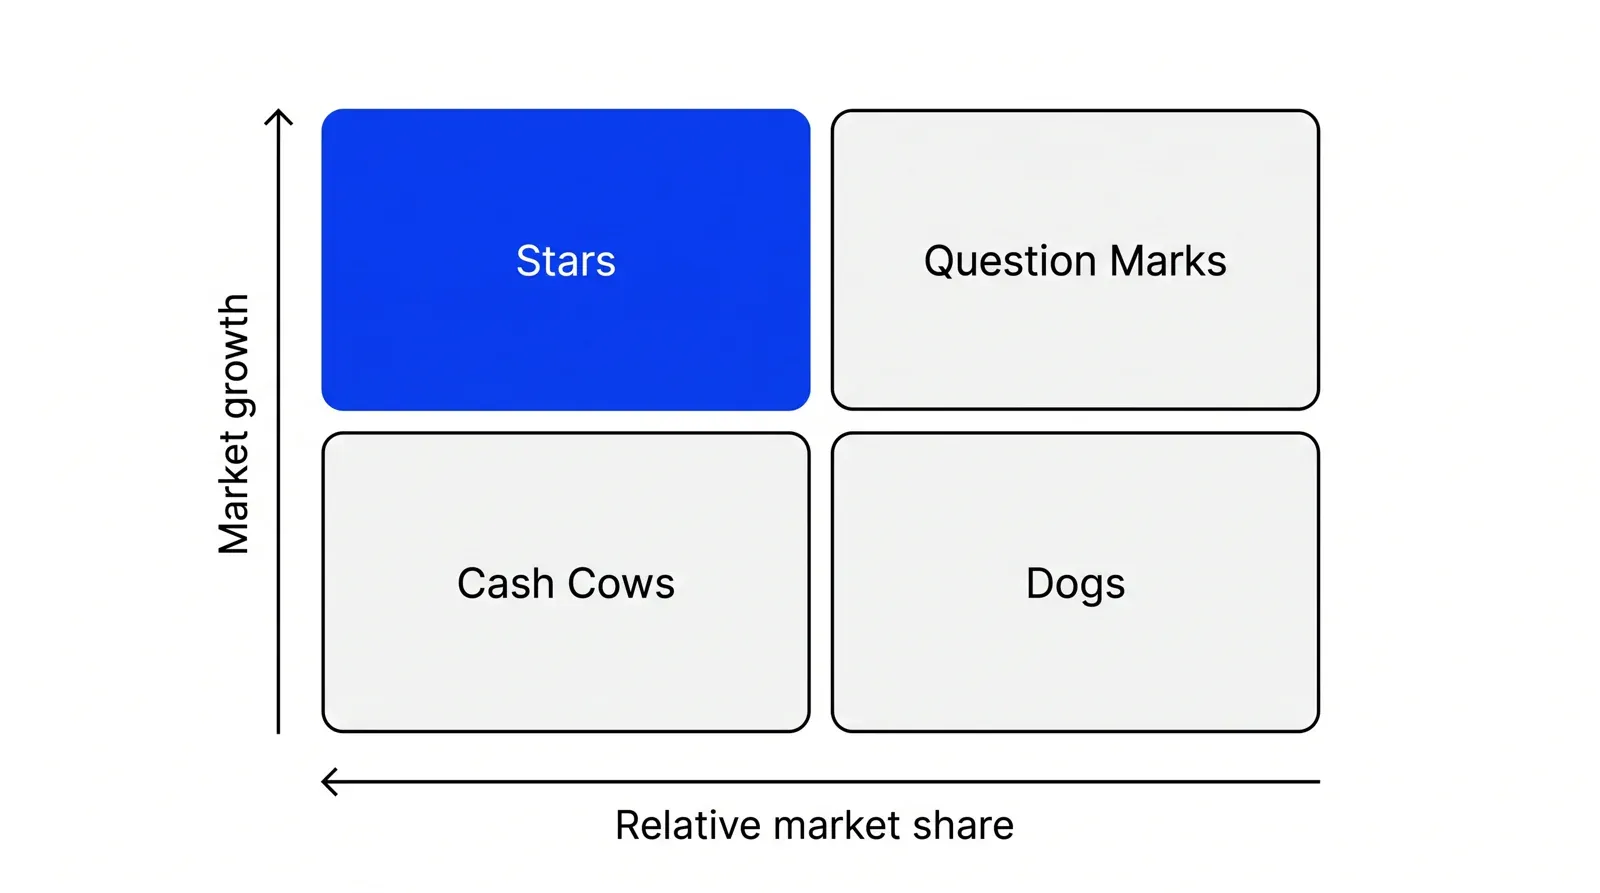
BCG’s own recent materials sometimes soften Dogs to Pets. Dogs is still the name used in Henderson’s era and the one that stuck in the academic literature that followed, so it is the one used here.
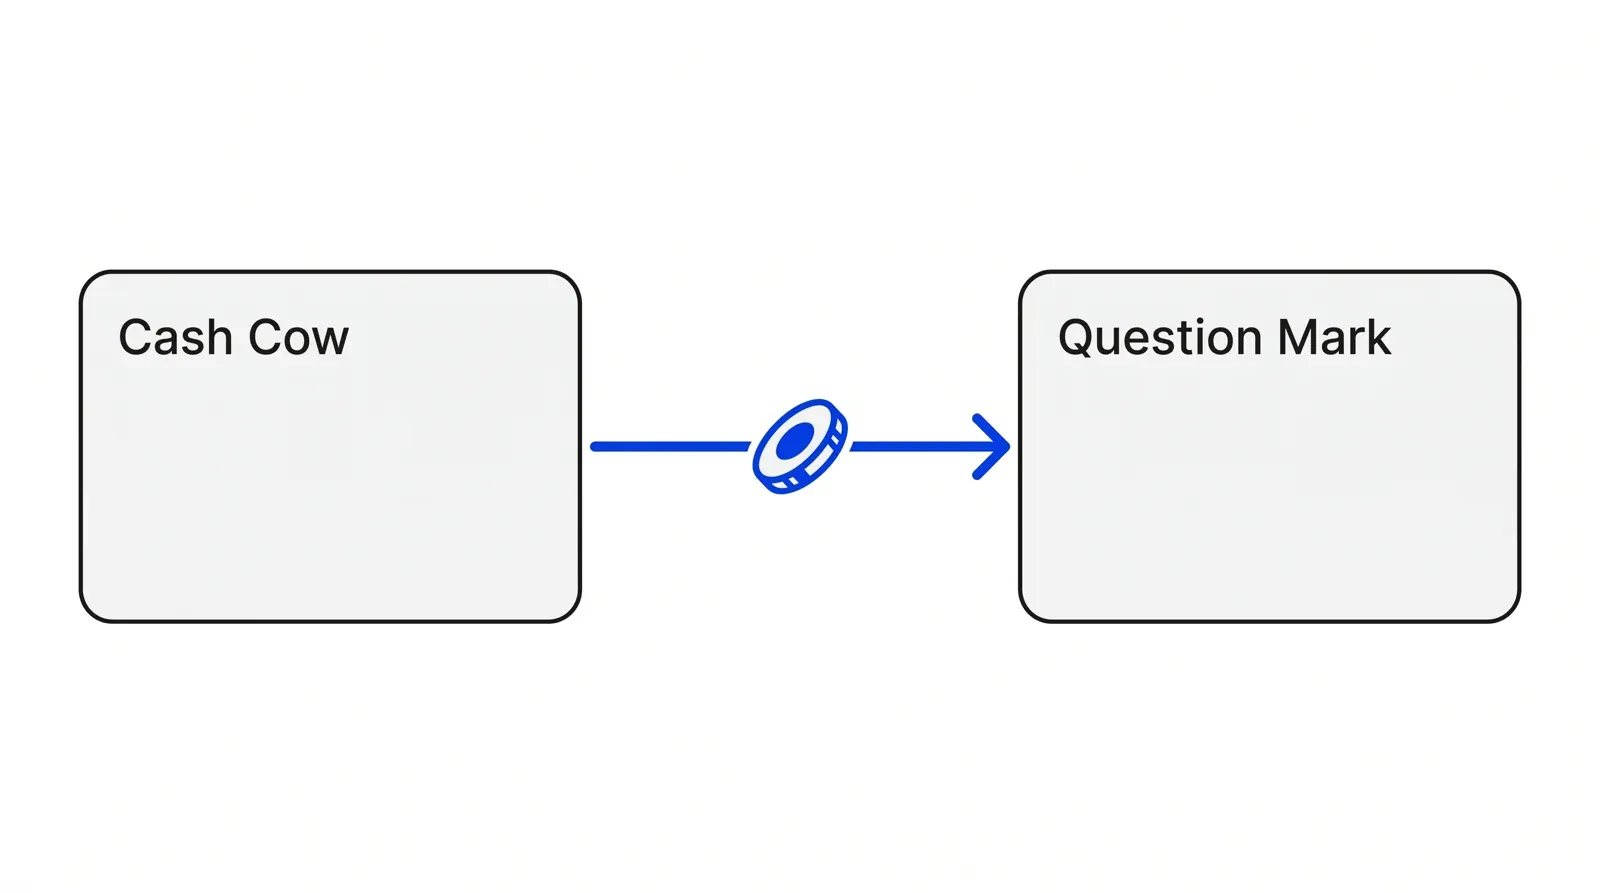
The whole point of naming the boxes is to route cash. A Cash Cow’s surplus is meant to fund the Question Marks worth a bet and keep a Star growing, not to sit inside the business that produced it.
At its peak, BCG’s own account puts the matrix’s use at about half of the Fortune 500. A 1979 survey by INSEAD’s Philippe Haspeslagh found some form of portfolio planning already in use at 35% of the Fortune 1000 and 55% of the Fortune 250.
Where the evidence pushes back
The matrix’s central claim, that high relative share reliably means high profit, has not held up well under direct testing.
The clearest test came from J. Scott Armstrong and Roderick Brodie, who ran the same investment decision past 1,015 subjects across six countries over five years. The correct, profit-maximizing choice was labeled a Dog; the losing choice was labeled a Star. Knowing about the matrix was enough to push 64% of subjects toward the losing Star. Using the matrix in the analysis pushed 87% toward it. The labels, the authors argued, work like the mental accounts behavioral researchers Amos Tversky and Daniel Kahneman described in their own work on framing: a box named Star pulls money toward it independent of the numbers in front of the decision maker.
The assumption that a Dog is worthless has its own counter-evidence. Carolyn Woo and Arnold Cooper studied 126 low-share businesses and found 40 of them outperforming on return on investment, low share and all, exactly the businesses the matrix would tell a company to starve.
Michael Porter’s broader challenge to portfolio-style thinking, in a 1987 Harvard Business Review study of diversification at 33 large companies, put it flatly: “portfolio management is no way to conduct corporate strategy.” Deciding which unit gets cash is not the same work as building an advantage inside it. Henderson himself later added a caveat easy to miss on a chart built entirely around share: in a 1989 Harvard Business Review essay he wrote that “market share is a meaningless number” unless a company has drawn its market’s boundaries correctly first, since the same business can look dominant or tiny depending on how widely that market is defined.
BCG matrix against the GE-McKinsey matrix
Where the BCG matrix reduces a business to two measured numbers, the GE-McKinsey matrix, built by McKinsey for General Electric in the early 1970s to sort a portfolio of more than 150 business units, scores it on two composite judgments assembled from many weighted factors.
| BCG growth-share matrix | GE-McKinsey matrix | |
|---|---|---|
| Axes | Market growth rate, relative market share | Industry attractiveness, business unit strength |
| Built from | Two measured numbers | Many weighted factors per axis |
| Grid | Four boxes | Nine cells |
| Best fit | A straightforward portfolio, a fast first cut | A large, uneven portfolio needing judgment calls |
Use the BCG matrix for speed and a shared vocabulary across a leadership team. Reach for the GE-McKinsey matrix once a portfolio is too mixed, in regulation, technology or competitive intensity, for two measured numbers to sort fairly.
Run this alongside the kind of quarterly capital-allocation discipline covered in Pushers’ Growth Lab work, and the four boxes stop being a slide from 1970 and start being a decision about where next quarter’s cash goes.
How to apply BCG growth-share matrix, step by step
- List the businesses that earn their own cash flow. Include only units with their own revenue and costs. A feature inside one product is not a business; a distinct product, service or clinic location usually is.
- Get each one's market growth rate. Use the growth rate of the market the business actually competes in, not the company's own growth, and set a cutoff, often close to the growth of the wider economy, to call it high or low.
- Calculate relative market share. Divide the business's market share by the share of its single largest competitor in that same market. A result above 1.0 means the business leads; below 1.0 means it follows.
- Plot each business on the grid. Mark growth on the vertical axis and relative share on the horizontal one, high share on the left. Size each dot to the business's revenue so the chart shows where the money already sits.
- Assign a cash role to each quadrant. Cash Cows fund the portfolio, Stars roughly fund themselves, Question Marks get a defined bet and a deadline, Dogs get harvested or sold unless they are quietly profitable on their own.
- Revisit the chart every planning cycle. Positions shift as markets mature and competitors gain or lose share. A business plotted as a Star two years ago may already be a Cash Cow.
Examples
A fintech's product line
Illustrative. A payment-cards business with years of volume and a market that has stopped growing fast is a Cash Cow. A newer cross-border FX product, already the largest in its niche and still growing, is a Star. A consumer-lending product launched last year, in a fast-growing category where two bigger lenders lead, is a Question Mark. A prepaid gift-card line nobody has promoted in years, small share, flat market, is a Dog.
A multi-clinic group
Illustrative, a group running several clinics. General check-ups are the largest service and the market has matured; that is a Cash Cow funding the rest. Cosmetic treatments are growing fast and the group already leads locally, a Star. In-house diagnostic imaging is in a fast-growing category, but one hospital chain still holds most of the local share, a Question Mark. A rarely booked in-house physiotherapy service, flat demand and a small share, is a Dog worth checking for quiet profitability before cutting it.
When to use it
Use it when a company runs several distinct businesses or product lines with clearly different growth rates and competitive positions, and a leadership team needs a fast, visual first cut at where next year's cash should go before a deeper review.
When not to use it
Skip it for a single-product company, where there is nothing to compare a business against, or when the market's boundaries are disputed, since relative share swings with how narrowly or widely the market is defined. It also says nothing about execution risk, regulation or a coming technology shift, the kind of factors the GE-McKinsey matrix was built to add.
Common mistakes
- Using plain market share instead of relative share against the single largest rival, which can put a business that is actually losing to a bigger leader in the wrong box.
- Treating the chart as the whole strategy rather than one input on where cash should go, when funding a unit is not the same as building its competitive advantage.
- Killing every Dog on sight instead of checking whether it is still a profitable, low-maintenance business worth keeping for its cash.
- Defining the market too broadly or too narrowly without saying so, which quietly changes a business's relative share and therefore its box.
- Never re-plotting the chart, so a business that has already matured from a Star into a Cash Cow keeps getting funded like a Star.
FAQ
What is the BCG matrix?
The BCG matrix, or growth-share matrix, is a two-by-two chart that sorts a company's businesses by market growth rate and relative market share into four boxes: Stars, Cash Cows, Question Marks and Dogs. Bruce Henderson of the Boston Consulting Group introduced it in 1970 to guide which businesses in a portfolio fund which.
What are Stars in the BCG matrix?
Stars are businesses with high market growth and high relative market share, the top-left box. They are winning their market, but growing that fast costs money, so a Star usually needs close to as much cash as it generates until its market matures.
What are Dogs in the BCG matrix, and should a company always sell them?
Dogs have low market growth and low relative share, the bottom-right box, and the standard advice is to harvest or exit them. Research by Carolyn Woo and Arnold Cooper found 40 of 126 low-share businesses studied outperformed on return on investment, so a Dog is worth checking for quiet profitability first.
What is a Cash Cow in the BCG matrix?
A Cash Cow has low market growth and high relative market share, the bottom-left box. It has already won a market that has stopped expanding, needs little reinvestment, and throws off the cash that is meant to fund the Stars and Question Marks elsewhere in the portfolio.
How do you calculate relative market share in the BCG matrix?
Divide a business's own market share by the market share of its single largest competitor in that same market. A business with 30% against a rival's 15% has a relative share of 2.0; one with 10% against a rival's 40% has a relative share of 0.25.
Sources
- Bruce Henderson, The Product Portfolio, BCG Perspectives, 1970
- BCG, What Is the Growth Share Matrix?
- BCG, BCG Classics Revisited: The Growth Share Matrix, 2014
- Bruce Henderson, The Experience Curve, BCG Perspectives, 1968
- Bruce Henderson, The Experience Curve Reviewed, Part II: The History, BCG Perspectives, 1973
- BCG, Our History
- BCG, The Growth Share Matrix Revisited, A TED Animation, 2014
- Martin Reeves, How Bruce Henderson Catalyzed the Strategy Revolution, BCG
- BCG, Ten Lessons from 20 Years of Value Creation Insights, 2018
- Carolyn Woo, Arnold Cooper, The Surprising Case for Low Market Share, Harvard Business Review, 1982
- Robert Buzzell, Bradley Gale, Ralph Sultan, Market Share, a Key to Profitability, Harvard Business Review, 1975
- Yoram Wind, Vijay Mahajan, Designing Product and Business Portfolios, Harvard Business Review, 1981
- Michael Porter, From Competitive Advantage to Corporate Strategy, Harvard Business Review, 1987
- J. Scott Armstrong, Roderick Brodie, Effects of Portfolio Planning Methods on Decision Making: Experimental Results, International Journal of Research in Marketing, 1994
- Amos Tversky, Daniel Kahneman, The Framing of Decisions and the Psychology of Choice, Science, 1981
- Pankaj Ghemawat, Competition and Business Strategy in Historical Perspective, Business History Review, 2002
- Philippe Haspeslagh, Portfolio Planning, Use and Usefulness, INSEAD Working Paper 81/19, 1981
- Harvard Division of Continuing Education, 6 Tools Every Business Consultant Should Know
- Janine Ungvarsky, Growth-Share Matrix, EBSCO Research Starters, 2020
- Bruce Henderson, The Origin of Strategy, Harvard Business Review, 1989
Last updated Sep 25, 2026


How to calculate channel payback and unit economics
A CAC number that only marketing believes is not a finance number. Here is how to calculate channel payback so both teams work from the same model.

Fractional CFO vs finance operations: which gap do you actually have
A fractional CFO is a person. Finance operations is a system. Most companies searching for one are missing the other, or both.

Why channel tests stall after month three
Most paid channel tests do not end with a decision. They end when the budget runs out, the attribution model changes, or everyone quietly stops looking at the dashboard.