Aha moment and activation
The aha moment is the point where a new user first sees a product's value, and activation is the share of sign-ups who reach a measurable action that marks it, found from retention data and then tested for cause.
An aha moment is the point where a new user first experiences a product's core value. Activation is the share of sign-ups who reach a defined action that marks it, such as a second order or a first shared chart. Teams find that action by comparing retained and churned users, which shows correlation only, so an experiment must confirm it causes retention.
- Origin
- Practitioner concept from product growth teams; no verified originator, undated
- Level
- 301 · Advanced
- Fits
- Startup, Scale-up
- Time to apply
- One to two weeks for a first analysis, then a few weeks to test it
- What you need
- an event log with a timestamp for every key user action · a retention definition, such as still active 90 days after sign-up · at least a few hundred sign-ups, and a way to split users at random in an experiment
The aha moment is the point where a new user first understands what a product is worth to them. Activation is the number built on it: the share of new sign-ups who complete a chosen action that stands for that moment. Growth and product teams at software companies use the pair to explain why many sign-ups leave in the first days and what onboarding should change. We found no verified originator of the term in product growth, and the stories attached to it are told more often than they are sourced.
What is the difference between the aha moment and activation?
The aha moment is an experience, and activation is its measurable stand-in. Amplitude defines the aha moment as the first time a user understands the product’s core value. You cannot see that in a log, so a team picks an action that shows it happened: a second order, a first shared chart, a first payment. Amplitude’s metrics guide then gives the formula: customers who reach the aha moment, divided by all customers who sign up, times 100.
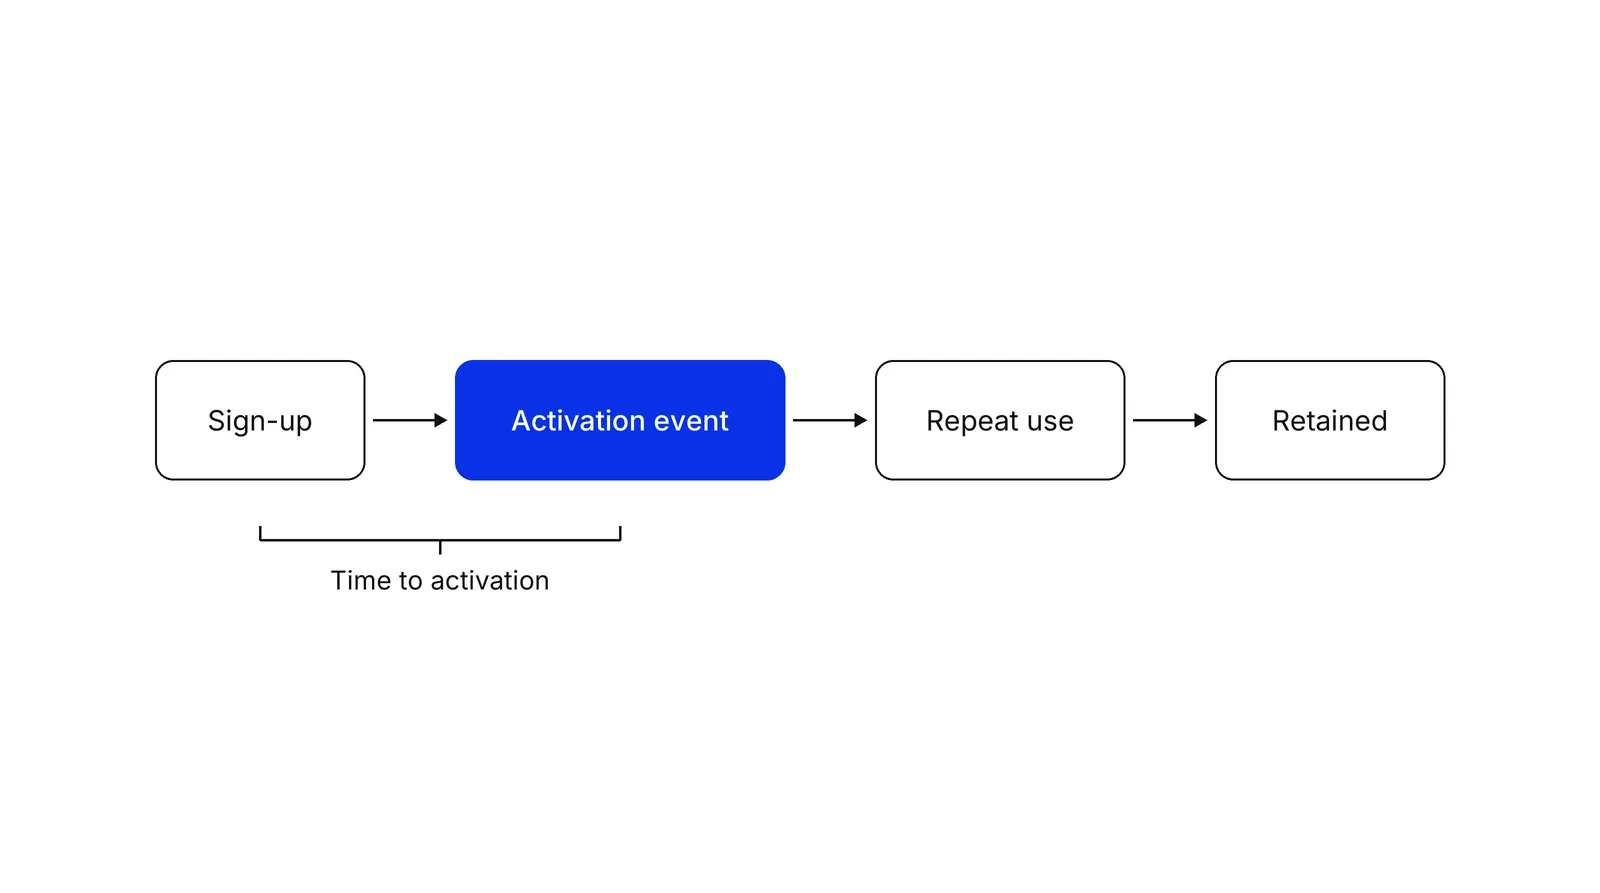
Time to activation is how long users take to get from sign-up to the event. Repeat use, sometimes called the habit moment, is what keeps them. If you track the funnel with AARRR metrics, activation is the “A” that sits between acquisition and retention, and the Hook Model picks up from there by asking how repeat use becomes a habit.
How do teams find the activation event?
They compare people who stayed with people who left and look for an early action the stayers took more often. Lenny Rachitsky and Yuriy Timen describe the milestone as the earliest point in the onboarding flow that shows value and predicts long-term retention, and suggest users who reach it should retain at least twice as well as those who do not.
A second route starts from the product. Casey Winters asks two questions: how often should a user get value, and which action shows they got enough to stay. At Grubhub the answer was a second order within 30 days of the first. At Pinterest it was saving pins, with weekly savers four weeks after sign-up as the measure. Both start from a reason and then check the data, which beats mining the data for any pattern. A cohort analysis is the natural tool for the check.
What do the famous numbers show?
Only one of the three best-known numbers traces to a company person’s own words.
| Claim | Who said it | Source status |
|---|---|---|
| Slack: 2,000 messages | Stewart Butterfield, in a 2015 interview | Primary |
| Twitter: about 30 follows | Authors of Hacking Growth, describing the team | Second-hand |
| Facebook: 7 friends in 10 days | Attributed to Chamath Palihapitiya | Widely repeated, unsourced |
Butterfield told First Round Review that a team with 2,000 messages had really tried Slack and that 93 percent of them were still using it. He said the threshold came from looking at who stuck, and put it in scale: about 10 hours of messages for a 50-person team, about a week for a typical 10-person team. That is a number fitted to past customers. For Twitter, the Hacking Growth excerpt reports about 30 follows, a follow-back from about a third of those accounts, and next-month retention of 90 to 100 percent for users who visited at least seven times in a month, all in the book authors’ voice.
For Facebook we could not find the claim in the places it should be. The 2013 TechCrunch summary of Palihapitiya’s talk does not mention it, and the conference slides we read carry no friend or day count. The story may be true, but nobody has shown us the evidence.
Why is correlation not enough?
Because the people who hit the event may be the people who were going to stay anyway. A motivated user does more in week one and also stays, so event and retention move together without one causing the other.
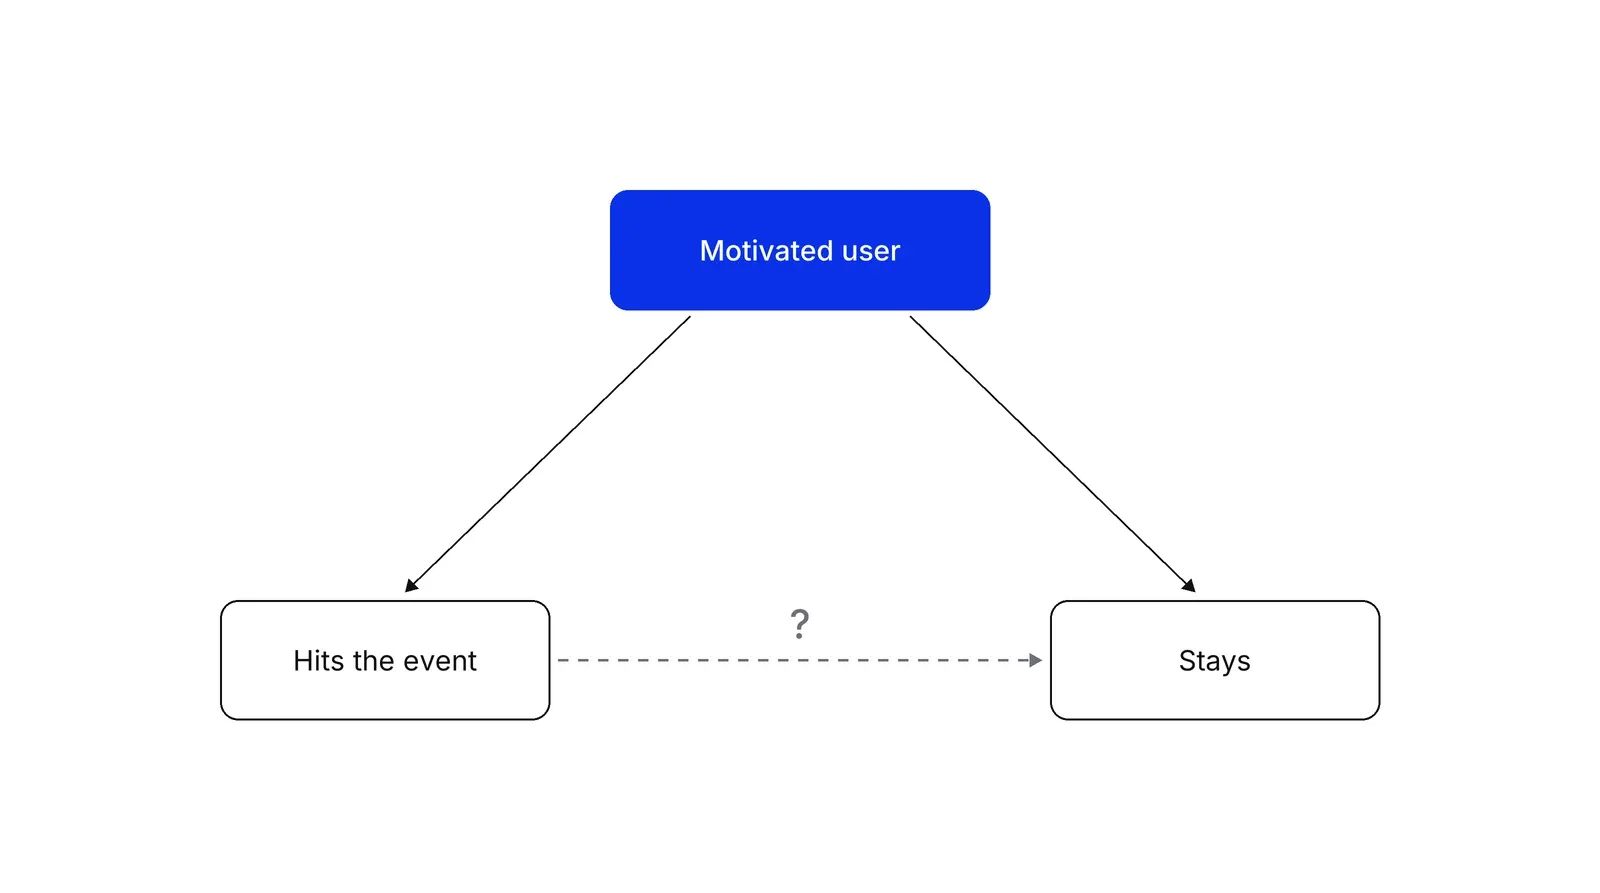
Amplitude’s own 2025 benchmark analysis of over 2,600 companies found that 69 percent of the top day-seven retention performers were also top three-month performers, and the author calls it a correlation, not proof that raising day-seven activation raises retention. Amplitude also warns that studying only users who finished onboarding can make you credit the flow for retention they would have shown anyway. Jorge Mazal, Duolingo’s former chief product officer, said the team’s insight that users with 10-day streaks churned less was likely correlation and selection bias, so they tested it. Statisticians have a name for reversals of this kind: in Simpson’s paradox, an association disappears or flips once you split the data by a third variable.
In Gordon, Zettelmeyer, Chapsky and Bhargava’s 2019 study of 15 Facebook ad experiments, covering about 500 million user observations and 1.6 billion impressions, observational methods often failed to reproduce the randomized result. In a study of peer effects by Eckles and Bakshy, a randomized experiment of about 220 million observations served as the benchmark, and naive observational estimates overstated the effect by 320 percent in the preprint.
Gelman and Loken showed in 2013 that comparisons can multiply even when nobody means to fish, because analysis choices follow the data. Trying many events, counts and windows until one separates stayers from leavers does exactly that. Confirm any threshold on a cohort you did not use to find it.
How do you test cause?
Randomize. Send half of new users through a changed onboarding and compare retention for everyone assigned to each version, not only for those who reached the event. Rachitsky and Timen put it the same way: if experiments that raise the activation metric also lift later retention, the link is causal, and if not, revisit the milestone. Kohavi, Tang and Xu treat randomized experiments as the standard for causality and observational designs as a fallback with lower trust. Our experimentation program page covers running them.
| Question | Correlation analysis | Experiment |
|---|---|---|
| Who is compared | Users who did the event with those who did not | Users assigned at random to two versions |
| What it tells you | Which action marks likely stayers | Whether moving users to the action changes retention |
| Main risk | Motivated users flatter the event | Too few users for a clear result |
How does it connect to other metrics?
Activation sits between sign-up and the metrics you report to the board. Pick an activation event that feeds your North Star Metric, and read it with onboarding stages that give each step an owner and a clock. Retention is also where product-market fit shows up: Superhuman’s Rahul Vohra surveyed only users who had used the product at least twice in two weeks, and watched its “very disappointed” score rise from 22 percent to 58 percent over three quarters of product work. Benchmarks help only with a matching definition. Amplitude’s 2025 report puts median enterprise day-seven retention at 2.1 percent and the top 10 percent at 12.4 percent, and for half of products more than 98 percent of new users were inactive by week two. Lenny’s 2022 survey found a median activation of 25 percent, while Amplitude’s benchmark puts the average day-seven rate at 6.8 percent. A Growth Lab plan starts from the first-use drop-off and a tested activation event (see how we work).
How to apply Aha moment and activation, step by step
- Fix the denominator and the window. Decide who counts as a new user (completed sign-up) and how long they get to reach activation, for example seven days. Write both down. Result: one sentence defining the activation rate before any analysis starts.
- List candidate actions. Collect five to ten actions that could show value, from product data and five interviews with retained users: a second order, a first shared report, a teammate invited. Result: a short list of events, each with a plain-language reason it might matter.
- Compare retained and churned users. For each candidate, compare the share who did it within the window among users who stayed and users who left. Try a few counts and windows, but record every variant you tried. Result: a table of events with the retention gap for each.
- Pick the earliest strong event and test it. Choose the earliest action in the flow whose retention is clearly higher, for instance at least double, as in Lenny Rachitsky's survey guidance. Check it on a second cohort that was not used to find it. Result: one candidate activation event that holds on fresh data.
- Run an experiment. Change onboarding to push more people toward the event, assign users at random, and compare retention for everyone assigned to each version, whether or not they reached the event. Result: a measured retention effect that confirms or kills the link.
- Shorten time to activation. Remove steps, defaults and screens between sign-up and the event. Track the median hours or days it takes. Result: a time-to-activation number and a list of the steps removed.
- Track it by cohort. Report the activation rate and later retention for each sign-up month, side by side. Result: a cohort table that shows whether activation changes are followed by retention changes.
Examples
Slack, from its founder's own interview
Documented. In a [2015 First Round Review interview](https://review.firstround.com/from-0-to-1b-slacks-founder-shares-their-epic-launch-strategy/), Stewart Butterfield said any team that had exchanged 2,000 messages had really tried Slack, and that 93 percent of those customers were still using it. He said the number came from looking at which companies stuck. It is a team-level threshold read off past customers. He did not say that reaching it causes retention.
Twitter and the follow count, as reported in a book
Documented, but at second hand. The authors of Hacking Growth, in an [excerpt](https://mattermark.com/putting-it-all-together-how-josh-elman-identified-a-growth-driver-at-twitter/), say highly retained users typically followed around 30 accounts, and the growth team redesigned first use around suggestions of whom to follow. The words are Sean Ellis and Morgan Brown's description of the team's work, not a quote from the team.
A payments app, with illustrative numbers
Illustrative, arithmetic only. A fintech app gets a thousand sign-ups a month and 300 make a first payment within seven days, so the activation rate is 30 percent. At day 90, 60 percent of those 300 are still active against 20 percent of the other 700, a threefold gap. The team tests a shorter identity check by sending half of new users to it. The number that decides is day-90 retention of everyone sent to each version.
When to use it
Use it when sign-ups are healthy but many leave in the first days, when a product has a clear first-value moment, or when onboarding changes are being argued about without a shared measure. It suits software, apps and service businesses where an early action can be logged and users who never reach value cannot be expected to stay.
When not to use it
Skip it when you have too few sign-ups for a stable comparison, when the product has no repeatable value moment, or when every user arrives with a very different job. Do not use a correlation as a target without a test. If the product itself is not wanted, activation work only reaches the wrong users sooner, and a product-market fit check comes first.
Common mistakes
- Treating the first correlation as a cause. Users who hit the event may simply be the more motivated ones, so pushing everyone toward it can leave retention flat.
- Hunting for a threshold in many events, counts and windows, then reporting the best one. With enough choices some pattern always appears, so confirm it on a second cohort.
- Studying only users who finished onboarding. Amplitude warns that this makes the onboarding flow look responsible for retention that these users would have shown anyway.
- Setting the activation event so late that it only describes loyal users. The useful event is the earliest one that predicts staying.
- Comparing your activation rate with someone else's benchmark without comparing definitions. Published figures use different events and windows.
FAQ
What is an aha moment?
An aha moment is the first time a user understands a product's core value, in Amplitude's wording. It can be a single event or the point after enough use. Teams make it measurable by picking an action, such as sharing a chart or placing a second order, that shows the user got that value.
What is the difference between activation and the aha moment?
The aha moment is the user's experience of value, which you cannot see directly. Activation is the measurable stand-in: the share of sign-ups in a period who complete the chosen action. Amplitude's formula divides customers who reach the aha moment by all customers who signed up.
Is '7 friends in 10 days' a real Facebook finding?
It is widely repeated, and we could not source it. The 2013 TechCrunch summary of Chamath Palihapitiya's talk does not contain it, and neither do the conference slides we read. Treat it as folklore.
What is a good activation rate?
It depends on the definition. Lenny Rachitsky's survey of over 500 products found a median of 25 percent, and 30 percent for SaaS. Amplitude reports an average day-seven activation of 6.8 percent. The two use different events and windows, so compare only with the same definition.
How do I know my activation event causes retention?
Run a randomized test. Change onboarding to move more users to the event, assign users at random, and compare retention for everyone assigned to each version. If activation rises but retention does not, the event was a marker of who stays, not a cause.
Sources
- First Round Review, Stewart Butterfield, Slack's founder on the launch strategy, 2015
- Mattermark, excerpt of Sean Ellis and Morgan Brown, Hacking Growth, on the Twitter growth team
- Penguin Random House, Sean Ellis and Morgan Brown, Hacking Growth, 2017
- TechCrunch, Chamath Palihapitiya on growth hacking and a sustainable user acquisition engine, 2013
- Growth Hackers Conference, Chamath Palihapitiya talk slides on Facebook growth
- Amplitude, Aha moment
- Amplitude, Michele Morales, The 7% retention rule, 2025
- Amplitude, Michele Morales, Getting started: driving product engagement by obsessing over activation, 2025
- Amplitude, Carmen DeCouto, Top 10 metrics to measure freemium and free trial performance, 2024
- Lenny's Newsletter, Lenny Rachitsky and Yuriy Timen, What is a good activation rate, 2022
- Casey Winters, Why onboarding is the most crucial part of your growth strategy, 2017
- Jorge Mazal, How Duolingo reignited user growth, Lenny's Newsletter, 2023
- Rahul Vohra, How Superhuman built an engine to find product-market fit, First Round Review, 2018
- Gordon, Zettelmeyer, Chapsky and Bhargava, A comparison of approaches to advertising measurement, Marketing Science, 2019 (Kellogg page)
- Eckles and Bakshy, Bias and high-dimensional adjustment in observational studies of peer effects, JASA (arXiv preprint)
- Gelman and Loken, The garden of forking paths, 2013
- Hernan and Robins, Causal Inference: What If, Chapman and Hall/CRC, 2020
- Austin Bradford Hill, The environment and disease: association or causation, Proceedings of the Royal Society of Medicine, 1965
- Kohavi, Tang and Xu, Trustworthy Online Controlled Experiments, Cambridge University Press, 2020
- Stanford Encyclopedia of Philosophy, Simpson's paradox
Last updated Oct 9, 2026


Marketing agency or growth system: when a company outgrows its agency
An agency is the right call while the founder still runs most of the company. Once the business starts copying itself into new locations or markets, it needs a system that sets goals, tests hypotheses and owns the result.

Why healthcare marketing agencies stall: the short, mid and long wins model we use with clinics
Most agencies own the click and nobody owns the front desk. How we structure clinic work in three horizons, the research behind each one, and one year of results.

Why channel tests stall after month three
Most paid channel tests do not end with a decision. They end when the budget runs out, the attribution model changes, or everyone quietly stops looking at the dashboard.