Causal inference
Causal inference is the set of methods that estimate what a change actually caused, using a comparison group or a model of what would have happened otherwise, when a randomized test is not possible.
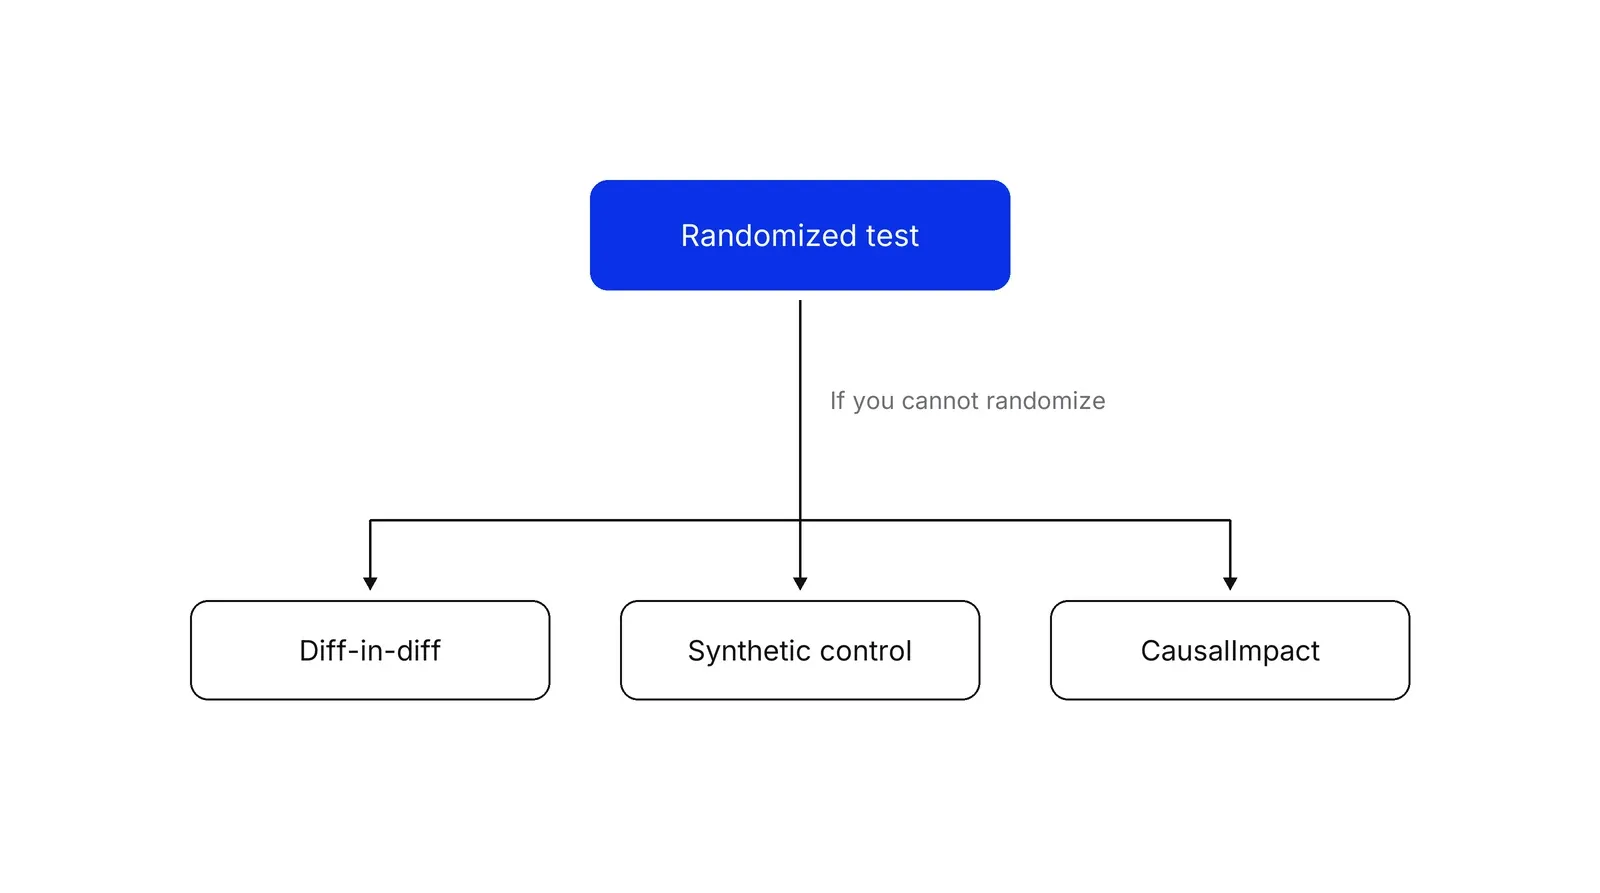
Causal inference is the set of methods for estimating what a change actually caused, rather than what merely moved alongside it. When a randomized A/B test is not possible, analysts build a counterfactual, an estimate of what would have happened without the change, using difference-in-differences, synthetic control or a Bayesian time-series model such as Google's CausalImpact.
- Origin
- Donald Rubin (potential outcomes); Card and Krueger (diff-in-diff in economics); Abadie and coauthors (synthetic control); Brodersen and coauthors at Google (CausalImpact), 1974; 1994; 2003 and 2010; 2015
- Level
- 301 · Advanced
- Fits
- Scale-up, Enterprise
- Time to apply
- one to two weeks for a first diff-in-diff or CausalImpact readout on data you already hold
- What you need
- a date when something changed (a launch, a price move, a new rule) and data from well before it · an outcome measured the same way over time, such as weekly sign-ups, orders or bookings · one or more comparison series that the change did not touch, such as another region or channel · an analyst who can run a regression or the CausalImpact package
Causal inference is the practice of estimating what a change caused, as opposed to what happened to move alongside it. Sales rose after a campaign, but sales also rise with the season, with a competitor’s stock-out, with a price cut. To separate the campaign from the rest, every method builds a counterfactual: the outcome you would have seen if the change had not happened. Donald Rubin’s 1974 paper on potential outcomes gave the field this language, and Judea Pearl’s structural causal models added a second, graph-based one.
The prize committee gave this work visible weight. The 2021 Nobel prize in economics went one half to David Card and the other half jointly to Joshua Angrist and Guido Imbens, for methodological contributions to the analysis of causal relationships. Marketers meet the same problem whenever the budget owner asks whether a launch worked and nobody ran an A/B test.
Why not just compare before and after?
A before-and-after comparison fails because everything else changed too. Randomization fixes this by giving chance the job of choosing who is treated, so the groups differ only by the treatment. When that is not possible, you need a substitute. Brett Gordon and colleagues compared such methods with randomized Facebook ad experiments and found that observational methods often fail to recover the effects that randomized experiments measured. So treat what follows as a fallback with assumptions you must check, not as a free replacement. If you can still randomize, read incrementality testing first.
Difference-in-differences: four averages, three subtractions
Difference-in-differences (diff-in-diff, DiD) is a method that compares the change over time in a treated group with the change over the same period in an untreated group. Scott Cunningham’s Mixtape describes it as four averages and three subtractions: treated after minus treated before, comparison after minus comparison before, then the first difference minus the second.
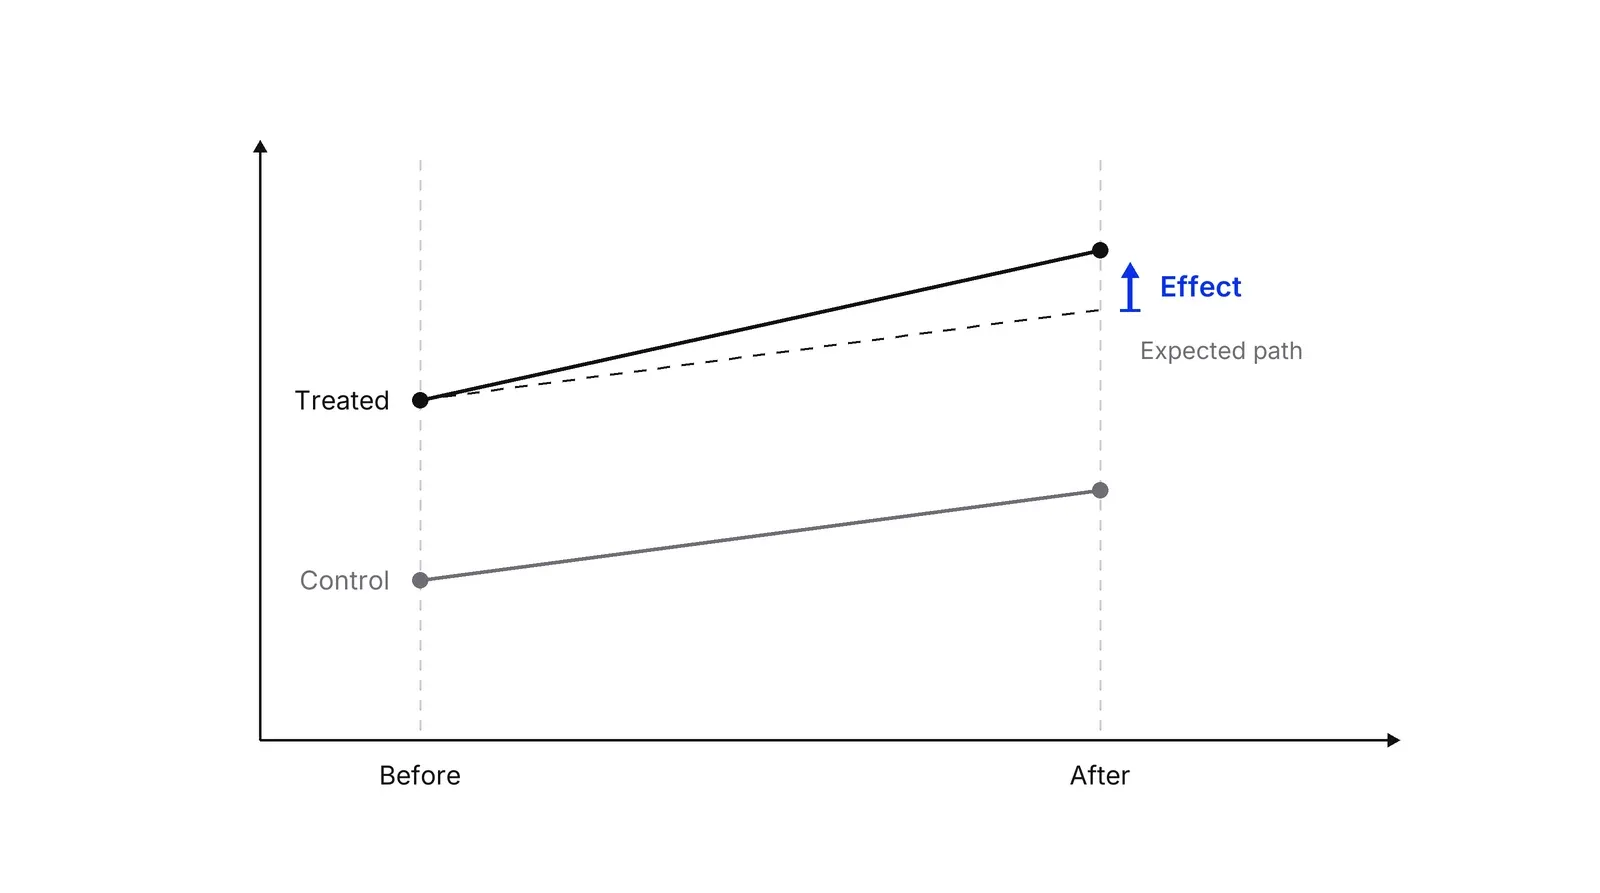
The idea is old. Cunningham traces it to John Snow’s cholera work in London: between 1849 and 1854 one water company moved its intake pipes upstream and the other did not, and the gap between the two changes came to 97 fewer deaths per 10,000 households. The modern economics example is Card and Krueger’s study of New Jersey fast food restaurants, set out in the examples below. Angrist and Pischke’s Mostly Harmless Econometrics covers diff-in-diff as one of three core tools for policy changes.
The assumption that carries everything
Diff-in-diff works only under parallel trends: without the change, the treated and control groups would have moved by the same amount. The counterfactual is never observed, so the assumption cannot be tested directly. According to the Mixtape, researchers look for indirect evidence such as event studies that check whether pre-launch trends look similar. Rambachan and Roth go further and bound how large a violation could be, given the pre-launch differences.
Standard errors are the second trap. Bertrand, Duflo and Mullainathan ran fake laws through real state wage data and found placebo effects significant at the 5% level in up to 45% of cases. Their remedies include clustering standard errors and randomization inference.
The third is timing. If units get treated on different dates, a plain two-way fixed effects regression becomes a weighted average of all possible two-group, two-period comparisons, and it can be biased when effects change over time. Newer estimators such as Callaway and Sant’Anna’s are built for staggered rollouts. Roth and colleagues summarize the recent literature.
Synthetic control: a weighted blend as the comparison
Synthetic control is a method that builds the comparison from a weighted mix of untreated units chosen to track the treated unit before the change. Abadie and Gardeazabal introduced it in a 2003 study in which, after terrorism began in the late 1960s, Basque per-capita GDP fell about 10 percentage points relative to a synthetic control region. Abadie, Diamond and Hainmueller used it for California’s tobacco program and found annual per-capita cigarette sales about 26 packs lower by 2000 than they would have been.
In marketing, synthetic control is the engine behind many geo experiments, covered on the geo-lift testing page. Abadie’s 2021 review lists the conditions: the effect should be large relative to normal volatility, the donor pool should exclude units hit by similar changes or shocks, and the treated unit should not be so extreme that no blend of others can match it. Synthetic diff-in-diff combines the two ideas.
CausalImpact: when you only have a time series
CausalImpact is an open-source method from Google that predicts the counterfactual with a Bayesian structural time-series model. Brodersen and colleagues built it for marketing questions: the model learns from the pre-launch period how the outcome relates to control series, then forecasts the post-launch period as if nothing had happened. They say it can show how the effect develops over time and absorb seasonality and trends, which classical diff-in-diff cannot.
The package documentation states the conditions plainly: the control series must not be affected by the intervention, and the relationship between controls and the outcome must stay stable after launch. A bad control series gives a confident, wrong answer.
Which method fits
| Situation | Method | Main risk |
|---|---|---|
| One treated group, one natural comparison group, before and after data | Difference-in-differences | Parallel trends fail |
| One or a few treated units, many candidate controls | Synthetic control | Poor pre-launch fit, spillover |
| One treated series, long history, unrelated control series | CausalImpact | Controls affected by the change |
| Can assign who gets the change | Randomized test | Cost, sample size |
Whatever the method, report an interval, not a point. The same logic as statistical significance applies. Use these estimates to calibrate a marketing mix model rather than replace one. A Growth Lab plan starts from deciding which of the questions above deserves a real experiment and which can live with an estimate.
How to apply Causal inference, step by step
- Write the causal question and the decision. State one change, one outcome and the decision the answer will drive: if the new referral program added fewer than 150 sign-ups a week, close it. Result: a one-line question with a threshold.
- Fix the date and the unit that was treated. Record exactly when the change started, which regions, customers or channels received it, and whether anyone could react before launch. Result: a treated group, a start date and a list of other changes made in the same window.
- Pick a comparison that the change did not touch. Choose a control group that was not treated and is not affected by the treated group. With one clear comparison group use difference-in-differences; with many candidates, synthetic control; with only a long history and some unrelated series, CausalImpact. Result: a named method and a control list.
- Test the assumption before you read the effect. Plot treated and control for the pre-launch period and check that they move together. Run the same method on a fake launch date in the past, where the true effect is zero. Result: a pre-trend chart and a placebo estimate close to zero.
- Estimate the effect with its uncertainty. Compute the gap between the actual outcome and the counterfactual after launch, with an interval, and clustered standard errors or a posterior interval as the method requires. Result: an effect size with a range, in the units of the decision.
- Stress-test and decide. Drop one control at a time, shift the start date by a week and try another control set. If the answer holds, act on it. If it flips, say the data cannot settle the question. Result: a decision, or a proposal for a proper experiment.
Examples
Card and Krueger on New Jersey's minimum wage
New Jersey raised its minimum wage from $4.25 to $5.05 on April 1, 1992, while neighbouring Pennsylvania did not. David Card and Alan Krueger surveyed 410 fast food restaurants in both states and compared the change in employment. Their difference-in-differences estimate, as reported in Scott Cunningham's Mixtape, was +2.76 full-time-equivalent jobs per restaurant, against the textbook prediction of a fall. A re-analysis by David Neumark and William Wascher using payroll records found a 4.6% employment decrease in New Jersey instead. Same method, different data, opposite sign, which is why the data and the checks matter as much as the method.
A fintech referral program launched in one country
Illustrative arithmetic, no real company implied. A payments app launches a referral program in Spain but not in Portugal. Spain gains 300 new accounts a week after launch and Portugal gains 60 over the same weeks. The difference-in-differences estimate is 300 minus 60, or 240 accounts a week. Portugal's rise is what Spain would probably have seen anyway because of season and a shared marketing push. If Portugal had been growing faster than Spain for months before launch, the 240 would overstate the effect.
A clinic network retiring a call centre script
Illustrative. A group of clinics changes its phone script on one date in all nine cities at once, so there is no untreated city. Using CausalImpact, the analyst predicts weekly booked first visits from the pre-launch history plus two series the script cannot affect: web searches for the clinic's service and bookings at a partner pharmacy chain. The gap between predicted and actual bookings after launch, with its interval, is the estimated effect.
When to use it
Use it when a randomized test was impossible or already skipped: a price change, a new product launch, a regulation, a rollout that hit some regions first, or a campaign that ran everywhere at once. It also fits as a cross-check on a marketing mix model and when you need an effect estimate this quarter from data you already have.
When not to use it
Skip it when you can still randomize: a holdout or an A/B test needs fewer assumptions. Skip it when there is no credible comparison, when the treated group was chosen because it was already improving, or when you have only a few weeks of history. A tidy chart does not rescue a comparison group that was never comparable.
Common mistakes
- Picking a comparison group because it looks similar on average, then never plotting the trends before launch. Matching on levels does not show that the groups move together.
- Running a staggered rollout through a plain two-way fixed effects regression. Andrew Goodman-Bacon showed the estimate mixes many two-group comparisons, including already-treated units used as controls, and can be biased when effects change over time.
- Ignoring serial correlation. Bertrand, Duflo and Mullainathan found that conventional standard errors flagged placebo laws as significant far more often than the nominal 5% of the time.
- Using a control that the change also touched, such as a neighbouring city that saw the same ad. The effect then leaks into the control and shrinks.
- Reporting one number. Rerun with different controls and start dates, and report the range.
FAQ
What is causal inference in simple words?
It is working out whether a change caused an outcome, not just whether the two moved together. Every method estimates a counterfactual, the outcome that would have happened without the change, and compares it with what did happen. A randomized test builds that counterfactual with a control group chosen by chance. Other methods build it from data.
How can you estimate an effect without an A/B test?
Use a comparison that stands in for the missing control. Difference-in-differences uses a similar untreated group, synthetic control blends several untreated units, and CausalImpact predicts the outcome from unrelated time series. All depend on assumptions you can only partly test, so they work best as a second choice to randomization.
What is the parallel trends assumption?
It says that, without the change, the treated and comparison groups would have moved by the same amount over time. It concerns the unobserved no-change scenario, so it cannot be tested directly. Analysts check that the groups moved together before launch and test how large a violation would have to be to overturn the result.
Difference-in-differences or synthetic control: which one?
Use difference-in-differences when one natural comparison group exists. Use synthetic control when you have one or a few treated units and many candidate controls, none of which matches well alone. Synthetic control weights the controls to track the treated unit before launch, which relaxes the parallel trends requirement.
How is CausalImpact different from difference-in-differences?
CausalImpact fits a Bayesian structural time-series model to the pre-launch period and forecasts the counterfactual after it. Its authors say this lets it show the effect's evolution over time and handle trends and seasonality, which classical diff-in-diff does not. It still needs control series that the change did not affect.
Sources
- David Card, Alan B. Krueger, Minimum Wages and Employment: A Case Study of the Fast Food Industry in New Jersey and Pennsylvania, NBER Working Paper 4509 (AER 84(4), 1994)
- David Neumark, William Wascher, The Effect of New Jersey's Minimum Wage Increase on Fast-Food Employment: A Re-Evaluation Using Payroll Records, NBER Working Paper 5224
- Alberto Abadie, Javier Gardeazabal, The Economic Costs of Conflict: A Case Study of the Basque Country, American Economic Review 93(1), 2003
- Alberto Abadie, Alexis Diamond, Jens Hainmueller, Synthetic Control Methods for Comparative Case Studies, NBER Working Paper 12831 (JASA 105(490), 2010)
- Alberto Abadie, Using Synthetic Controls: Feasibility, Data Requirements, and Methodological Aspects, Journal of Economic Literature 59(2), 2021
- Kay H. Brodersen, Fabian Gallusser, Jim Koehler, Nicolas Remy, Steven L. Scott, Inferring causal impact using Bayesian structural time-series models, Annals of Applied Statistics 9(1), 2015
- Google Research, Inferring causal impact using Bayesian structural time-series models (publication page)
- Google, CausalImpact R package documentation
- Google, CausalImpact source repository
- Scott Cunningham, Causal Inference: The Mixtape, online edition
- Scott Cunningham, Causal Inference: The Mixtape, chapter 9: Difference-in-Differences Fundamentals
- Joshua D. Angrist, Jörn-Steffen Pischke, Mostly Harmless Econometrics, Princeton University Press, 2009
- Nick Huntington-Klein, The Effect: An Introduction to Research Design and Causality
- Royal Swedish Academy of Sciences, Press release: The Prize in Economic Sciences 2021
- Donald B. Rubin, Estimating causal effects of treatments in randomized and nonrandomized studies, Journal of Educational Psychology 66(5), 1974
- Judea Pearl, Causal inference in statistics: An overview, Statistics Surveys 3, 2009
- Andrew Goodman-Bacon, Difference-in-Differences with Variation in Treatment Timing, NBER Working Paper 25018 (Journal of Econometrics 225(2), 2021)
- Brantly Callaway, Pedro H. C. Sant'Anna, Difference-in-Differences with multiple time periods, Journal of Econometrics 225(2), 2021
- Marianne Bertrand, Esther Duflo, Sendhil Mullainathan, How Much Should We Trust Differences-in-Differences Estimates?, NBER Working Paper 8841 (QJE 119(1), 2004)
- Jonathan Roth, Pedro H. C. Sant'Anna, Alyssa Bilinski, John Poe, What's trending in difference-in-differences?, Journal of Econometrics 235(2), 2023 (arXiv)
- Ashesh Rambachan, Jonathan Roth, A More Credible Approach to Parallel Trends, Review of Economic Studies 90(5), 2023
- Dmitry Arkhangelsky, Susan Athey, David A. Hirshberg, Guido W. Imbens, Stefan Wager, Synthetic Difference-in-Differences, American Economic Review 111(12), 2021
- Susan Athey, Guido W. Imbens, The State of Applied Econometrics: Causality and Policy Evaluation (arXiv version)
- Brett R. Gordon, Florian Zettelmeyer, Neha Bhargava, Dan Chapsky, A Comparison of Approaches to Advertising Measurement: Evidence from Big Field Experiments at Facebook, Marketing Science 38(2), 2019
Last updated Oct 9, 2026


Marketing agency or growth system: when a company outgrows its agency
An agency is the right call while the founder still runs most of the company. Once the business starts copying itself into new locations or markets, it needs a system that sets goals, tests hypotheses and owns the result.

Why healthcare marketing agencies stall: the short, mid and long wins model we use with clinics
Most agencies own the click and nobody owns the front desk. How we structure clinic work in three horizons, the research behind each one, and one year of results.

Why channel tests stall after month three
Most paid channel tests do not end with a decision. They end when the budget runs out, the attribution model changes, or everyone quietly stops looking at the dashboard.