Value stream mapping
Value stream mapping draws every step of a flow from request to delivery, with the time work spends being done and the time it spends waiting, so a team can see where the delay really is.
Value stream mapping (VSM) is a method that draws every step a unit of work passes through, from request to delivery, and records two times for the whole flow: process time, when someone is actually working on it, and lead time, the total elapsed time. The gap between them is waiting, which is where most improvement is found.
- Origin
- Toyota (material and information flow diagrams); Mike Rother and John Shook (Learning to See), Toyota practice; Learning to See, Lean Enterprise Institute, commonly dated 1999
- Level
- 301 · Advanced
- Fits
- Scale-up, Enterprise
- Time to apply
- One to three days for a current-state map of one flow, including the walk
- What you need
- one flow with a clear start and end, such as a patient visit or a lead from form to first call · one person who leads the mapping and three to six people who do the work · a stopwatch or timestamps from a system, plus a wall, paper and sticky notes
Value stream mapping is a method for drawing every step a piece of work goes through, from request to delivery, and timing both the work and the waiting. The Lean Enterprise Institute (LEI) describes it as diagramming every step in the material and information flows needed to take a product from order to delivery. The result is one sheet that shows where time goes, so a team stops arguing about which step is slow and looks at the queues between steps.
Where does value stream mapping come from?
It comes from Toyota’s production practice and reached a wider audience through a workbook. LEI says Toyota developed the tool and called it a material and information flow diagram. Toyota describes its production system as resting on just-in-time and jidoka, with the aim of removing waste and cutting the time from order to delivery.
Mike Rother and John Shook wrote the method down in Learning to See, a 148-page workbook from LEI built around a case study. Its edition dates vary: bookseller records give 1999, while LEI’s own store page shows a later listing, so we cite the book without an edition year. In 1997 Peter Hines and Nick Rich proposed seven mapping tools, chosen by the type of waste you want to remove. So “value stream mapping” names a family of methods, and Learning to See is the best-known version of it.
How do process time and lead time differ?
Process time is the time someone is actually working on the item, and lead time is the elapsed time from the start of the flow to its end. LEI defines lead time as the time one piece takes to move through a process or value stream from start to finish. The gap between the two is waiting.
Dividing process time by lead time gives the share of elapsed time that is work. We call this flow efficiency here, in the sense Modig and Åhlström use when they contrast it with keeping resources busy. Their book’s site argues that chasing resource utilisation tends to add work to be done. The arithmetic behind it is Little’s Law: throughput equals work in progress divided by cycle time, so at a fixed throughput, more items in progress means longer waits.
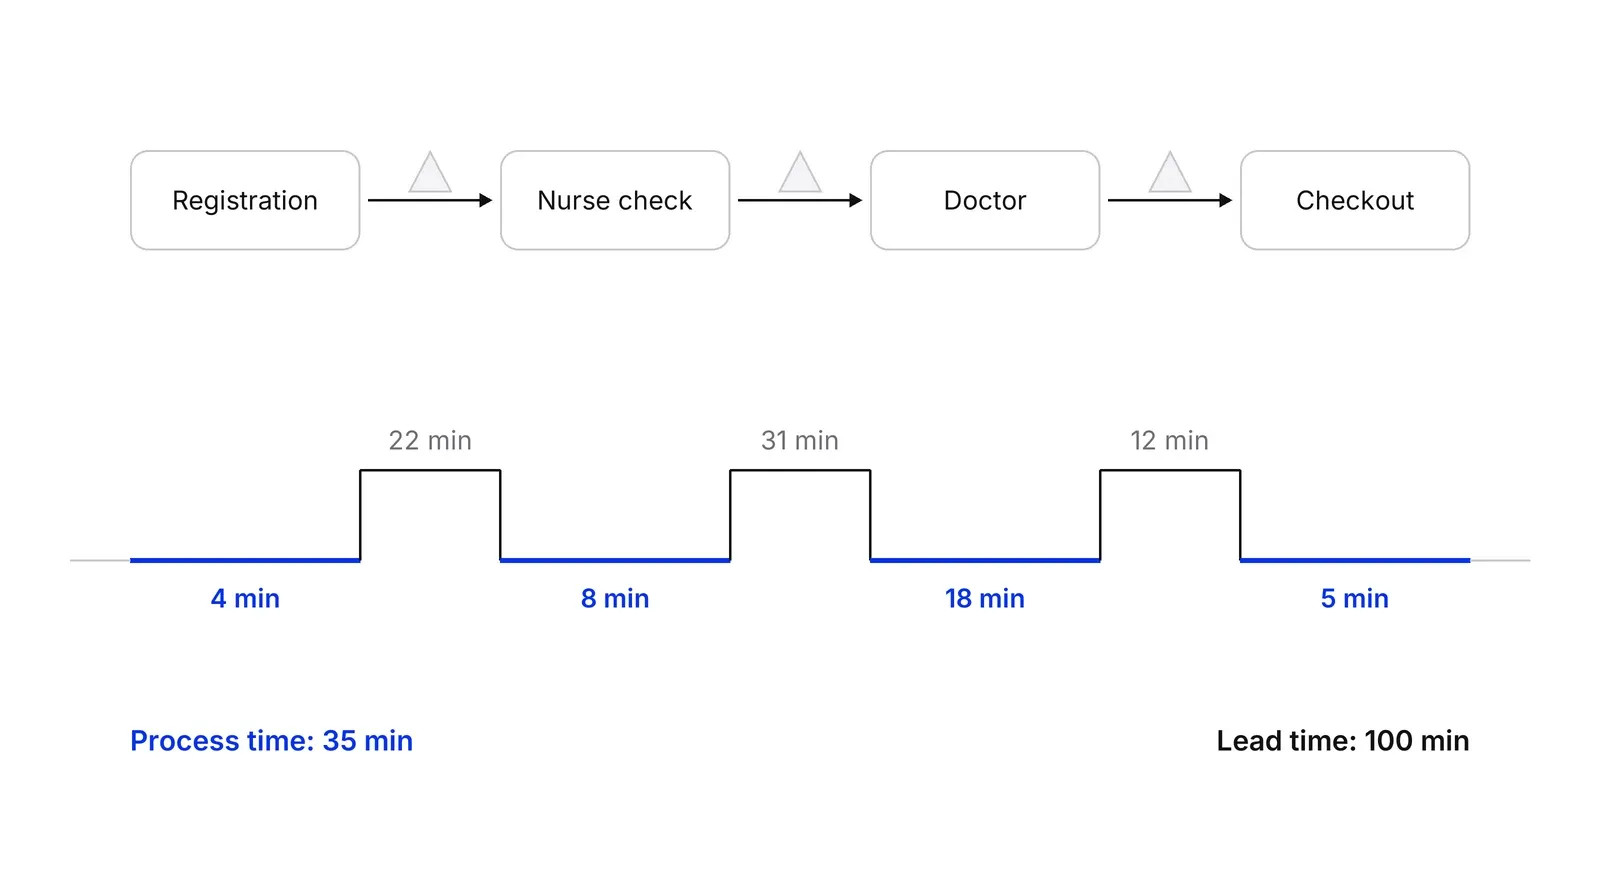
In this example flow efficiency is 35 percent. Speeding up the doctor by two minutes changes 100 minutes to 98, while removing the 31-minute wait before the doctor changes it far more.
What does a current-state map contain?
A current-state map has a box for each step, a triangle for each queue, arrows for how work moves and for how information tells each step what to do, and a timeline underneath. LEI’s guidance is to start with the current state, pick one product family, have one person lead and begin door to door.
Healthcare adaptations add a plain test for each activity. The LEI patient-journey guide gives the example of a patient who spends 15 minutes on a gurney waiting for imaging: that time does not provide value. A 2025 hospital study sorts activities into value-added, necessary but non-value-added and non-value-added. IHI’s 2005 white paper makes identifying value-added and non-value-added steps the first move toward lean operations.
How does the future-state map work?
The future-state map redraws the same flow with the waits you can remove. Keep the time of the work, change the queues, and pick two or three changes to test first.
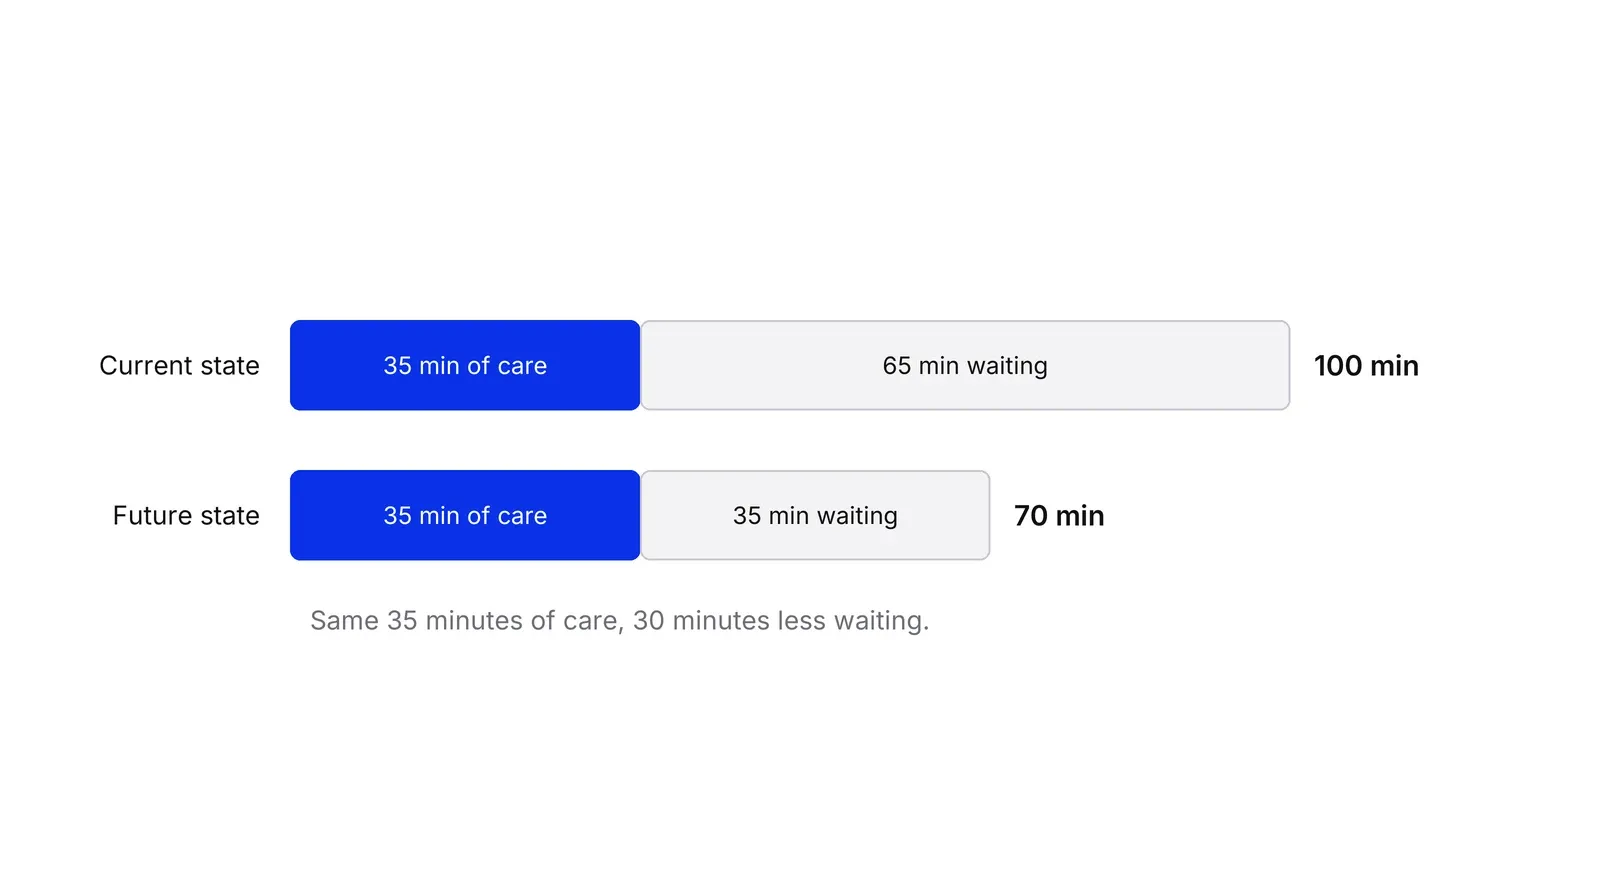
A documented case shows the scale of such work. An FAA office near Boston ran a three-day mapping session: on day two the team mapped the current state and logged 29 instances of waste, and on day three it built a future state with eight action items. LEI reports that the time to process key certification documents fell by 51 percent. The source is LEI’s own account of an early result, with no independent evaluation.
How does it compare with other process maps?
Use VSM when the question is where time is lost, and another map when the question is scope, logic or experience.
| Tool | Main question | What it adds |
|---|---|---|
| Value stream map | Where does time go? | Time per step and per queue, information flow |
| SIPOC | Who supplies and receives? | One-page scope before detail |
| BPMN model | Exactly how does it run? | Decisions, roles and exceptions |
| Service blueprint | What does the customer experience? | Customer actions and the staff and systems behind them |
| Kanban board | What is in progress now? | A live view that limits work in progress |
A common sequence is SIPOC to set scope, VSM to find the queue, five whys to ask why it exists, and a kanban board to hold the gain.
What does the evidence say outside the factory?
The evidence is positive on time and weak on proof. A 2017 systematic review of VSM in care facilities retrieved 903 articles and included 22 studies. It found positive effects on waiting time and length of stay, and noted that all designs were before and after studies without controls.
- A radiology group reviewed seven mapping techniques and chose process mapping for angioplasty and stent procedures. Its authors also mapped how endovascular stents were procured: only 2 of 13 processes added value, and a forecast-driven push system could move to a pull system using consignment stock.
- A hospital group used VSM to find bottlenecks in specialist outpatient clinics. Mean waiting time fell from 162 to 52 days six months later, measured on waiting lists, not inside a single visit.
- A 2025 study of an ophthalmology and a dental clinic in Saudi Arabia estimated lead times falling from 3,118 to 1,749 seconds and from 6,378 to 5,358 seconds. The authors could not implement the changes, so these are estimates from redrawn maps.
- A federal agency study reported a time reduction of about 82 percent for a family of administrative processes.
Limits are documented too. A review of 131 articles found that traditional lean metrics need checking for each setting, and Luz and colleagues note that traditional VSM fails to consider variability. A 2021 scoping review found that maps in health care vary widely and called for standardisation. In a marketing or fintech flow, treat the map as a way to find the queue, and measure the result with your own before and after numbers. A Growth Lab plan starts from a map of this kind: see the Growth Lab practice.
How to apply Value stream mapping, step by step
- Choose one flow and its two ends. Pick a single product or service family and write the first and last event, for example a patient arriving at the door and leaving it. LEI advises one person to lead the mapping and to start door to door. Result: a named flow with boundaries on one sheet.
- Walk the flow and draw each step. Go where the work happens and draw each step as a box, with the queue between steps. Draw how information moves too: bookings, orders, messages. Result: a current-state map based on what you saw, not on what the procedure says.
- Time the work and the waiting. For each step record the time someone actually works on the item, and for each queue the time it sits. Timestamps from a system work when they exist. Result: process time per step and wait time per queue.
- Add the timeline and the ratio. Sum the working times into process time and everything into lead time, then divide the first by the second. Result: one line at the bottom of the map that shows how much of the elapsed time is work.
- Sort activities and ask why. Mark each activity as adding value, necessary but not adding value, or neither. For the longest waits ask why they exist, using a method such as the five whys. Result: a short list of causes, each tied to a queue or a step.
- Draw the future state. Redraw the flow with the waits you can remove and pick two or three changes to try first. Result: a future-state map with a target lead time and named owners.
- Measure again. After the changes run for a few weeks, time the flow the same way and compare it to the current-state map. Result: a before and after pair, and the next map to draw.
Examples
A clinic patient visit
Illustrative, no real clinic implied. A visit has four steps: registration 4 minutes, nurse check 8, doctor 18, checkout 5. Between them patients wait 22, 31 and 12 minutes. Process time is 35 minutes and lead time is 100, so 35 percent of the visit is work. Moving the nurse check to run while the patient waits for registration to clear is the kind of change a future-state map would test.
A marketing lead from form to first call
Illustrative. A lead form is submitted, the lead is checked for duplicates, assigned and called. Working time per lead is about 12 minutes, but leads sit in the assignment queue until the next morning. If the flow takes 20 hours, the work is 1 percent of lead time, and a faster ad creative cannot fix that.
A fintech merchant onboarding
Illustrative. Documents arrive, a compliance reviewer checks them, a risk analyst approves and an account is opened. Most of the elapsed days are the document waiting for the next person, and a request for a missing file restarts the queue. The map shows the number of such loops per application, which a process description does not.
When to use it
Use it when a flow feels slow and nobody can say where, when work passes through several teams, or when customers wait longer than the work takes. It suits flows that repeat often enough to time, such as visits, orders, applications and leads.
When not to use it
Skip it for one-off projects, for flows with wildly different paths each time, or when the goal is to design a customer experience, which a service blueprint handles better. Reviews also note that standard VSM ignores variability, so highly variable flows need more than one average.
Common mistakes
- Mapping from the procedure manual instead of walking the flow. LEI's [patient-journey guide](https://www.lean.org/wp-content/uploads/2021/01/perfecting-patien-journeys-ch1.pdf) sends teams on a walk through the value stream to see firsthand what is happening, and a written procedure rarely shows the queues.
- Measuring only the work steps. The method exists to expose the time between steps; a map without wait times is a flowchart.
- Mapping the whole company at once. LEI advises one product family and a single leader, and a map that covers everything shows nothing.
- Treating the future state as the result. A map is a plan; one hospital study redrew its future state from estimates because it could not implement the changes.
- Chasing busy resources. If everyone is fully occupied, queues grow; Modig and Åhlström argue that chasing utilisation tends to add work to be done.
FAQ
What is the difference between process time and lead time?
Process time is the time someone is actually working on an item. Lead time is the whole elapsed time from the start of the flow to its end, including every wait. LEI defines lead time as the time one piece takes to move through a process from start to finish.
What is flow efficiency, and what is a good value?
Flow efficiency is process time divided by lead time, as a percentage. We found no benchmark that holds across industries, so use it to compare your own flow before and after a change. Low values mean most of the time is waiting.
Who created value stream mapping?
LEI says Toyota developed the tool and called it a material and information flow diagram. Mike Rother and John Shook wrote it up for a wider audience in the workbook Learning to See. Hines and Rich later proposed seven mapping tools, which shows the family of methods is wider than one book.
Does value stream mapping work in services and offices?
There is evidence, mostly from health care and public offices, that it shortens waiting time. The studies are mostly before and after designs without a control group, so the size of the effect is uncertain. Results from one clinic or office do not transfer automatically.
How is VSM different from a flowchart or BPMN model?
A flowchart or BPMN model shows steps, decisions and handoffs. A value stream map adds time for each step and each queue and the information that triggers work. Use BPMN to specify a process and VSM to find where time is lost.
Sources
- Lean Enterprise Institute, Learning to See (store page)
- Lean Enterprise Institute, Value-stream mapping (Lean Lexicon)
- Toyota Motor Corporation, Toyota Production System
- Peter Hines and Nick Rich, The seven value stream mapping tools, International Journal of Operations & Production Management 17(1), 1997
- John D. C. Little, Little's Law as Viewed on Its 50th Anniversary (reprint), Operations Research 59(3), 2011
- Niklas Modig and Pär Åhlström, This Is Lean: Resolving the Efficiency Paradox
- Institute for Healthcare Improvement, Going Lean in Healthcare, Innovation Series white paper, 2005
- Lean Enterprise Institute, Perfecting Patient Journeys (Keyte, Shuker and Worth, 2013)
- Lean Enterprise Institute, Perfecting Patient Journeys, chapter 1 excerpt
- Ulf K. Teichgräber and Maximilian de Bucourt, Applying value stream mapping techniques to eliminate non-value-added waste for the procurement of endovascular stents, European Journal of Radiology 81(1), 2012
- Maximilian de Bucourt et al., Process mapping of PTA and stent placement in a university hospital interventional radiology department, Insights into Imaging 3, 2012
- Kjell Arne Johannessen and Nina Alexandersen, Improving accessibility for outpatients in specialist clinics, BMC Health Services Research 18, 2018
- Abdulrahman Alogla, Revisiting lean healthcare: adopting value stream mapping from manufacturing, Frontiers in Health Services, 2025
- Nowak, Pfaff and Karbach, Does Value Stream Mapping affect the structure, process, and outcome quality in care facilities? A systematic review, Systematic Reviews 6, 2017
- Marin-Garcia, Vidal-Carreras and Garcia-Sabater, The Role of Value Stream Mapping in Healthcare Services: A Scoping Review, International Journal of Environmental Research and Public Health 18(3), 2021
- Ritthaisong and Kessomboon, Application of value stream mapping to design and develop an inventory management system in a hospital, F1000Research, 2025
- Wenchi Shou et al., A cross-sector review on the use of value stream mapping, International Journal of Production Research 55(13), 2017
- Gabriel Preuss Luz et al., A systematic literature review on the stochastic analysis of value streams, Production Planning and Control 32(2), 2021
- Peralta et al., Lean office: administrative value stream mapping in a routine of work in a public organ, Journal of Lean Systems 2(3), 2017
- Lean Enterprise Institute, Value-stream mapping at FAA office improves information flow, The Lean Post, 2010
- Process Excellence Network, An Introduction to Lean Office, 2010
Last updated Oct 9, 2026


Fractional COO or embedded operations team? How to choose at Series A
The two models solve different problems: how to tell which one your company needs, and what each costs in time and control.

What operational systems successful fintech startups use: lessons from ten companies
Starling, Monzo, Qonto, bunq, Lunar, Pleo, Tide, Ramp, Mercury and Column scaled on four operating systems. Regulators' findings show what breaks when one of them lags behind growth.

What a revenue operations manager actually owns
Pipeline definitions, CRM hygiene, forecasting and the handoffs between marketing, sales and success. What the role covers, and how it differs from sales ops.