Price elasticity
Price elasticity of demand is the percentage change in the quantity customers buy divided by the percentage change in price, and it tells you whether a price change will raise or lower your revenue.
Price elasticity of demand is the percentage change in quantity demanded divided by the percentage change in price. Alfred Marshall defined it in 1890. A value above 1 in absolute terms means demand is elastic, so raising price lowers revenue. A value below 1 means demand is inelastic, so raising price raises revenue. It is estimated from price tests or sales history.
- Origin
- Alfred Marshall, 1890
- Level
- 301 · Advanced
- Fits
- Small and mid-size, Scale-up
- Time to apply
- a day to pull data and calculate, then two to six weeks for a clean price test
- What you need
- unit sales and price history by product or plan, ideally weekly for at least a year · a log of promotions, price changes and launches over the same period · the ability to show different prices to comparable customers, or to change price in one market first · unit cost, so you can turn an elasticity into profit
Price elasticity of demand is the percentage change in the quantity customers buy, divided by the percentage change in price. Alfred Marshall introduced it in his 1890 Principles of Economics, in a chapter on the elasticity of wants. He wrote that the elasticity of demand in a market is great or small according to whether the amount demanded rises much or little for a given fall in price. A footnote gives the numbers: a one percent fall in price that raises sales by one percent is an elasticity of one.
The number answers a question every pricing decision starts with: if we move the price, what happens to volume, and does revenue go up or down?
How do you calculate price elasticity?
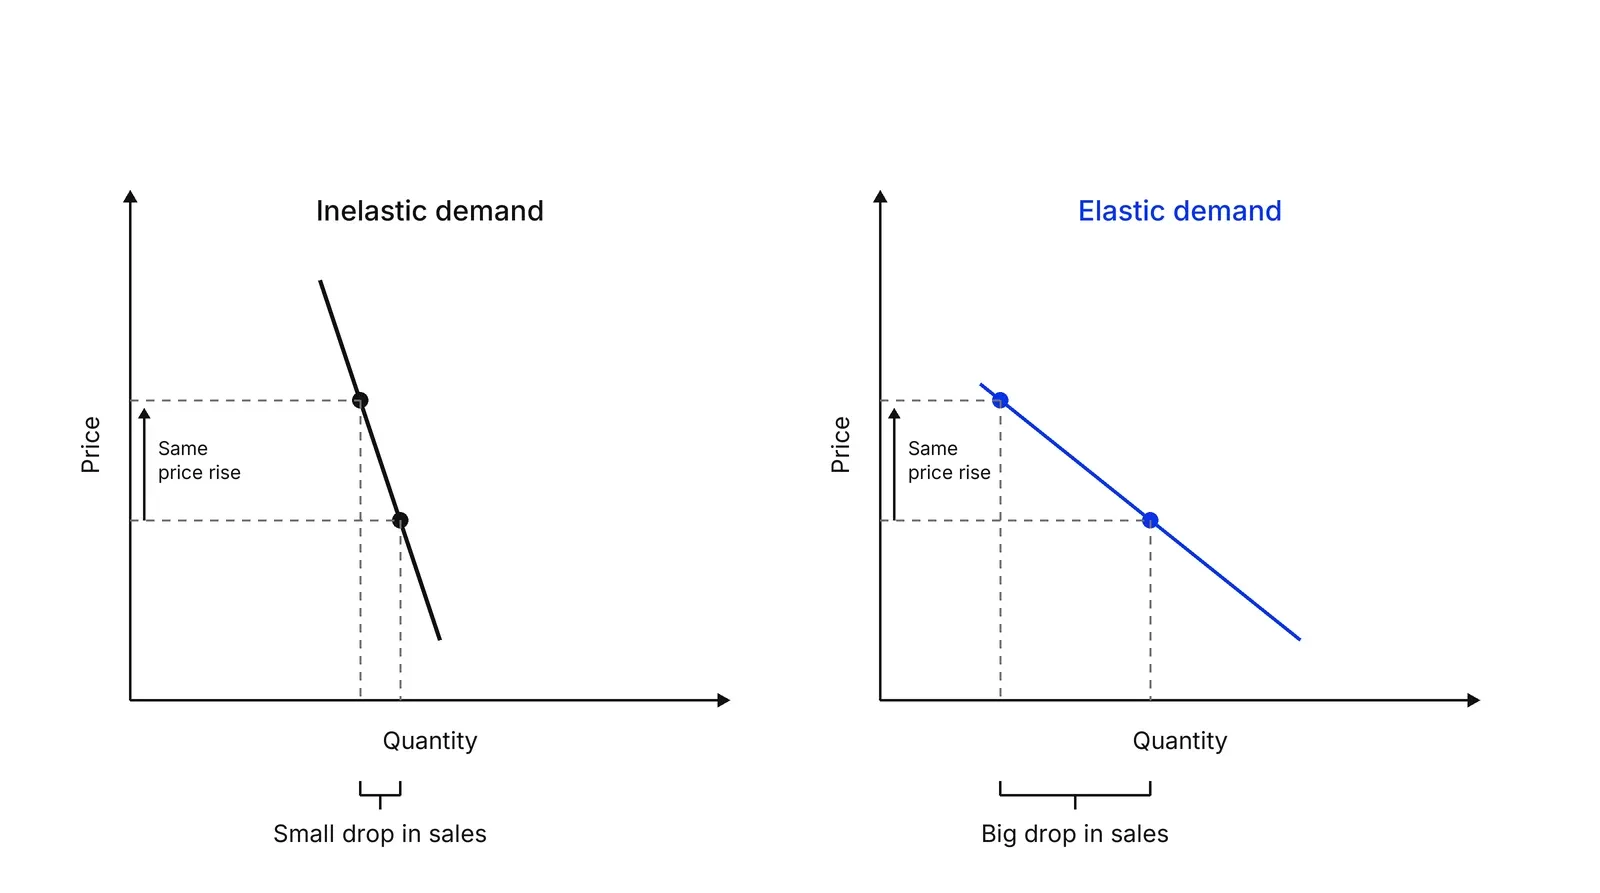
Divide the percentage change in quantity by the percentage change in price. Because price and quantity move in opposite directions the result is negative, and it is usually quoted as an absolute value. OpenStax’s economics text calls demand elastic above 1, inelastic below 1 and unitary at exactly 1.
For changes of more than a few percent, use the midpoint method: measure each change against the average of the old and new values. It gives the same answer whether the price rises or falls between two points.
Two illustrative cases, using made-up numbers and the midpoint formula, show why the result matters:
| Software plan | Skin clinic treatment | |
|---|---|---|
| Price change | +10 dollars | +50 dollars |
| Units change | -100 | -120 |
| Elasticity (midpoint) | about -0.47 | about -1.59 |
| Revenue change | +5,000 | -10,000 |
The price rise is the same 25 percent in both rows, and the revenue effect has opposite signs. Revenue rises when demand is inelastic and falls when it is elastic, because that is arithmetic: price times units.
What do the large studies say?
Two meta-analyses, which pool the results of many earlier studies, set the benchmarks most marketers use. Gerard Tellis’s 1988 study in the Journal of Marketing Research pooled 367 estimates from more than 220 brands or markets and reported an uncorrected mean elasticity of -1.76. His working paper says that mean is a reasonable benchmark for managers who cannot measure their own market, and that estimates run less negative in the early product life cycle and for pharmaceuticals.
Bijmolt, van Heerde and Pieters updated this in 2005. Across 1,851 price elasticities from 81 studies, they found an average of -2.62. Two of their findings change how you should read your own data. Sales elasticities grew in magnitude over four decades. And accommodating price endogeneity, meaning that firms set prices in response to demand, had a strong effect that increased the size of the elasticities.
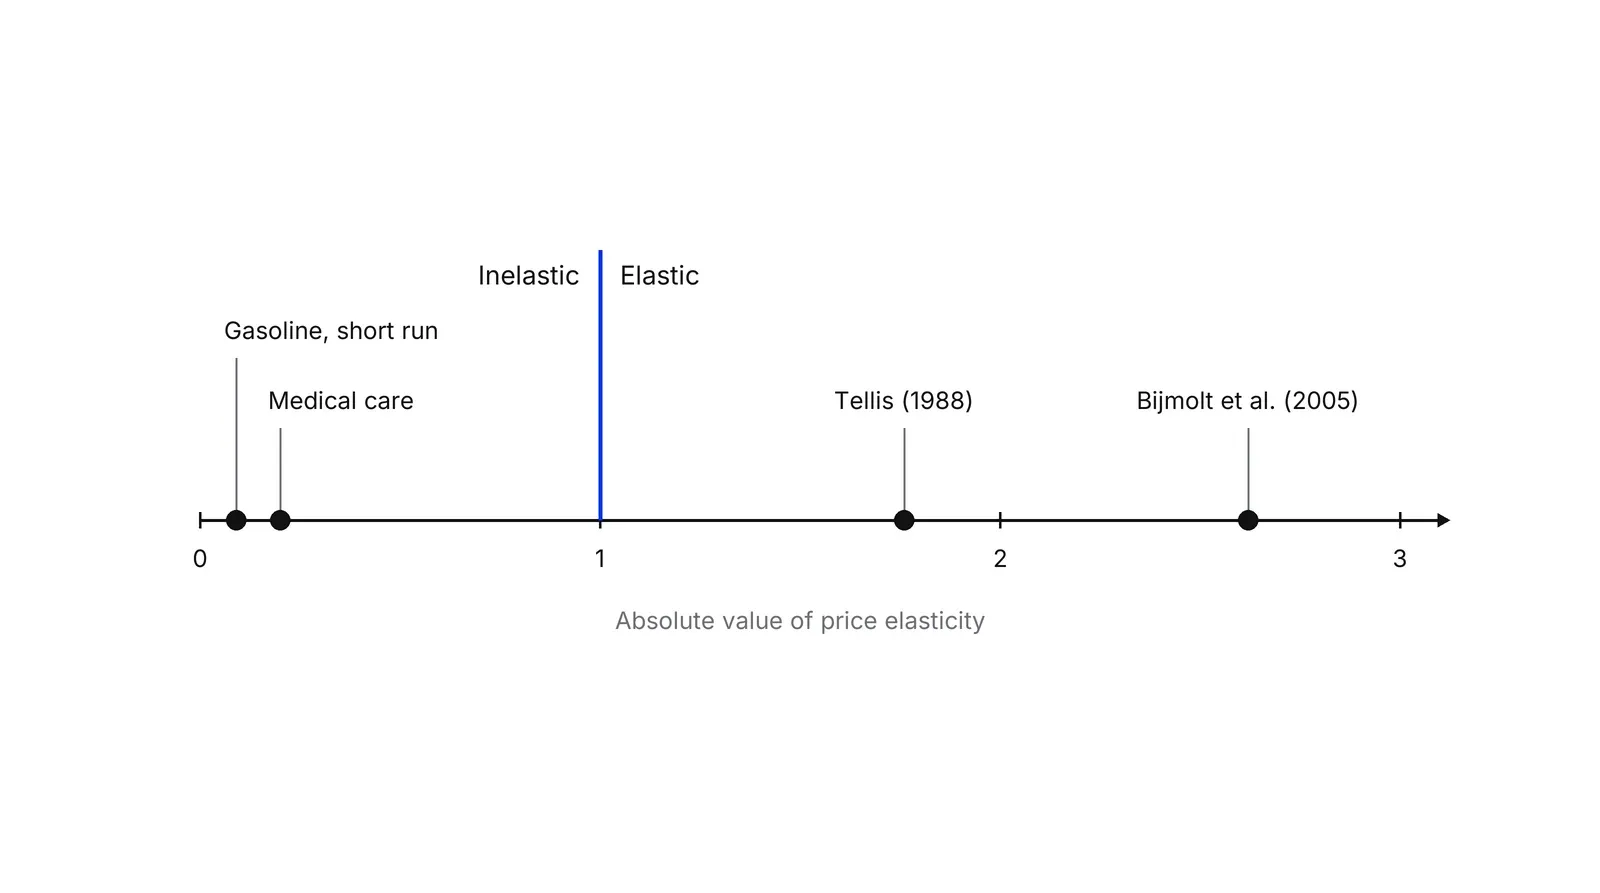
Necessities look different. A 2012 meta-analysis of gasoline demand by Havranek, Irsova and Janda found publication bias and, after correcting for it, an average short-run elasticity of about -0.09 and a long-run one of about -0.31. The RAND experiment put medical care at about -0.2.
Why will your number differ from the benchmarks?
Elasticity belongs to a product, a customer group and a time horizon, so averages are a starting guess. Hoch and colleagues estimated price elasticities for 18 product categories in a chain of 83 supermarkets and found that store demographics and competition explained on average 67% of the variation in price response.
Four things move your number:
- Time. Lin and Sacks found, with RAND data, that sensitivity to short-lasting price changes is about twice that for long-lasting ones. A promotion can look more elastic than a permanent price.
- Where the bump comes from. Gupta split a promotional sales bump into brand switching, purchase timing and quantity. Some of the lift is customers buying early, not new demand.
- Substitutes. Own-price elasticity is distinct from cross-price elasticity, the response to a rival’s price. Auer and Papies found a mean cross-price elasticity of 0.26 across 7,264 estimates.
- What the price signals. In field experiments by Anderson and Simester, a $9 ending raised demand in all three tests, and more for new products.
How do you estimate it in practice?
Estimate it from a price test where you control who sees which price, or from past changes that happened alone. Observational data is the weakest source. Villas-Boas and Winer showed that ignoring the fact that managers set prices in response to demand can bias estimates substantially, which is why a simple regression of sales on price often returns a number that is too small.
A randomised test avoids this. Stripe’s guidance is to define one hypothesis, change one price variable, keep everything else identical and split comparable customers at random, often new visitors or sign-ups. Kohavi, Tang and Xu’s book on online controlled experiments covers the traps: carryover, and results that look too good to be true. See experimentation programs for the operating model and incrementality testing for holdout design. Check sample size and minimum detectable effect before you start, because price effects are often small.
When a clean randomised split is impossible, natural experiments help. Cohen and colleagues used Uber’s surge pricing thresholds, with nearly 50 million observations, to measure price sensitivity at several points on the demand curve. Dubé and Misra ran randomised pricing experiments at a large digital firm and report a 55% profit increase from an optimised price.
Surveys give an earlier, cheaper reading, and they measure stated preference, not behaviour:
| Method | Best for | Weakness |
|---|---|---|
| Past price changes | Products with history | Confounded by promotions and launches |
| Randomised price test | Products with traffic | Fairness and legal care; takes weeks |
| Van Westendorp survey | New products, acceptable range | Does not give elasticity directly |
| Conjoint analysis | Feature and price trade-offs | Stated, not observed, behaviour |
From elasticity to a price
Elasticity connects to profit through the markup. Lerner’s 1934 measure of monopoly power is the gap between price and marginal cost as a share of price. For a profit-maximising seller facing constant elasticity, that share equals 1 divided by the absolute elasticity. At an elasticity of -2 and a unit cost of 50 dollars, the profit-maximising price is 100 dollars, double cost. At -1.5 it is 150. At an elasticity between 0 and -1 the rule breaks, which is the signal that price is below the profit-maximising level.
Elasticity also changes with price on most real demand curves, so each answer holds only near the prices you tested. Competitor prices shift your curve, and the survey and test methods above feed the same decision. A Growth Lab plan starts with pricing evidence like this before it sets a channel budget: Growth Lab.
How to apply Price elasticity, step by step
- Pick one product and one price move. Choose a single plan, service or SKU and one change you are considering, such as 40 to 50 dollars a month. Elasticity differs by product and by customer group, so a blended number hides more than it shows. Result: one product, one price pair, one customer group.
- Gather past price changes and what else moved. List every time the price changed, with the week, the old and new price, and any promotion, launch or competitor move in the same window. Past changes that happened alone are the cleanest evidence you already own. Result: a table of price changes, each marked clean or confounded.
- Calculate arc elasticity for each clean change. Use the midpoint method: the change in quantity over the average quantity, divided by the change in price over the average price. Do it for each clean change and note the spread. Result: two or three elasticity estimates with their range, not one number.
- Design a price test. Split comparable customers at random, or use matched markets, and change one price only. Decide the duration and the minimum detectable change in sales before you start. Result: a written test plan with groups, price levels, duration and a stop rule.
- Run the test and read revenue and profit. Compare the quantity bought, revenue and gross profit per visitor between groups, then compute elasticity from the two price points. Check that the effect is not just buyers pulling purchases forward. Result: an elasticity for this product, with a confidence range.
- Turn the number into a price decision. If demand is inelastic at the tested price, test a higher one. If it is elastic, look for a cost or value reason before cutting further. Compare with your cost per unit to see profit, not only revenue. Result: a recommendation to raise, hold or cut, and the next price to test.
Examples
A subscription plan and an aesthetic clinic
Illustrative arithmetic, no real company implied, using the midpoint method per OpenStax. A software plan priced at 40 dollars goes to 50 and loses 100 of its 1,000 subscribers: elasticity is about -0.47 and monthly revenue rises by 5,000 dollars. A clinic raises a skin treatment from 200 dollars to 250 and loses 120 of its 400 bookings: elasticity is about -1.59 and revenue falls by 10,000 dollars. The same 25 percent price rise helps one business and hurts the other.
Wise cutting cross-border fees
Wise reported that it cut the average price of cross-border transfers to 0.61% in the fourth quarter of FY22, with volume up 40% on the year to 76.4 billion pounds. Its report credits customer growth and higher volume per customer rather than the price cuts alone, which is the point for anyone calculating elasticity: a volume jump after a price cut mixes demand response, new customers and a growing market. Pulling the price effect out needs a control or a model.
Medical care in the RAND experiment
In the RAND Health Insurance Experiment, families were randomly assigned to different levels of cost sharing. The 1987 analysis by Manning and colleagues found that a catastrophic plan cut spending by 31 percent against free care and put the price elasticity of medical care at about -0.2. Randomisation is what makes the number credible: nobody chose their own price.
When to use it
Use it before a price rise or cut, when planning a discount, when choosing between volume and margin, or when a new competitor changes what customers compare you with. It is most useful for products with enough transactions to see a response, where you can change price for some customers without changing it for all.
When not to use it
Skip a single number for products with almost no sales history, brand-new categories where nobody knows what to compare, or one-off enterprise deals priced by negotiation. There, survey methods such as Van Westendorp or conjoint analysis, or customer interviews, give better first answers than a regression on a handful of data points.
Common mistakes
- Reading a sales jump after a price cut as the elasticity, when a promotion, season or launch moved at the same time.
- Using one elasticity for every product and customer group. According to Hoch and colleagues (1995), store demographics and competition explained a large share of the variation in store-level elasticities.
- Fitting a regression on past prices without handling that managers set prices in response to demand, which biases the estimate.
- Measuring only the first weeks. According to Lin and Sacks's analysis of RAND data, sensitivity to short-lasting price changes is about twice that to long-lasting ones.
- Optimising revenue and ignoring cost. Profit depends on margin as well as volume, so the best price is rarely the revenue maximum.
FAQ
What is the formula for price elasticity of demand?
Divide the percentage change in quantity demanded by the percentage change in price. Marshall's 1890 footnote gives the case where a one percent fall in price raises sales by one percent, which is elasticity of one. Textbooks usually use the midpoint method, with percentages measured against the average of the old and new values.
What does an elasticity of 1 mean?
It means a one percent price change moves quantity by one percent in the opposite direction. This is called unit elasticity. Revenue stays the same when price changes, because the gain from the higher price is cancelled by the drop in units. Above 1 demand is elastic, and below 1 it is inelastic.
What is a typical price elasticity?
Tellis's 1988 meta-analysis of 367 estimates found an average of -1.76, and according to Bijmolt, van Heerde and Pieters (Journal of Marketing Research) the average across 1,851 elasticities was -2.62. Those are averages for brands in consumer goods, so your product can differ a lot. Fuel and medical care have far lower values.
How do you measure price elasticity in practice?
Run a price test with randomly assigned customers, use a past price change that happened alone, or fit a demand model that controls for promotions and corrects for price being set in response to demand. A randomised test is the cleanest because it removes confounding. See experimentation and incrementality testing for design.
What is the difference between own-price and cross-price elasticity?
Own-price elasticity is how demand for a product reacts to its own price. Cross-price elasticity is how demand for it reacts to a rival's or sibling product's price. According to Auer and Papies, the mean cross-price elasticity across 7,264 estimates is 0.26, with a median of 0.10, much smaller than own-price values.
Sources
- Alfred Marshall, Principles of Economics, 1890, Book III chapter IV, The Elasticity of Wants (Econlib edition)
- Alfred Marshall, Principles of Economics, 1890, Book III chapter IV (Marxists Internet Archive transcription)
- Gerard J. Tellis, The Price Elasticity of Selective Demand: A Meta-Analysis of Econometric Models of Sales, Journal of Marketing Research 25(4), 1988
- Marketing Science Institute, Tellis working paper record, The Price Elasticity of Selective Demand, 1988
- Tammo H. A. Bijmolt, Harald J. van Heerde, Rik G. M. Pieters, New Empirical Generalizations on the Determinants of Price Elasticity, Journal of Marketing Research 42(2), 2005
- Tilburg University repository, Bijmolt, van Heerde and Pieters (2005) record
- OpenStax, Principles of Economics 3e, Price Elasticity of Demand and Price Elasticity of Supply
- Abba P. Lerner, The Concept of Monopoly and the Measurement of Monopoly Power, Review of Economic Studies 1(3), 1934
- Willard G. Manning and others, Health Insurance and the Demand for Medical Care: Evidence from a Randomized Experiment, American Economic Review 77(3), 1987
- Haizhen Lin, Daniel W. Sacks, Intertemporal Substitution in Health Care Demand: Evidence from the RAND Health Insurance Experiment, NBER Working Paper 22802, 2016
- Tomas Havranek, Zuzana Irsova, Karel Janda, Demand for gasoline is more price-inelastic than commonly thought, Energy Economics 34(1), 2012 (working paper record)
- Stephen J. Hoch, Byung-Do Kim, Alan L. Montgomery, Peter E. Rossi, Determinants of Store-Level Price Elasticity, Journal of Marketing Research 32(1), 1995
- Sunil Gupta, Impact of Sales Promotions on When, What, and How Much to Buy, Journal of Marketing Research 25(4), 1988
- Julian Auer, Dominik Papies, Cross-price elasticities and their determinants: a meta-analysis and new empirical generalizations, Journal of the Academy of Marketing Science 48(3), 2020
- J. Miguel Villas-Boas, Russell S. Winer, Endogeneity in Brand Choice Models, Management Science 45(10), 1999
- Peter Cohen, Robert Hahn, Jonathan Hall, Steven Levitt, Robert Metcalfe, Using Big Data to Estimate Consumer Surplus: The Case of Uber, NBER Working Paper 22627, 2016
- Jean-Pierre Dubé, Sanjog Misra, Personalized Pricing and Consumer Welfare, NBER Working Paper 23775, 2017
- Eric T. Anderson, Duncan Simester, Effects of $9 Price Endings on Retail Sales: Evidence from Field Experiments, Quantitative Marketing and Economics 1(1), 2003
- Ron Kohavi, Diane Tang, Ya Xu, Trustworthy Online Controlled Experiments, Cambridge University Press, 2020
- Stripe, Price testing: how to find the right price to grow revenue and customer trust
- Wise plc, FY22 results for the year ended 31 March 2022
- Wise plc, Q1 FY25 results, 16 July 2024
Last updated Oct 9, 2026


Marketing agency or growth system: when a company outgrows its agency
An agency is the right call while the founder still runs most of the company. Once the business starts copying itself into new locations or markets, it needs a system that sets goals, tests hypotheses and owns the result.

Why healthcare marketing agencies stall: the short, mid and long wins model we use with clinics
Most agencies own the click and nobody owns the front desk. How we structure clinic work in three horizons, the research behind each one, and one year of results.

Why channel tests stall after month three
Most paid channel tests do not end with a decision. They end when the budget runs out, the attribution model changes, or everyone quietly stops looking at the dashboard.