MaxDiff
MaxDiff is a survey method that shows people small sets of items and asks them to pick the best and the worst in each, producing a ranked score for every item on one shared scale.
MaxDiff, or best-worst scaling, is a survey method for ranking a list of items by importance or appeal. Respondents see sets of four or five items and pick the most and least important in each set. Across a dozen sets, those choices give every item a score on one scale, without the bunching and scale-use bias of rating questions.
- Origin
- Jordan Louviere (devised at the University of Alberta); first published with Adam Finn, 1987 devised; 1992 first published
- Level
- 301 · Advanced
- Fits
- Small and mid-size, Scale-up
- Time to apply
- 1 to 2 weeks: two days to build the item list and design, a week in field, a day to analyse
- What you need
- a list of 10 to 30 items that answer one question, such as features, benefits or messages · a survey tool that supports MaxDiff designs, or an experimental design you build yourself · 150 to 300 respondents from the target segment, more if you want to compare segments
MaxDiff is a survey method that ranks a list of items by asking people, again and again, to pick the best and the worst from a small set. Its academic name is best-worst scaling. Product teams use it to choose features, marketers to pick the benefit to lead with, and health researchers to rank what patients care about. A 2019 Sawtooth Software paper reported that 73% of its customers had run a MaxDiff study in the previous 12 months.
Where MaxDiff came from
Jordan Louviere devised it in 1987 at the University of Alberta, according to his own book with Terry Flynn and Anthony Marley. The same date appears in Sawtooth’s technical paper. Nothing was printed until later. Louviere and colleagues write that BWS “was introduced by Finn & Louviere (1992)”, a study of public concern about food safety, and some papers cite a 1991 working paper instead. So both years appear in the literature: 1987 for the idea, 1992 for the first publication.
The method builds on Louis Thurstone’s paired comparisons from 1927. Anthony Marley and Louviere set out its formal choice models in the Journal of Mathematical Psychology in 2005. Its use among market researchers grew quickly after Sawtooth Software released its first MaxDiff tools in 2004.
How one MaxDiff question works
A respondent sees four or five items and makes two clicks, one for the most important and one for the least important.
Take four items, A, B, C and D. If someone picks A as best and D as worst, you now know five of the six possible pairs: A beats B, C and D, and B and C both beat D. Only B against C stays open, and another set answers it. With five items, two clicks settle seven of ten pairs, according to Sawtooth’s technical paper.
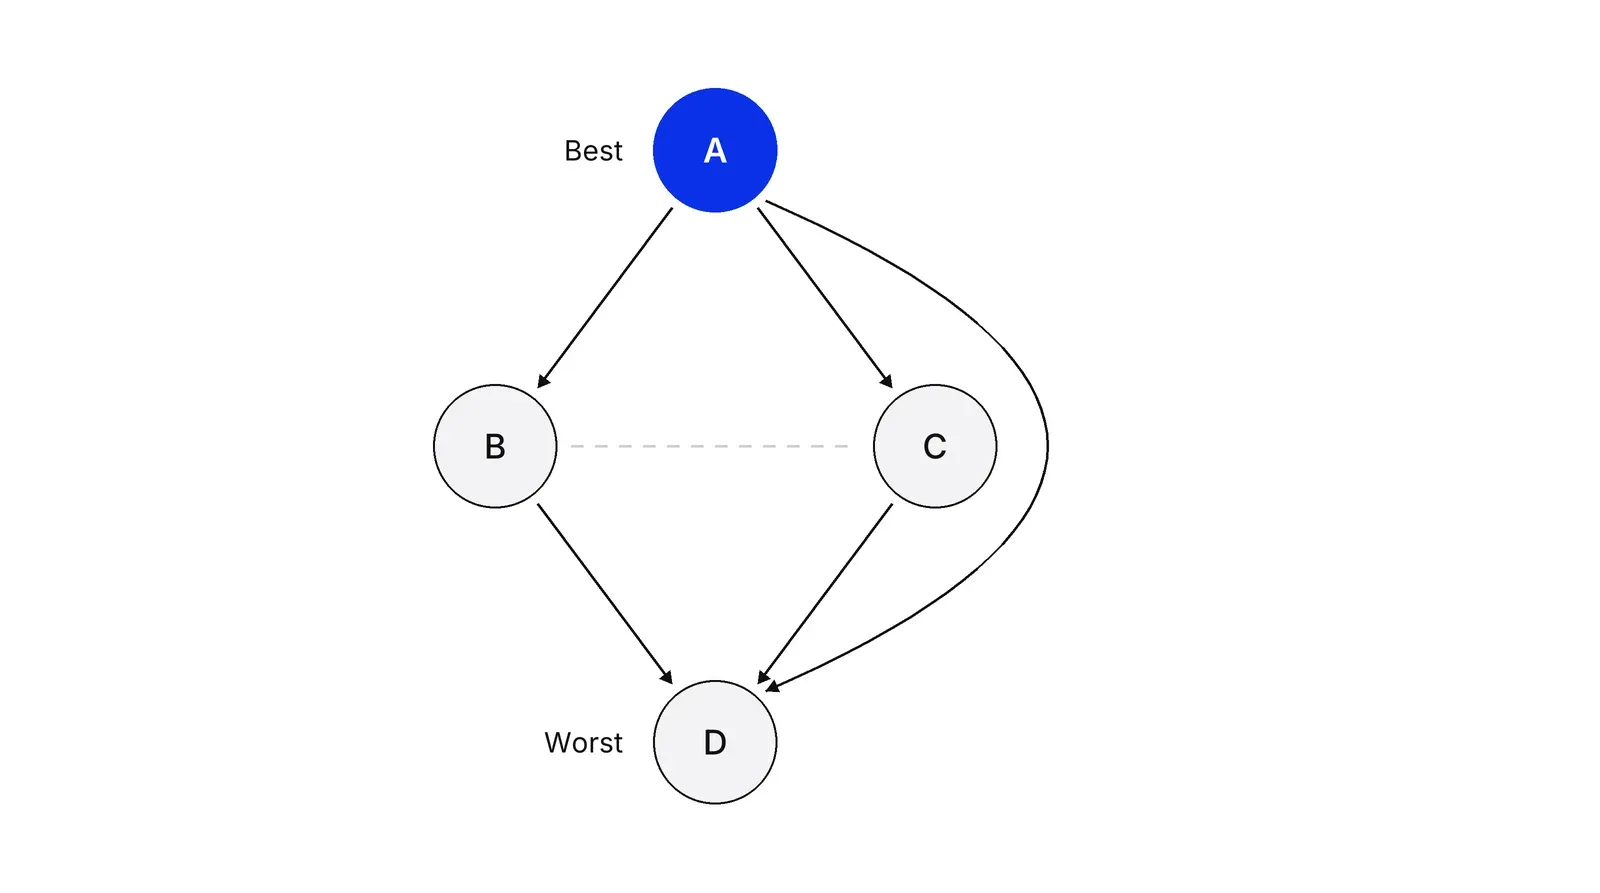
People also judge extremes more easily than the middle, so picking the best and worst of four is quicker than deciding whether an item deserves a 7 or an 8 out of 10.
Why not just ask people to rate each item?
Rating questions bunch up. Most people rate most items as important, so a list of 16 features ends up with scores between 7 and 9, and the ranking inside that band is mostly noise. People also use scales differently: some never give a 10, some give everything a 10, and habits differ by country. Sawtooth calls this scale-use bias. MaxDiff avoids it because people choose instead of scoring.
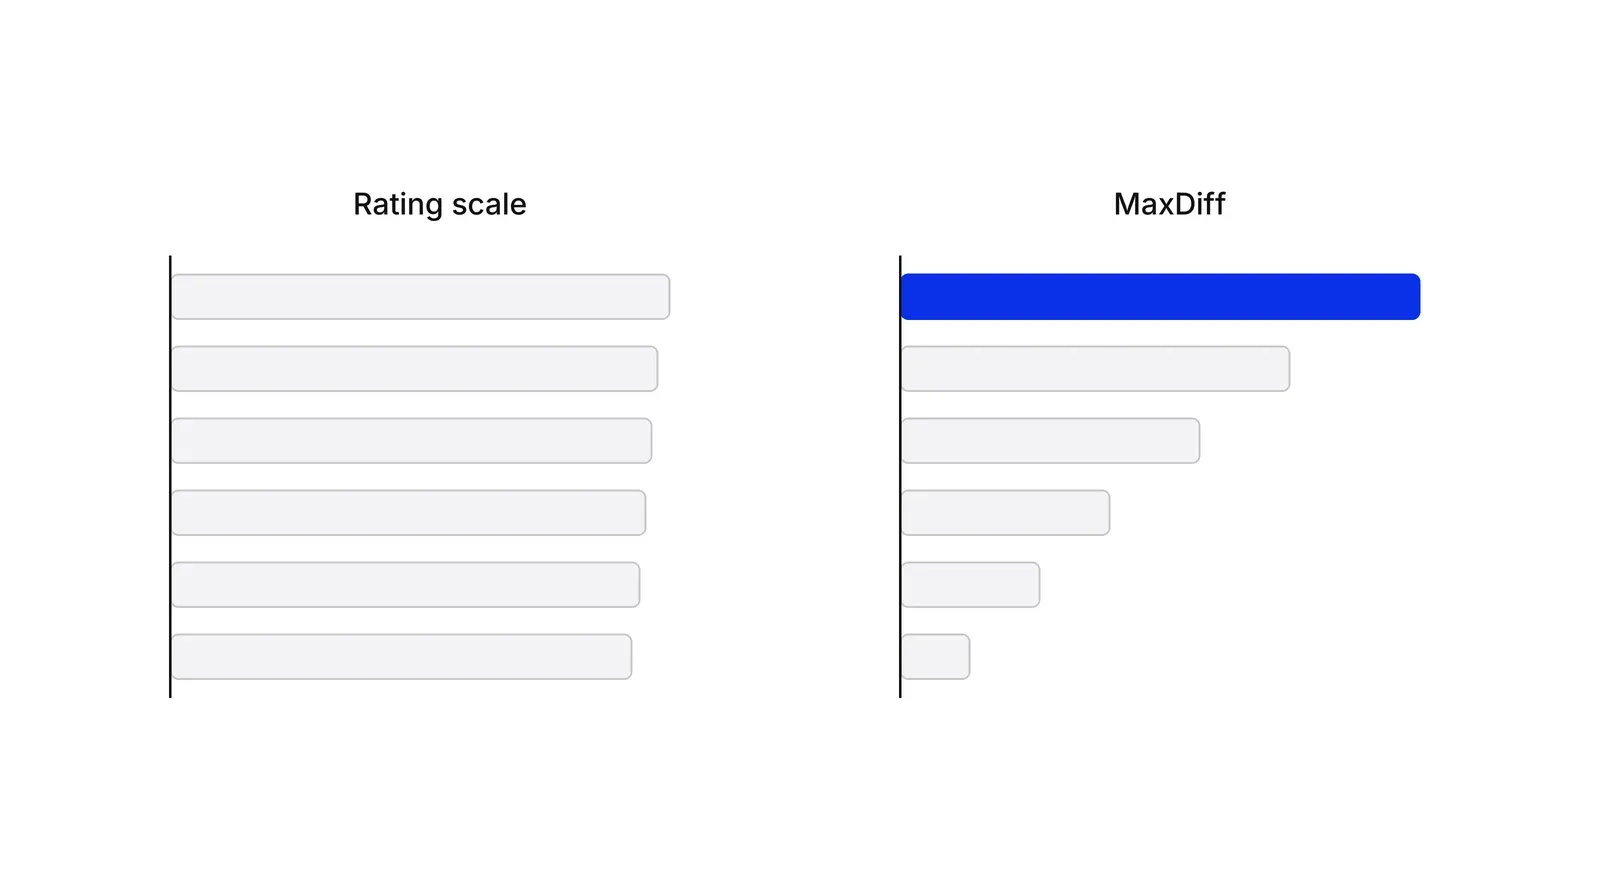
The evidence comes from head-to-head tests. Keith Chrzan and Natalia Golovashkina compared six importance measures on 1,284 respondents in 2006. MaxDiff separated the items best and predicted overall satisfaction best, with a correlation of 0.62 against 0.30 for plain ratings. In a 2017 ACL paper, Kiritchenko and Mohammad found best-worst judgments more reliable than ratings for the same number of answers.
The cost is time. Chrzan and Golovashkina found MaxDiff took the longest of the six methods, and Bryan Orme of Sawtooth puts it at about triple the time of rating questions. Sawtooth sells MaxDiff software, so weigh its claims with that in mind.
How to design a MaxDiff study
The design rests on three numbers from Sawtooth’s technical paper. Show 4 or 5 items per set: simulations found little gain beyond five for lists of up to about 30 items, and showing more than half the list at once lowers precision. Let each item appear about three times per respondent, which gives stable individual scores. The number of sets then follows: 3 × items ÷ items per set, so 20 items in sets of 5 need 12 sets.
The design should be balanced, so each item appears equally often and meets every other item about equally often. Louviere’s team uses balanced incomplete block designs for this; survey tools generate the design for you. On sample size, a 2016 review of 62 health studies found a median of 175 respondents in designs of this kind.
How to read MaxDiff scores
The quickest score is counts: times chosen best minus times chosen worst. Louviere and colleagues showed these counts line up closely with logit estimates at the sample level. For individual scores and segment cuts, use a multinomial logit or hierarchical Bayes model, then rescale so the scores add up to 100. On that scale, Sawtooth explains, an item scoring 10 is about twice as preferred as one scoring 5.
Individual scores also make MaxDiff a good input for needs-based segmentation. Sawtooth reports that latent class models on MaxDiff data find segments better than clustering on ratings.
What plain MaxDiff cannot tell you
The scores are relative. If every item matters, or none does, MaxDiff still ranks them from first to last. Anchored MaxDiff fixes this by adding a threshold. Louviere’s dual-response version asks after each set whether all, some or none of the items are important; Kevin Lattery’s direct version asks separate yes or no questions. Sawtooth’s manual warns that anchoring can bring back some of the yea-saying that plain MaxDiff removes.
Long lists need other variants. Sparse MaxDiff shows each of 40 or more items about once per person; Chrzan and Peitz found it recovers full-design scores better than the Express variant. Bandit MaxDiff shows more often the items earlier respondents liked, and Orme reports it can be 2 to 4 times more efficient at finding the top few of 50 or more items.
MaxDiff, conjoint and rating scales compared
MaxDiff is often confused with conjoint analysis, since both are choice-based and come from the same research tradition. Louviere’s “profile” and “multi-profile” cases of best-worst scaling sit close to conjoint, but the classic MaxDiff used in market research is the “object” case: a flat list of items.
| Method | What respondents judge | What you get | Use it for |
|---|---|---|---|
| Rating scale | Each item alone, on a 1 to 10 scale | Scores that often bunch together | Quick checks, tracking over time |
| MaxDiff | Small sets of items, best and worst | Ranked scores on one shared scale | Prioritizing features, benefits, messages |
| Conjoint analysis | Whole product profiles with attributes and price | Trade-offs, willingness to pay, share simulations | Pricing and packaging decisions |
A common sequence is to use MaxDiff to cut 30 candidate features to the 6 that matter, then test those 6 with price in a conjoint study. In our Growth Lab work a MaxDiff winner becomes a hypothesis, such as leading the pricing page with the top benefit, and a live test checks it.
How to apply MaxDiff, step by step
- Write one question and the item list. Decide what the scores must answer, such as which benefits to lead with on the pricing page. Write every item at the same level of detail, in the customer's words, and keep each item to one idea. Result: a list of 10 to 30 items that all answer the same question.
- Set the design numbers. Show 4 or 5 items per set, never more than half the list. Choose enough sets that each item appears about three times per person: sets = 3 × items ÷ items per set. For 16 items in sets of 4, that is 12 sets. Result: a balanced design where each item appears equally often and meets every other item.
- Pilot with ten people. Watch a few people take the survey. Look for items they read as identical, items nobody understands, and a 'most' and 'least' wording that feels odd for the question. Result: a fixed list and question wording before the full launch.
- Field the survey. Send it to the target segment and add two or three profile questions you will want to cut by, such as role, plan or region. Result: a clean data set with enough people per segment you plan to compare.
- Estimate and rescale the scores. Start with best-minus-worst counts for a quick read, then run a logit or hierarchical Bayes model and rescale to shares that add up to 100. Result: one score per item, for the whole sample and for each segment.
- Turn scores into a decision. Take the top items into the roadmap, the headline or the offer, and drop or deprioritize the bottom ones. If you need to know whether low items matter at all, rerun with an anchored design. Result: a ranked list someone owns and acts on.
Examples
A fintech app choosing what to build next
Illustrative. A payments app has 16 feature requests and budget for three. It shows 250 small-business customers 12 sets of 4 features each, so every feature appears three times per person. Bulk payouts and same-day settlement come out far ahead with shares of 18 and 15 out of 100, while a dark mode request scores 2. Rating questions in last year's survey had put all 16 between 7 and 9 out of 10. The team builds the top two, and the scores also show that freelancers rank invoice reminders much higher than agencies do.
A clinic picking the message for its ads
Illustrative. A private dental clinic tests 10 reasons patients might choose it, such as evening hours, fixed prices, a named dentist and parking. With sets of 4 and each reason shown three times, each respondent answers 8 sets (3 × 10 ÷ 4 = 7.5, rounded up). Fixed prices and evening hours win among new patients. The clinic leads its ads with those two and moves the parking line to the contact page.
When to use it
Use it when you have a list of 10 or more comparable items and must decide which matter most: features for a roadmap, benefits for a landing page, claims for packaging, needs for a segmentation. It works best when rating questions have produced flat results where every item scored high, or when you compare groups that use rating scales differently, such as several countries.
When not to use it
Skip it when you need to know how much people would pay or how they trade a price against a feature; that is a job for conjoint analysis. Skip it for fewer than about six items, where a simple ranking question works. Do not use plain MaxDiff to learn whether any item matters in absolute terms, because the scores are relative; use anchored MaxDiff for that.
Common mistakes
- Mixing levels in the list, such as 'fast support' next to 'a chat reply within 2 minutes'. Respondents compare unlike things and the scores stop meaning anything. Write items at one level.
- Showing too many items per set. Sawtooth's simulations found gains stop after about five, and showing more than half the list per set lowers precision for the middle items.
- Too few sets per person. If each item appears once, individual scores are noisy; aim for three appearances per item per respondent, or use a sparse design and read results only at the sample level.
- Reading low scores as 'unimportant'. A bottom item may still matter a lot; MaxDiff only says it matters less than the others. Add an anchor question if the absolute line matters.
- Treating counts as the final answer for individuals. Louviere and colleagues warn that best-minus-worst counts can fail to separate middle items for one person; use a model for individual scores.
FAQ
What is the difference between MaxDiff and conjoint analysis?
MaxDiff ranks a list of separate items, such as features or messages, on one scale. Conjoint analysis shows whole product profiles built from attributes and levels, including price, and estimates how people trade one against another. Use MaxDiff to shortlist what matters, then conjoint to price and package the shortlist.
How many respondents do you need for a MaxDiff study?
There is no fixed rule. A 2016 review of 62 health studies found a median of 175 respondents in object-case designs, and you need more if you plan to compare segments. With hundreds of items, Sawtooth's simulations needed about 1,000 people to find the top items in a 300-item bandit study.
How many items should each MaxDiff question show?
Four or five. Sawtooth Software's technical paper reports little gain in precision beyond five items per set for studies of up to about 30 items, and recommends never showing more than half the full list in one set. With an anchored dual-response design, keep it to four.
Is MaxDiff better than a rating scale?
For separating items, yes. In a 1,284-person study, Chrzan and Golovashkina found MaxDiff gave the best discrimination and the highest predictive validity of six importance measures, while ratings did worst. The cost is time: Bryan Orme of Sawtooth estimates MaxDiff takes about three times as long as rating questions.
What do MaxDiff scores mean?
After a logit or hierarchical Bayes model, scores are usually rescaled into shares that add up to 100 across items. They are ratio-scaled, so an item scoring 10 is about twice as preferred as an item scoring 5. They show relative standing only, not whether an item clears an absolute bar.
Sources
- Sawtooth Software, The MaxDiff System Technical Paper, Version 9, 2020
- Jordan J. Louviere, Terry N. Flynn, A.A.J. Marley, Best-Worst Scaling: Theory, Methods and Applications, Cambridge University Press, 2015
- Louviere, Flynn, Marley, Best-Worst Scaling, chapter 1: Introduction and overview of the book, Cambridge University Press, 2015
- Jordan Louviere, Ian Lings, Towhidul Islam, Siegfried Gudergan, Terry Flynn, An introduction to the application of (case 1) best-worst scaling in marketing research, International Journal of Research in Marketing 30(3), 2013
- A.A.J. Marley, J.J. Louviere, Some probabilistic models of best, worst, and best-worst choices, Journal of Mathematical Psychology 49(6), 2005
- Terry N. Flynn, Jordan J. Louviere, Tim J. Peters, Joanna Coast, Best-worst scaling: what it can do for health care research and how to do it, Journal of Health Economics 26(1), 2007
- Axel C. Mühlbacher, Peter Zweifel, Anika Kaczynski, F. Reed Johnson, Experimental measurement of preferences in health care using best-worst scaling: theoretical and statistical issues, Health Economics Review 6, 2016
- Kei Long Cheung and colleagues, Using best-worst scaling to investigate preferences in health care, PharmacoEconomics 34(12), 2016
- Ilene L. Hollin and colleagues, Best-worst scaling and the prioritization of objects in health: a systematic review, PharmacoEconomics 40(9), 2022
- Keith Chrzan, Natalia Golovashkina, An empirical test of six stated importance measures, International Journal of Market Research 48(6), 2006
- Svetlana Kiritchenko, Saif M. Mohammad, Best-Worst Scaling More Reliable than Rating Scales: A Case Study on Sentiment Intensity Annotation, ACL 2017
- Bryan Orme, How good is best-worst scaling?, Quirk's, July 2018
- Sawtooth Software, Lighthouse Studio manual: What is MaxDiff?
- Sawtooth Software, Lighthouse Studio manual: Anchored MaxDiff
- Bryan Orme, Anchored Scaling in MaxDiff Using Dual Response, Sawtooth Software, 2009
- Kevin Lattery, Anchoring Maximum Difference Scaling Against a Threshold: Dual Response and Direct Binary Responses, Sawtooth Software, 2011
- Bryan Orme, Sparse, Express, Bandit, Relevant Items, Tournament, Augmented, and Anchored MaxDiff, Sawtooth Software, 2019
- Bryan Orme, Bandit MaxDiff: When to Use It and Why It Can Be a Better Choice than Standard MaxDiff, Sawtooth Software, 2018
- Sawtooth Software knowledge base, Sample size for Bandit MaxDiff studies
- Bryan Orme, Adaptive Maximum Difference Scaling, Sawtooth Software, 2006
- Keith Chrzan, Megan Peitz, Best-Worst Scaling with many items, Journal of Choice Modelling 30, 2019
- Julie Anne Lee, Geoffrey Soutar, Jordan Louviere, Measuring values using best-worst scaling: the LOV example, Psychology & Marketing 24(12), 2007
Last updated Oct 9, 2026


Marketing agency or growth system: when a company outgrows its agency
An agency is the right call while the founder still runs most of the company. Once the business starts copying itself into new locations or markets, it needs a system that sets goals, tests hypotheses and owns the result.

Why healthcare marketing agencies stall: the short, mid and long wins model we use with clinics
Most agencies own the click and nobody owns the front desk. How we structure clinic work in three horizons, the research behind each one, and one year of results.

Why channel tests stall after month three
Most paid channel tests do not end with a decision. They end when the budget runs out, the attribution model changes, or everyone quietly stops looking at the dashboard.