Product life cycle
The product life cycle describes how sales of a product category move through development, growth, maturity and decline, so a team can plan its marketing for the stage it is in and the one coming next.
The product life cycle is a model that splits a product category's sales history into four stages: development, growth, maturity and decline. Theodore Levitt made it a planning tool in a 1965 Harvard Business Review article, arguing that companies should prepare growth and extension moves before sales flatten. Critics showed the curve is often shaped by those same marketing decisions.
- Origin
- Theodore Levitt (popularised the planning use); earlier authors used the idea before him, 1965
- Level
- 201 · Tool
- Fits
- Small and mid-size, Scale-up, Enterprise
- Time to apply
- two to three hours for a first read of one product line, then a check at each annual plan
- What you need
- monthly or quarterly sales for the category and your product, at least three years back where they exist · the number of competitors entering and leaving the category over the same period · a rough estimate of how many likely buyers already own or use the product
The product life cycle is a model of how sales of a product category change over time: slow at launch, then fast growth, then a plateau, then decline. Marketers use it to decide what to spend on, and what to stop, as a product ages. Theodore Levitt turned it into a management tool in his 1965 Harvard Business Review article, “Exploit the Product Life Cycle.” Levitt treated the idea as already known: his first sentence says senior marketing executives were familiar with the concept, and his complaint was that almost none of them used it to plan.
What are the four stages?
Levitt named four stages: market development, market growth, market maturity and market decline. Most textbooks now call the first one introduction.
In development, the product is new, demand is unproven and sales creep along. Price matters here more than at any later point; Joel Dean’s HBR article on new-product pricing ties the right launch price to the product’s economic evolution. In growth, demand accelerates, the total market expands fast and competitors pile in. In maturity, demand levels off and grows mostly with replacement purchases and new households. In decline, the product loses appeal and sales slide. Levitt’s examples were buggy whips, which lost to cars, and silk, which lost to nylon.
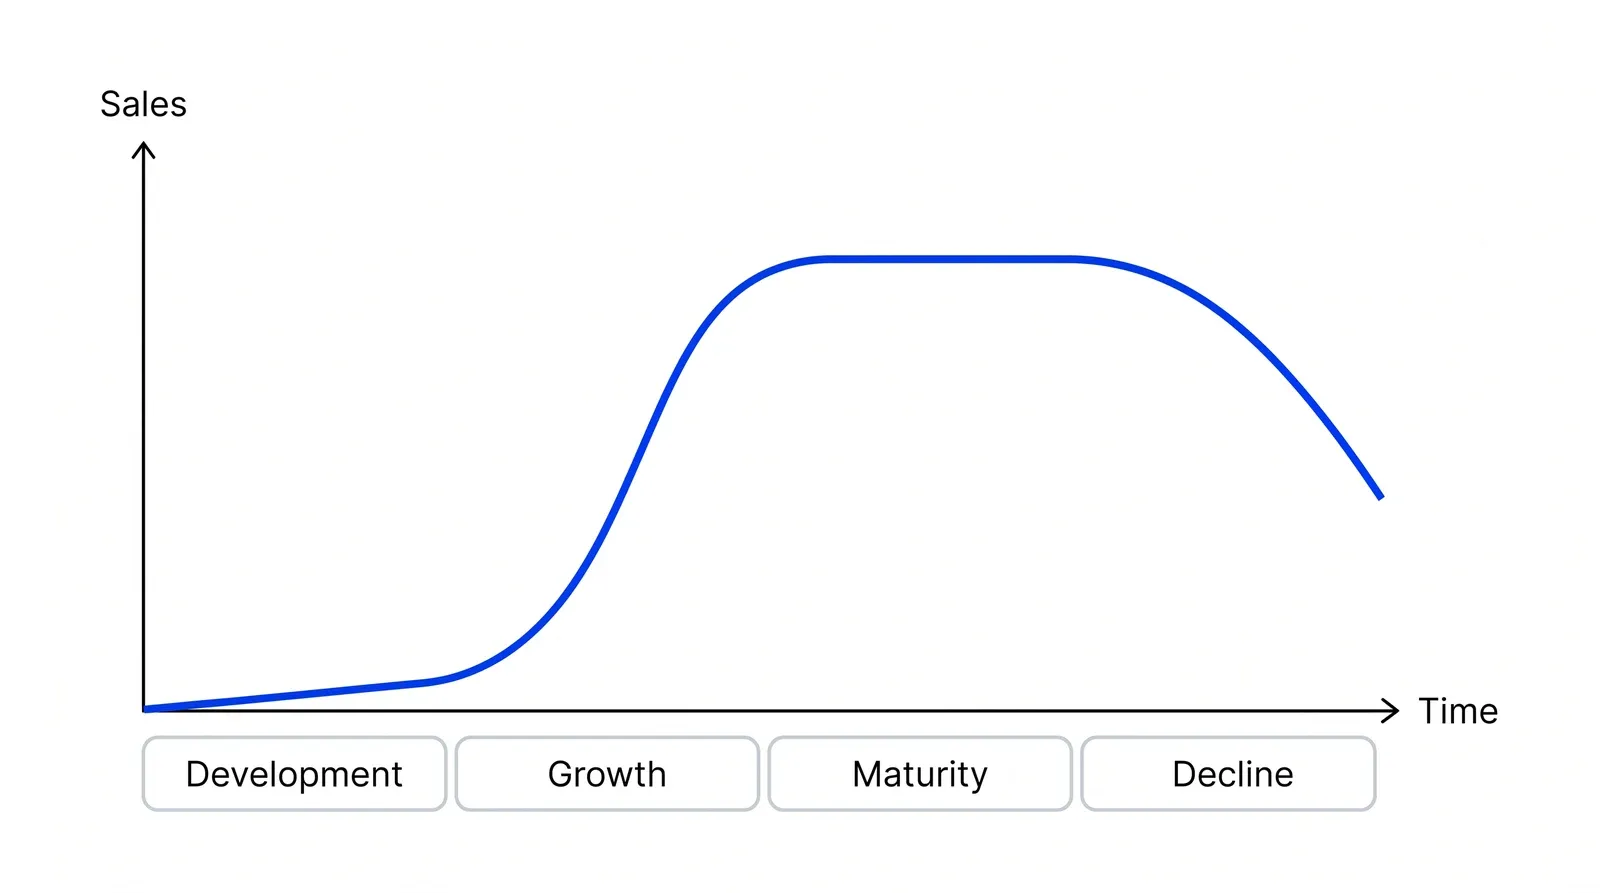
| Stage | Sales | Competitors | Main marketing job |
|---|---|---|---|
| Development | Low, slow | Few | Prove demand, set launch price |
| Growth | Rising fast | Many entering | Win distribution and share |
| Maturity | Flat | Shakeout, consolidation | Defend share, find new uses and users |
| Decline | Falling | Leaving | Lead, hold a niche, harvest or exit |
What does the data say about timing?
The curve is real for many categories, and researchers have measured its turning points. For really new consumer durables introduced after the Second World War, Peter Golder and Gerard Tellis found that sales took off about six years after launch, when price had fallen to about 63% of the launch price and only about 1.7% of households owned the product. Before the war, takeoff took about 18 years.
Growth then lasts longer than most planners assume. In a later study of 30 categories, the same authors found growth of about 45% a year for about eight years, followed by a slowdown at about 34% household penetration in which sales dropped about 15% and stayed below the old peak for about five years. Products with the biggest jump at takeoff had the biggest drop at slowdown.
Price is one trigger among several. Rajshree Agarwal and Barry Bayus studied about 150 years of US innovations and concluded that new firm entry, which brings better products, explains takeoff timing better than falling prices. Steven Klepper’s model of industry evolution adds the other end: as a category matures, firms shift from product to process innovation, and the number of competitors shrinks.
One popular belief does not hold up well. Bayus tested whether product lives are getting shorter using desktop PCs from 1974 to 1992 and found that model and technology lifetimes had not shortened, even in that fast-moving industry.
How do you stretch maturity?
Levitt’s practical advice was to plan the next growth move while sales are still rising. A 1981 paper by A. J. Faria and R. O. Nulsen summarises his four avenues: more frequent use among present users, more varied use among present users, new users, and new uses for the basic product.
Nylon is the classic case. Jordan Yale’s work on synthetic fibres showed that nylon kept growing because it kept entering new markets; without them it would have matured years earlier.
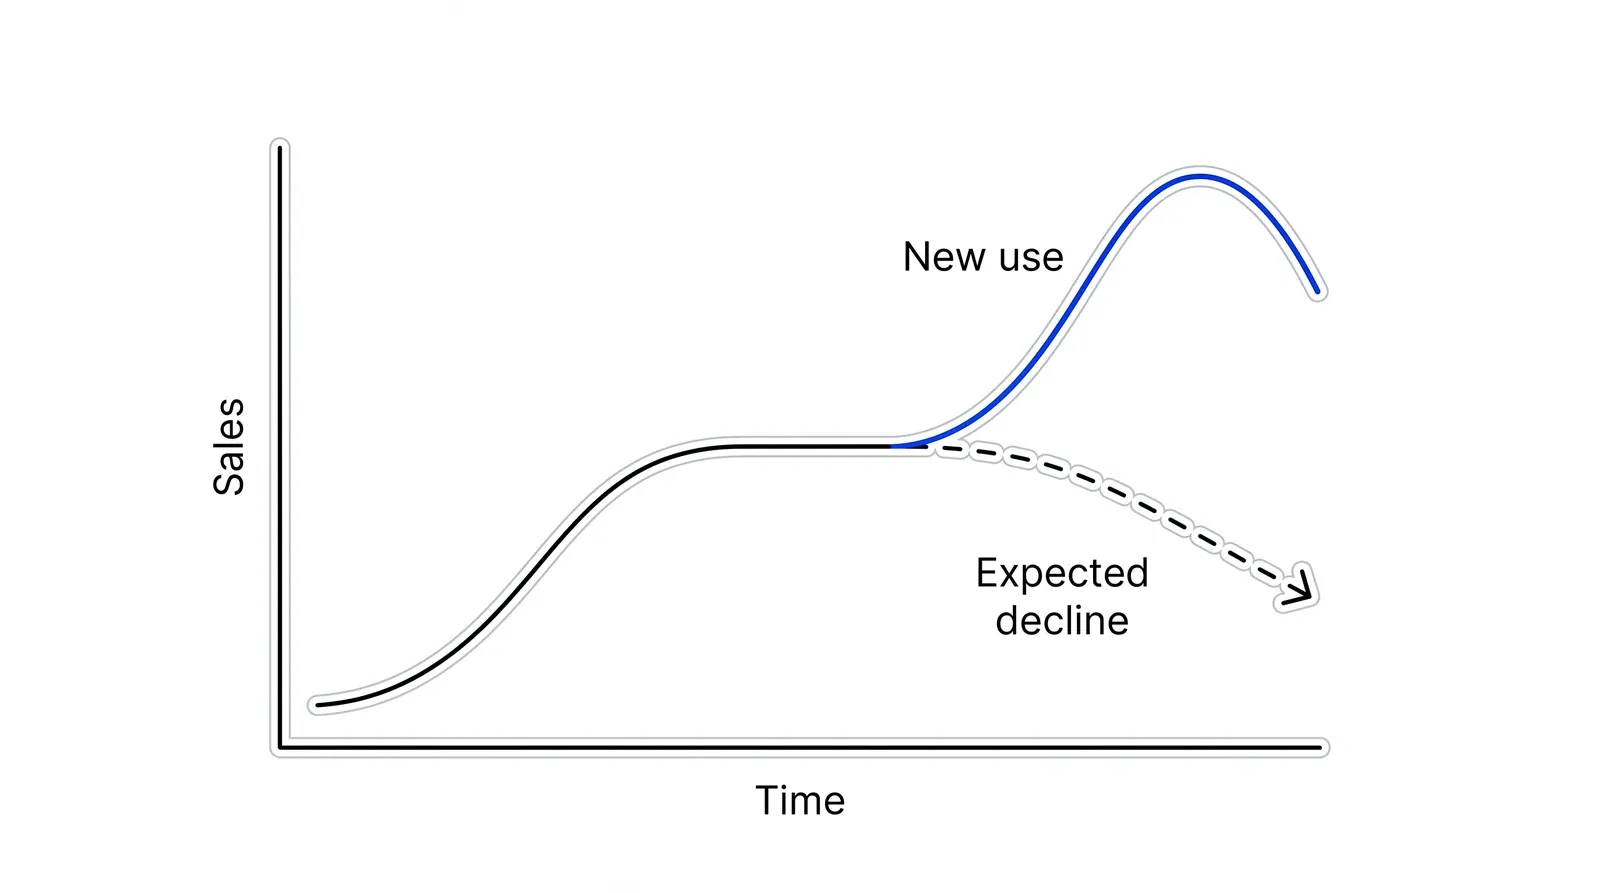
Youngme Moon of Harvard Business School added a fifth route in 2005: change which category customers put the product in. Her three positioning moves were reverse positioning (JetBlue dropping meals but adding leather seats), breakaway positioning (Swatch selling watches as fashion accessories) and stealth positioning (Sony presenting a household robot as a pet).
What do you do in decline?
Decline still leaves choices. Kathryn Harrigan and Michael Porter studied more than 95 companies in shrinking industries and described four end-game strategies: leadership, a defensible niche, harvesting cash, and selling quickly while the business still has value. Their advice is to study the competitive conditions of the end game first, then pick the strategy that fits the company’s own position.
Why critics say to forget it
The sharpest attack came in 1976. Nariman Dhalla and Sonia Yuspeh argued in HBR that the model’s accuracy and empirical basis are questionable, that it has little validity for brands, and that each product needs its own information system. Their article opens with a floor-wax brand whose sales had flattened: management cut it to fund a new product instead of reviving it. The danger is circular. A team that believes a product is mature cuts its support, sales fall, and the decline seems to confirm the label.
Later work added weight. A 1984 review by S. V. Nathan concluded that the concept falls short of being a theory and would need testable predictions for specific products, markets and periods to become one. A study of about 1,100 businesses in the PIMS database by Raymond-Alain Thietart and Roland Vivas found that winning strategies depend on the stage and also on whether a business is chasing share or cash.
The practical answer is to treat the stage as a hypothesis that sales, penetration and competitor data have to confirm.
Product life cycle and the BCG matrix
The two are often taught together, and they answer different questions.
| Product life cycle | BCG growth-share matrix | |
|---|---|---|
| Unit | One product category over time | Several businesses at one moment |
| Main input | Sales history | Market growth and relative share |
| Question | What should we do at this stage? | Which business funds which? |
The BCG growth-share matrix uses a related idea: a business in a fast-growing market is usually in an early stage of its category’s life cycle, and one in a slow market is usually in maturity or decline. Once the stage is clear, the Ansoff matrix helps choose whether the next move is a new market or a new product. Reading stages for a whole portfolio and turning them into quarterly bets is the kind of work done in Pushers’ Growth Lab.
How to apply Product life cycle, step by step
- Define the category you are tracking. Decide whether you are reading the life cycle of a product class (payment cards), a product form (contactless cards) or a brand. They follow different curves, and critics found the model weakest for brands. Result: one sentence naming the level you are analysing.
- Plot sales and growth rate over time. Chart category sales and their year-on-year growth. Accelerating growth points to the growth stage; growth falling toward the rate of replacement purchases points to maturity; falling sales for several periods point to decline. Result: a provisional stage, written down with the evidence.
- Check penetration and competitor count. Estimate what share of likely buyers already use the product and whether rivals are still entering or starting to leave. Many new entrants usually mean growth; consolidation means maturity or decline. Result: a confirmed or corrected stage.
- Ask whether your own actions caused the curve. Before calling a product mature, list what changed in price, promotion, distribution and product in the same period. A flat line after two years of cut budgets may simply reflect those cuts. Result: a list of what you have and have not tried.
- Choose the plays for this stage and the next. Growth calls for distribution and share; maturity calls for more frequent use, new uses and new users; decline calls for a deliberate choice between leading, holding a niche, harvesting or exiting. Result: two or three moves for this stage and one prepared for the next.
- Set a review date and a trigger. Pick the indicator that would tell you the stage has changed, such as growth below a set rate for two quarters, and the date you will look again. Result: a trigger and a calendar entry.
Examples
Jell-O and Scotch tape in Levitt's article
Levitt used General Foods' Jell-O and 3M's Scotch tape to show how maturity can be pushed back. Jell-O went from six flavours to more than twelve, was promoted as a salad base and for weight control, and a flavourless version was sold for strengthening fingernails. 3M sold tape in easier dispensers, added coloured and patterned gift tape, a cheaper line and double-coated tape.
A clinic's teeth-whitening service
Illustrative. A dental clinic launched whitening five years ago. Bookings grew about 40% a year for three years, then 5%, then 2%, while four nearby clinics started offering the same service. Before cutting the budget, the clinic checks its own record: it stopped reminding past patients two years ago. It tests a six-month touch-up reminder, more frequent use among present users, before treating the service as mature.
A fintech's prepaid card
Illustrative. A prepaid card for teenagers grew fast while few banks offered one. Now most large banks do, and sign-ups are flat. The team reads this as maturity, keeps the card, cuts acquisition spend, and moves product effort toward a new use: parents paying pocket money on a schedule, which brings back activity from existing accounts.
When to use it
Use it in annual planning for a product line with a few years of sales history, when you need to decide whether to keep investing for growth, defend a mature position or plan an exit, and when you want to prepare the next growth move before sales flatten.
When not to use it
Skip it for a product with less than a year or two of data, where the curve cannot be read yet, and do not use it as a forecast of when a brand will decline. Do not let it overrule direct evidence: if a product still responds to price, promotion or a new use, the stage label is the weaker signal.
Common mistakes
- Calling a product mature because sales flattened, when the flat line followed cuts in marketing spend or distribution, which turns the forecast into a self-fulfilling one.
- Reading the life cycle of a brand as if it were the life cycle of its category, so a brand losing share in a growing market gets written off as old.
- Assuming all life cycles are getting shorter and planning for a fast decline that the evidence for many categories does not show.
- Waiting for decline before looking for new uses or new users, when Levitt's advice was to plan those moves during growth.
- Treating decline as a single decision to exit, instead of choosing between leadership, a niche, harvesting and a quick sale.
FAQ
What are the stages of the product life cycle?
The usual four stages are introduction, growth, maturity and decline. Levitt called the first one market development, when a product is new and sales creep along slowly. Some textbooks add a separate development stage before launch, which makes five. The model describes a product category's sales over time, not the life of one brand.
Who created the product life cycle concept?
Theodore Levitt is usually credited because of his 1965 Harvard Business Review article, Exploit the Product Life Cycle. His own opening line says senior marketing executives were already familiar with the concept, so he popularised it as a planning tool rather than inventing it. Sources disagree on who described it first.
What happens in the growth stage of the product life cycle?
In the growth stage, demand accelerates and many competitors enter. Golder and Tellis found that new consumer durables grew about 45% a year for roughly eight years after takeoff. Marketing shifts from explaining the product to winning distribution and share against a growing number of rivals.
How do you extend the product life cycle?
Levitt listed four ways: get present users to use the product more often, get them to use it in more varied ways, find new users, and find new uses for the basic product. Youngme Moon later added repositioning, changing which category customers place the product in, as a way to move a mature product back toward growth.
What is the main criticism of the product life cycle?
In 1976, Nariman Dhalla and Sonia Yuspeh argued in Harvard Business Review that the model has weak empirical support and little validity for brands. The shape of the curve often follows from marketing decisions, so treating it as a law can lead managers to abandon products that could still grow.
Sources
- Theodore Levitt, Exploit the Product Life Cycle, Harvard Business Review, 1965
- Nariman Dhalla, Sonia Yuspeh, Forget the Product Life Cycle Concept!, Harvard Business Review, 1976
- Harvard Business Review Store, Forget the Product Life Cycle Concept, article summary
- Youngme Moon, Break Free from the Product Life Cycle, Harvard Business Review, 2005
- Harvard Business Review Store, Break Free from the Product Life Cycle, OnPoint edition summary
- HBS Working Knowledge, When Other Companies Compete Like Crazy, Dare to Be Different (Youngme Moon)
- Kathryn Rudie Harrigan, Michael Porter, End-Game Strategies for Declining Industries, Harvard Business Review, 1983
- Robert Hayes, Steven Wheelwright, Link Manufacturing Process and Product Life Cycles, Harvard Business Review, 1979
- Peter Golder, Gerard Tellis, Growing, Growing, Gone: Cascades, Diffusion, and Turning Points in the Product Life Cycle, Marketing Science, 2004
- Peter Golder, Gerard Tellis, Will It Ever Fly? Modeling the Takeoff of Really New Consumer Durables, Marketing Science, 1997
- Rajshree Agarwal, Barry Bayus, The Market Evolution and Sales Takeoff of Product Innovations, Management Science, 2002
- Frank Bass, A New Product Growth Model for Consumer Durables, Management Science, 1969
- Steven Klepper, Entry, Exit, Growth, and Innovation over the Product Life Cycle, American Economic Review, 1996
- Raymond Vernon, International Investment and International Trade in the Product Cycle, Quarterly Journal of Economics, 1966
- Raymond-Alain Thietart, Roland Vivas, An Empirical Investigation of Success Strategies for Businesses Along the Product Life Cycle, Management Science, 1984
- Marta Muñiz Ferrer, Utilidad del ciclo de vida del producto, Revista ICADE, 2008
- S. V. Nathan, PLC: State-of-the-art Review, IIM Ahmedabad Working Paper, 1984
- Barry Bayus, An Analysis of Product Lifetimes in a Technologically Dynamic Industry, Management Science, 1998
- A. J. Faria, R. O. Nulsen, Extending the Simulation Product Life Cycle, Developments in Business Simulation and Experiential Exercises, 1981
- Joel Dean, Pricing Policies for New Products, Harvard Business Review
- Jordan Yale, Product Life-Cycle Extension: The Polyester Staple Experience, Academy of Marketing Science Conference, 1982
- James Utterback, William Abernathy, A Dynamic Model of Process and Product Innovation, Omega, 1975
- Rolando Polli, Victor Cook, Validity of the Product Life Cycle, Journal of Business, 1969
Last updated Oct 9, 2026


Marketing agency or growth system: when a company outgrows its agency
An agency is the right call while the founder still runs most of the company. Once the business starts copying itself into new locations or markets, it needs a system that sets goals, tests hypotheses and owns the result.

Why healthcare marketing agencies stall: the short, mid and long wins model we use with clinics
Most agencies own the click and nobody owns the front desk. How we structure clinic work in three horizons, the research behind each one, and one year of results.

Why channel tests stall after month three
Most paid channel tests do not end with a decision. They end when the budget runs out, the attribution model changes, or everyone quietly stops looking at the dashboard.