Fogg behavior model
The Fogg behavior model says a person acts only when motivation, ability and a prompt come together at the same moment, so a missed conversion has three possible causes you can check one by one.
The Fogg behavior model, written B=MAP, says a behavior happens only when three things meet at the same moment: enough motivation, enough ability, and a prompt. If someone does not act, at least one is missing. BJ Fogg introduced it at Persuasive 2009. Teams use it to find which of the three to fix first, usually ability.
- Origin
- BJ Fogg, Stanford Behavior Design Lab, 2009
- Level
- 201 · Tool
- Fits
- Startup, Small and mid-size, Scale-up
- Time to apply
- 60 minutes to diagnose one funnel step, then a test cycle
- What you need
- one specific behavior, such as booking a visit or finishing sign-up · funnel data for that step, plus a screen recording or a user walk-through · one person who can change the page or the message
The Fogg behavior model is a way of explaining why people do or do not take an action. BJ Fogg, who directs the Behavior Design Lab at Stanford, set it out in “A Behavior Model for Persuasive Design”, presented at the Persuasive conference in Claremont, California, from 26 to 29 April 2009 (the fourth International Conference on Persuasive Technology). He had written the earlier book Persuasive Technology in 2003, and the model is aimed at the designers of such products. He now writes it as B=MAP: a behavior happens when motivation, ability and a prompt meet at the same moment. If a person does not act, Fogg’s site says, at least one of the three is missing.
The value for a marketer is the order of questions it gives you. When a page, form or message underperforms, you can ask whether people were prompted, whether the step was easy enough, and whether they wanted it enough, instead of guessing. It sits alongside conversion rate optimization as a diagnostic: CRO says to test, and this model suggests what to test first.
What does the model say about why people act?
People act when they sit above a curve called the action line and a prompt arrives. The chart has ability on the horizontal axis, from hard to easy, and motivation on the vertical axis. Stanford’s lab describes the two as having a “compensatory relationship”: when motivation is very high, ability can be low, and the reverse.
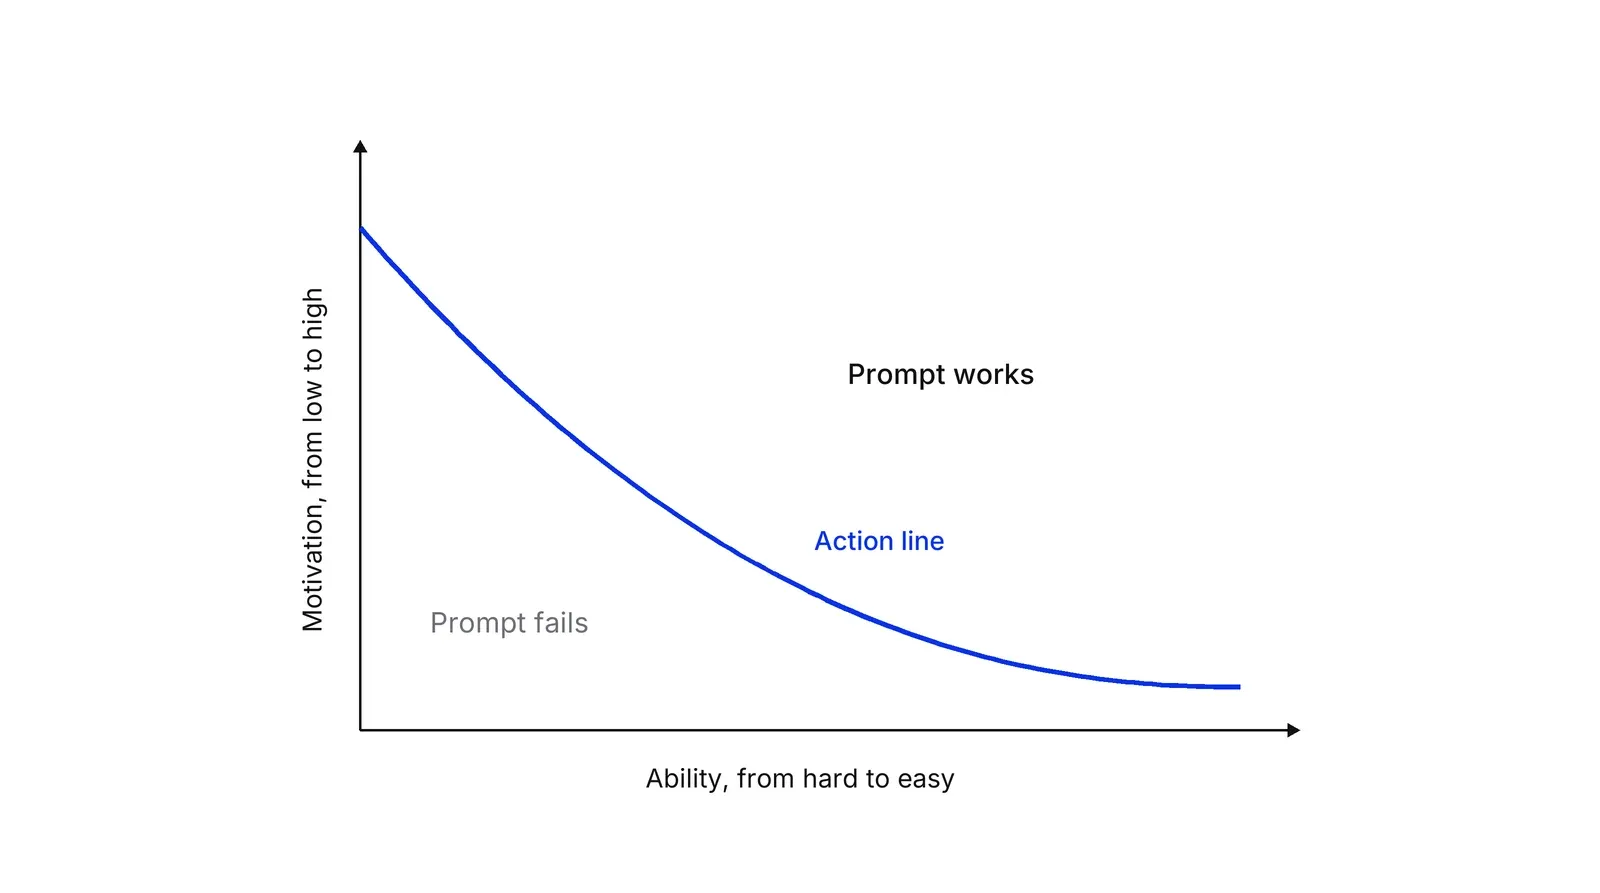
Two practical consequences follow. A prompt cannot rescue a behavior that sits below the line, so adding more reminders to a hard step wastes effort. And moving a behavior to the right, by making it easier, lifts it over the line without asking anyone to want it more.
Motivation comes in waves
Motivation is what a person wants right now, and it changes by the hour. Fogg names three core motivators, each with two sides: sensation (pleasure and pain), anticipation (hope and fear) and belonging (acceptance and rejection). He also describes a “motivation wave”: when motivation is high people will do hard things, and when it drops they will only do easy ones, according to the motivation page.
For a funnel this means the best moment to ask is the moment interest peaks, such as right after someone reads a result or sees a price. Belonging is the lever behind social proof, and the wider set of levers in Cialdini’s principles of persuasion can each be read as a way to raise one of the three motivators.
Ability means making the step simple
Ability, in Fogg’s definition, is simplicity, and simplicity depends on a person’s scarcest resource at that moment. His examples are time and money: a task that takes 10 minutes is not simple for someone with five. The ability page offers three ways to raise it: train people, give them a tool, or scale the behavior back. Fogg favors the last, and it is the idea behind his Tiny Habits method. Habits take longer than a moment: in a 12-week study by Lally and colleagues, the time to reach 95 percent of peak automaticity ranged from 18 to 254 days.
This matches what interface researchers call interaction cost, the sum of mental and physical effort a user spends to reach a goal, as Nielsen Norman Group defines it. The UK Behavioural Insights Team makes the same point in EAST (Easy, Attractive, Social, Timely), quoting Richard Thaler: “If you want people to do something, make it easy.” It reports that changing UK workplace pensions from opt-in to opt-out lifted private-sector coverage from 42 percent to 85 percent, a change that removed effort without changing the product (BIT). An earlier study of 401(k) plans by Madrian and Shea found participation significantly higher under automatic enrollment.
Prompts: spark, facilitator and signal
A prompt is the cue that tells someone to act now. Fogg called it a trigger until late 2017, his site notes, and older articles use that word for the same thing. There are three types, and the choice depends on which factor is weak (Wang and Kang, 2022).
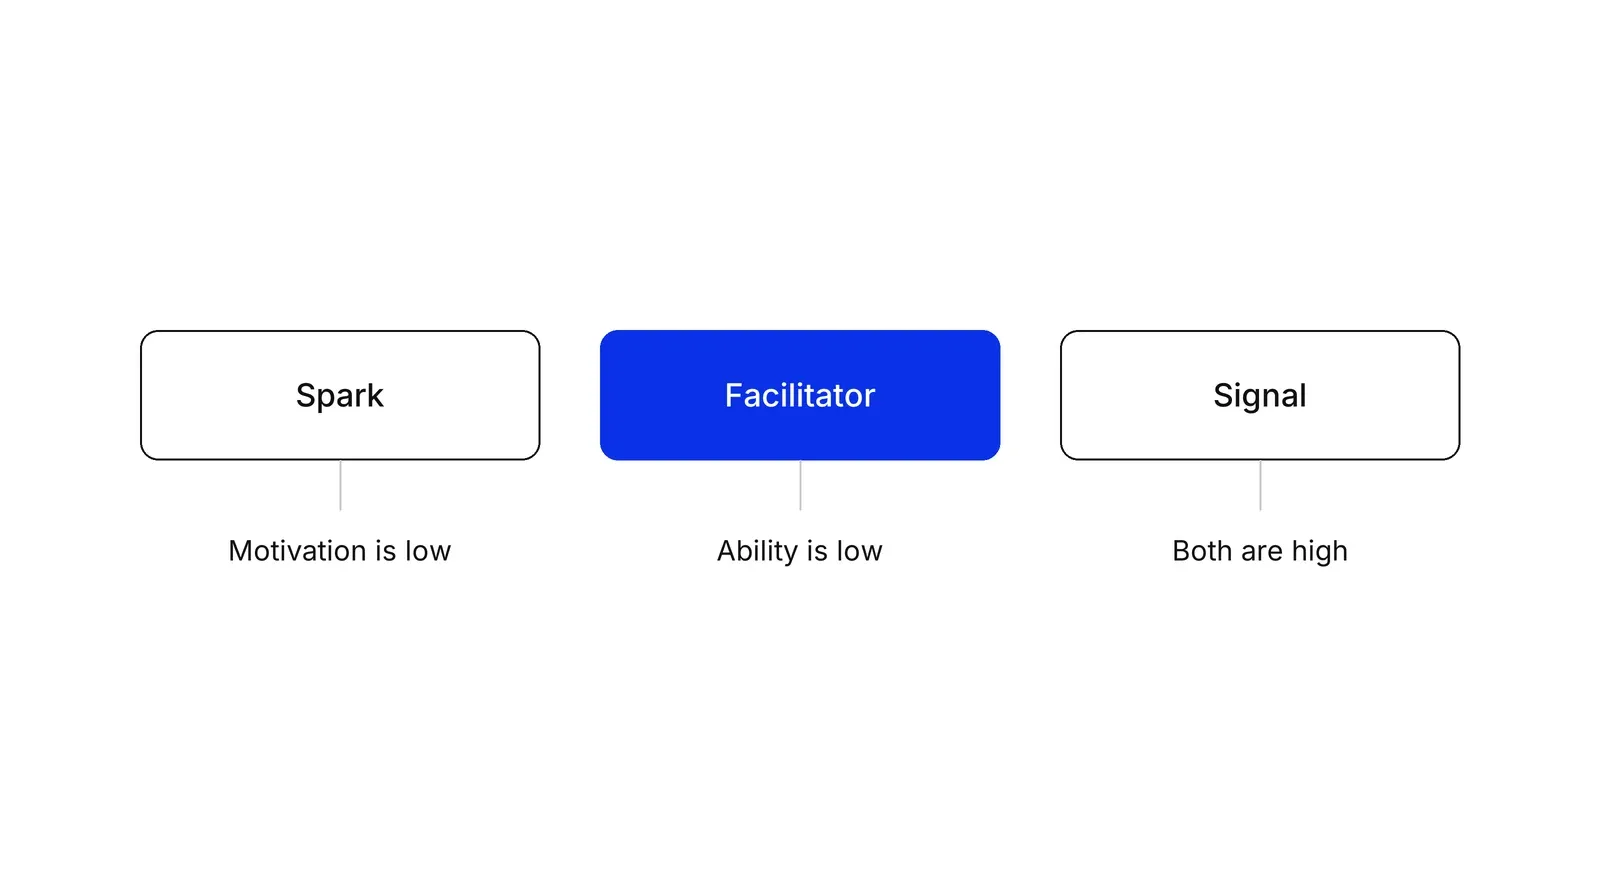
A spark adds motivation for someone who can do the task but does not want to. A facilitator makes the task easier for someone who wants it but finds it hard; Fogg’s example is a prominent button on Facebook. A signal is a plain reminder for someone who is already motivated and able, like a calendar alert.
Timing matters as much as type. Research on just-in-time adaptive interventions in health, reviewed by Nahum-Shani and colleagues, is built on giving support at the moment a person’s state makes it useful, though the authors note that many such tools were developed with little empirical evidence.
Classify the behavior before you diagnose it
Not every behavior is the same kind of problem. According to Stanford’s Behavior Design Lab, Fogg’s 2009 paper “The Behavior Grid: 35 Ways Behavior Can Change” sorted behaviors into 35 types, and the lab now recommends a newer grid of 15. Buying a book online and quitting smoking call for different techniques, so decide which kind of behavior you are asking for before you pick a fix.
How strong is the evidence?
The model is widely used and thinly tested. A 2025 scoping review in BMC Public Health searched MEDLINE/PubMed, the Cochrane Library, Epistemonikos and PsycINFO for studies that applied the model in health interventions and found six. They covered vaccination, chronic disease management and gestational weight management, among other areas. One reported gestational diabetes in 10.34 percent of the intervention group against 34.48 percent of controls (p = 0.028), and an HPV vaccination study raised intent to vaccinate to between 63.3 and 96.7 percent. Effectiveness varied across the six, and the authors say the model “remains underutilized” in public health research. A 2022 questionnaire study by Wang and Kang cut 18 draft items to 14 and found three prompt factors (signal, facilitator, spark) in survey answers from students at one Chinese university, which supports the typology as a way to describe prompts, not as a test of the action line.
Read the model, then, as a structured set of hypotheses. Where a prompt is a real intervention, the results can be large: in a field experiment by Milkman and colleagues in 2011, employees at a large firm received a mailing about free on-site flu clinics. Those asked to write down a date and time for their shot were vaccinated 4.2 percentage points more often than the 33.1 percent control group, while a date-only prompt added 1.5 points, not statistically significant. Test your own version before you rebuild a funnel on it.
How does it compare with COM-B?
COM-B is the closest alternative. Michie, van Stralen and West built it after reviewing nineteen existing frameworks for changing behavior, and the two models answer slightly different questions.
| Fogg behavior model | COM-B | |
|---|---|---|
| Authors and year | BJ Fogg, 2009 | Michie, van Stralen and West, 2011 |
| Parts | Motivation, ability, prompt | Capability, opportunity, motivation |
| Where prompts sit | A separate third factor | Inside opportunity, the outside factors that make behavior possible “or prompt it” |
| Built for | Designers of products and messages | Health interventions and policy, with nine intervention functions and seven policy categories |
| Best use | Diagnosing one step in a flow | Planning a wider programme |
If you are tuning a single screen or message, the Fogg model is faster. If you are designing a programme across many touchpoints, COM-B gives you more structure (Michie and colleagues). A Growth Lab plan starts from the one behavior in the funnel that is failing, and this model is a quick way to say why (see how we work).
How to apply Fogg behavior model, step by step
- Name one target behavior. Write the single action you want, in a form you can count: 'completes identity check', 'books a first appointment'. The model works on one behavior at a time, so a vague goal such as 'engage more' cannot be diagnosed. Result: one sentence and one metric.
- Check that a prompt exists at the right moment. List every cue that asks for the action: the button, the email, the text message, the reminder. A person with plenty of motivation and ability still does nothing when no prompt reaches them. Result: a list of prompts with the time and place each one appears.
- Find the scarcest resource. Walk the step as a new user. Count taps, fields, minutes, and decisions, and note what costs money, effort or social risk. Fogg's test is the person's scarcest resource at that moment, such as time. Result: the one thing that makes the step hard.
- Judge motivation at that moment. Ask what the person wants right then and whether it will still be there in an hour. Motivation rises and falls, so a request made at a peak asks for less setup than one made at a low. Result: a note on whether motivation is high, low or fading.
- Fix the weakest link, ability first. Make the step easier before you add persuasion: fewer fields, a default, a smaller first ask. Where motivation is the gap, add a reason. Where only a reminder is missing, send a signal. Result: one change tied to one factor.
- Test it and re-read the result. Run the change as an A/B test or a staged rollout and compare completion of the target behavior. Check whether the gain came from the factor you changed. Result: a verdict that feeds the next diagnosis.
Examples
A clinic reminding patients to book a vaccination
Documented. [Dai and colleagues](https://doi.org/10.1038/s41586-021-03843-2) ran two randomized trials of text reminders in a US health system, with 93,354 and 67,092 patients. The reminders made vaccination salient and easy to act on. The first reminder, sent one day after patients were told they were eligible, raised booked appointments by 6.07 percentage points (84 percent) and vaccinations by 3.57 points (26 percent). The second, sent eight days later, raised them by 1.06 points. In Fogg's terms the reminder is a prompt, and the easy booking path is the ability fix that makes the prompt land.
A neobank onboarding flow
Illustrative, with arithmetic only. Suppose 1,000 people start sign-up and 400 finish the identity check. Users want the account (motivation is high), but the check asks for a passport photo, a selfie and an address proof in one long screen (ability is low). The fix is a facilitator: split the check into three short steps, let users save progress, and send a reminder when a step is left open. Motivation is unchanged; the action line is now easier to clear.
An online store checkout
Documented. Baymard's list of cart abandonment studies puts the average rate at 70.22 percent across 50 studies. In its survey of US shoppers, 18 percent left because the site wanted them to create an account and 17 percent because checkout was too long or complicated. Respondents could give several reasons, and 40 percent named extra costs such as shipping, tax and fees. Account creation and length are ability problems: they add effort at the moment of highest intent. Guest checkout and fewer fields remove them without touching the offer.
When to use it
Use it when you can see people reaching a step and stopping: a form, a booking page, a first-use screen, a reminder flow. It gives you a fast three-way diagnosis before you commission research or redesign anything. It also helps a team agree on what kind of problem they have, which changes what they build.
When not to use it
Skip it when the question is which product or price to offer, or why someone chooses a competitor; use a customer-needs method such as jobs to be done. It is also a poor guide for long-term habit change on its own, because it describes one moment, not months of repetition. Treat its output as a hypothesis to test, not as proof.
Common mistakes
- Adding persuasion when the step is hard. Scarcity banners and testimonials raise motivation, but a person who cannot finish the form in the time they have will not finish it. Fix ability first.
- Treating motivation as a fixed level. Fogg describes waves, so a prompt sent when interest has faded asks for a lot. Time the request to the peak.
- Sending prompts nobody can act on. A reminder to do a hard task below the action line only adds annoyance.
- Bundling several behaviors into one prompt. Ask for one small action, then the next, as the behaviormodel.org prompt page advises.
- Reading the model as settled science. The 2025 scoping review found only six health studies applying it, and results varied. Run a test before you rebuild a funnel on it.
FAQ
What is the Fogg behavior model?
It is a model of why people do or do not act, created by BJ Fogg at Stanford. A behavior happens when motivation, ability and a prompt occur together. If one is missing, nothing happens. Teams use it to decide whether to raise motivation, simplify the step, or add a prompt.
What does B=MAP stand for?
B=MAP means behavior equals motivation, ability and prompt. The letters are not a calculation: they say all three must be present at the same moment. Fogg called the third part a trigger until late 2017, so older articles use that word.
What is the action line in the Fogg model?
The action line is the curve on the model's chart that separates behaviors that happen from those that do not. Easy behaviors sit above it with little motivation, and hard ones need a lot. It also shows the trade: high motivation can make up for low ability.
What is the difference between a trigger and a prompt?
They are the same element. Fogg called it a trigger until late 2017 and now calls it a prompt. The three types are unchanged: a spark adds motivation, a facilitator makes the behavior easier, and a signal simply reminds someone who is already motivated and able.
How is the Fogg model different from COM-B?
COM-B, from [Michie and colleagues](https://pmc.ncbi.nlm.nih.gov/articles/PMC3096582/) in 2011, names capability, opportunity and motivation and sits at the centre of a larger health-policy toolkit. The Fogg model is shorter and aimed at designers. Its distinct part is the prompt, which COM-B folds into opportunity.
Sources
- BJ Fogg, A behavior model for persuasive design, Persuasive 2009 (ACM)
- BJ Fogg, Persuasive Technology: Using Computers to Change What We Think and Do (Elsevier, 2003)
- BJ Fogg, Fogg Behavior Model, behaviormodel.org, Stanford Behavior Design Lab
- BJ Fogg, Motivation page, behaviormodel.org (core motivators and the 2012 Motivation Wave)
- BJ Fogg, Ability page, behaviormodel.org (simplicity and the scarcest resource)
- BJ Fogg, Prompts page, behaviormodel.org (renamed from Trigger in 2017)
- Stanford Behavior Design Lab, Fogg Behavior Model
- Stanford Behavior Design Lab, Fogg Behavior Grid (35 types in 2009, 15 now)
- Stanford Behavior Design Lab, Behavior Wizard (2009 or 2010)
- BJ Fogg, Tiny Habits
- Michie, van Stralen and West, The behaviour change wheel, Implementation Science, 2011
- Wang and Kang, Development of a Physical Activity Triggers Questionnaire, Healthcare, 2022
- Duarte-Anselmi and colleagues, Behavioral science meets public health: a scoping review of the Fogg Behavior Model, BMC Public Health, 2025
- Milkman and colleagues, Using implementation intentions prompts to enhance influenza vaccination rates, PNAS, 2011
- Dai and colleagues, Behavioural nudges increase COVID-19 vaccinations, Nature, 2021
- Nahum-Shani and colleagues, Just-in-time adaptive interventions in mobile health, Annals of Behavioral Medicine, 2018
- Lally, van Jaarsveld, Potts and Wardle, How are habits formed, European Journal of Social Psychology, 2010
- Brigitte Madrian and Dennis Shea, The Power of Suggestion, NBER Working Paper 7682 (2000), Quarterly Journal of Economics (2001)
- Baymard Institute, Cart Abandonment Rate Statistics (50 studies, 70.22% average)
- Nielsen Norman Group, Raluca Budiu, Interaction Cost (2013, reviewed 2024)
- Behavioural Insights Team, EAST: Four Simple Ways to Apply Behavioural Insights (2014, updated 2024)
Last updated Oct 9, 2026


Marketing agency or growth system: when a company outgrows its agency
An agency is the right call while the founder still runs most of the company. Once the business starts copying itself into new locations or markets, it needs a system that sets goals, tests hypotheses and owns the result.

Why healthcare marketing agencies stall: the short, mid and long wins model we use with clinics
Most agencies own the click and nobody owns the front desk. How we structure clinic work in three horizons, the research behind each one, and one year of results.

Why channel tests stall after month three
Most paid channel tests do not end with a decision. They end when the budget runs out, the attribution model changes, or everyone quietly stops looking at the dashboard.