ICE scoring
ICE scoring rates each growth idea on impact, confidence and ease, so a team can decide in minutes which experiment to run first.
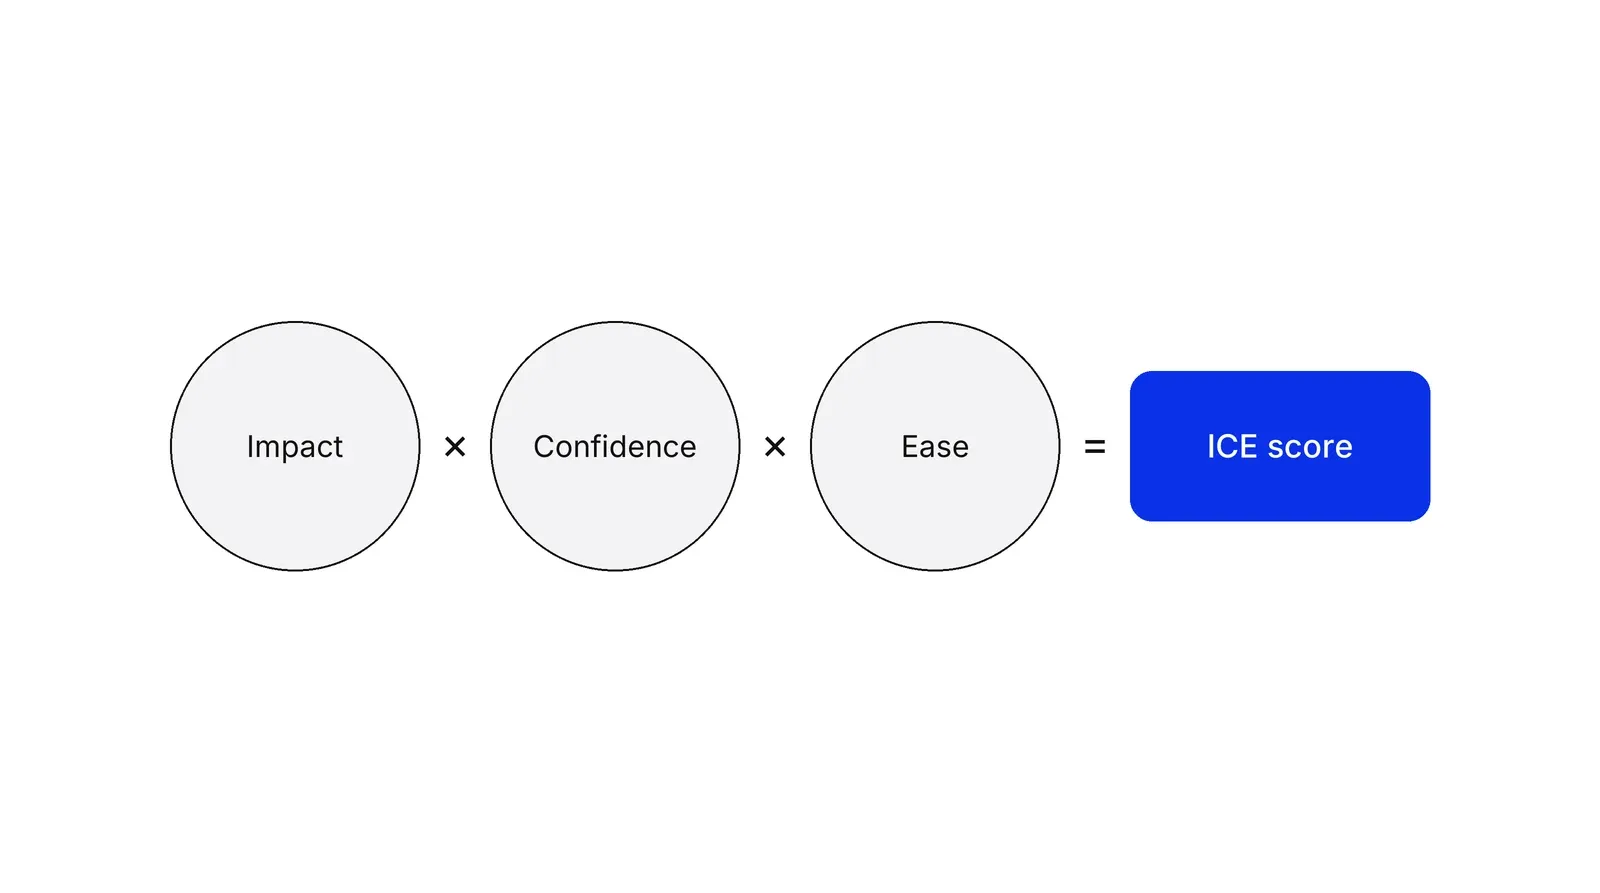
ICE scoring is a prioritization method that rates each idea from 1 to 10 on three questions: how much it will move the goal metric (impact), how sure the team is of that estimate (confidence) and how little work it needs (ease). The ratings are combined into one score that ranks a backlog of experiments. It is credited to Sean Ellis of GrowthHackers.
- Origin
- Sean Ellis (credited); Itamar Gilad (Confidence Meter), 2010s, no dated original found; Confidence Meter, 2018
- Level
- 201 · Tool
- Fits
- Startup, Small and mid-size, Scale-up
- Time to apply
- about an hour for a first backlog of 20 to 30 ideas, then a few minutes for each new idea
- What you need
- one goal metric the whole backlog is scored against · a written list of ideas, each phrased as a testable change · an engineer or operator who can estimate effort · whatever evidence you already have: analytics, interviews, past test results
ICE scoring is a way to rank a list of ideas by asking three questions about each one. How much will it move the goal metric if it works? How sure are we of that? How much work does it take? Each answer becomes a rating, usually from 1 to 10, and the ratings combine into one score. The team tests the highest-scoring ideas first.
The method comes from growth marketing. Itamar Gilad, a former Google product lead, credits Sean Ellis with inventing it to rank growth experiments, and Lenny’s Newsletter does the same. Ellis coined the term growth hacking and co-wrote Hacking Growth with Morgan Brown in 2017, a book built around rapid-tempo testing. We could not find a dated original post from GrowthHackers that defines ICE, so the year it first appeared is not documented. Today it shows up in public places such as GitLab’s experiment template and Atlassian’s Jira guides.
What do impact, confidence and ease mean?
Impact is how much one idea would move the goal metric if it works. Confidence is how much evidence supports that impact estimate. Ease is the inverse of effort: a change that one person ships in a day scores high, a quarter-long project scores low. Gilad describes all three as relative ratings, and each team decides what the numbers mean, as long as the meaning stays the same over time.
The scale only works when it is anchored. Take a clinic that wants more booked first appointments per week. Impact 10 could mean “plausibly adds 20% more bookings”, impact 5 “adds around 5%”, impact 1 “barely noticeable”. Ease 10 could mean “under a day of work”, ease 1 “more than a month”. Without anchors like these, two people can give the same idea a 3 and an 8 and both be honest.
Multiply or average?
Teams do both, and the choice changes the ranking. Gilad multiplies the three ratings, and so does Atlassian’s automation rule for Jira. GitLab’s template sets the score to the average of the three; one of its experiment issues rated 7, 8 and 9 and recorded a score of 8.
| Idea | Impact | Confidence | Ease | Average | Product |
|---|---|---|---|---|---|
| A | 9 | 9 | 1 | 6.3 | 81 |
| B | 5 | 5 | 5 | 5.0 | 125 |
The average puts idea A first. The product puts idea B first, because one very low rating drags the whole score down. Multiplication suits a team that wants to avoid ideas with one serious weakness, such as a big win that would take six months. Averaging is gentler and easier to explain. Either is defensible if the team uses one consistently.
Why confidence is the hard part
Most ideas do not work, and the people who propose them are poor judges of which ones will. Ron Kohavi and colleagues reported that at Microsoft only about a third of ideas improved the metrics they were designed to improve. In a 2017 Harvard Business Review article, Kohavi and Stefan Thomke put the share of experiments with positive results at Google and Bing at only about 10% to 20%.
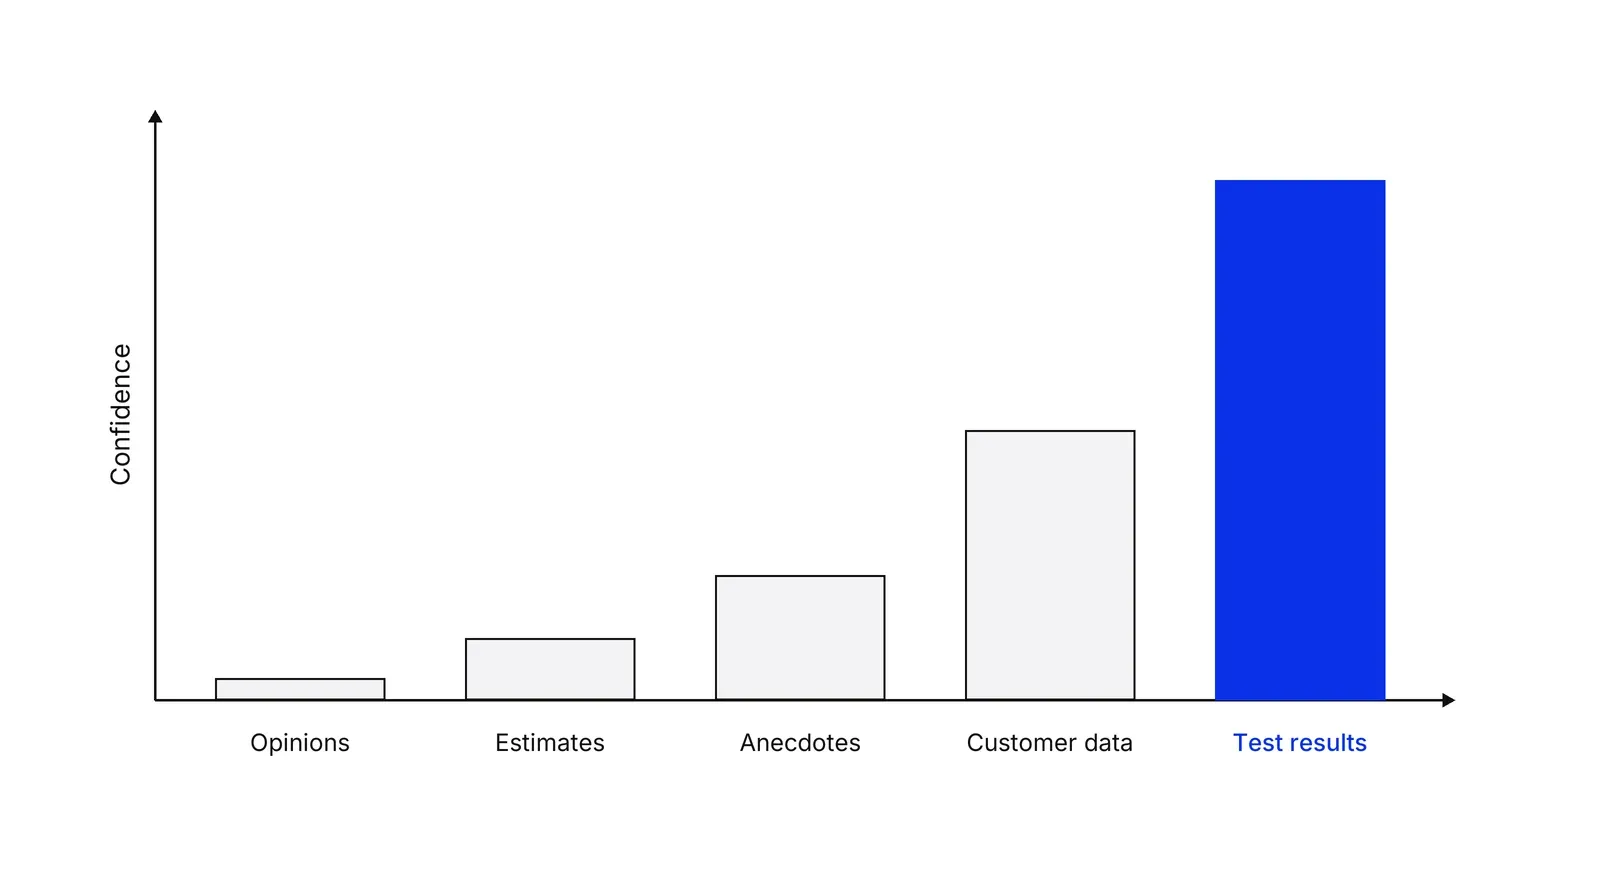
A confidence rating that comes from the proposer’s gut will therefore be too high for most ideas. Gilad’s answer is the Confidence Meter, a 0 to 10 scale where the score depends on the type of evidence. Self-conviction, a pitch deck, alignment with strategy and other people’s opinions sit near zero. Estimates and plans, then anecdotal evidence such as a few sales requests, come next. Market data and direct customer evidence such as interviews and an MVP score in the middle. Test results and launch data score highest.
This also deals with noise between scorers. Daniel Kahneman and co-authors showed in Harvard Business Review that professionals following the same rules can reach very different judgments on the same case. Tying confidence to a fixed list of evidence types narrows that spread.
Why ease is usually rated too high
People underestimate how long their own work will take. In a study published in 1994, Roger Buehler and colleagues asked students to predict when they would finish their theses. The average prediction was 33.9 days; the average actual time was 55.5 days. In a sample of 1,471 IT projects, Bent Flyvbjerg and Alexander Budzier found that one in six overran its budget by about 200% on average.
Two habits help. Have the person who will do the work rate ease, as GitLab’s template requires of engineering. And rate ease in bands of days, not on a feeling of “simple” or “hard”.
ICE compared with RICE, PIE and WSJF
ICE is the lightest of the common scoring methods. The others add a factor or change one.
| Method | Factors | Best for |
|---|---|---|
| ICE | Impact, confidence, ease, each 1 to 10 | Fast ranking of small growth tests |
| RICE | Reach × impact × confidence ÷ effort | Product features that reach very different numbers of users |
| PIE | Potential, importance, ease | Choosing which pages of a site to test first |
| WSJF | Cost of delay ÷ job size | Larger work items where timing matters |
RICE scoring, which Sean McBride published at Intercom in 2016, scores reach as a count of people per period and confidence as 100%, 80% or 50%, with effort in person-months. Chris Goward’s PIE ranks pages by how much room they have to improve, how valuable their traffic is and how easy they are to test. The Scaled Agile Framework’s WSJF divides cost of delay by job size. If the hard question is what fits before a fixed deadline, MoSCoW prioritization answers it better than any score.
Where ICE fits in a growth process
ICE sets the order of tests, and a testing cycle has to surround it. In a HADI loop it sits between the hypothesis and the action: the team writes hypotheses, scores them, runs the top few, and feeds the results back into the confidence column. Rescoring after every cycle, instead of once per quarter, is what keeps the ranking honest, and it is the rhythm Growth Lab works in.
How to apply ICE scoring, step by step
- Fix the goal metric and the scales. Choose the one metric the ideas compete to move, such as activated accounts per week. Then write what 1, 5 and 10 mean for each letter: impact against that metric, ease in rough person-days. Result: a one-page scoring key that makes a 7 mean the same thing next month.
- Write each idea as a test. Turn every idea into a change, an expected effect and a way to measure it. 'Better onboarding' cannot be scored; 'cut the sign-up form from nine fields to four to raise completion' can. Result: a backlog of ideas that are specific enough to rate.
- Score impact and ease separately, then compare. Each person scores alone before any discussion, and the person closest to the work scores ease. GitLab's experiment template asks engineering to fill in the ease column for the same reason. Result: a set of independent ratings, with the large disagreements flagged for a short conversation.
- Set confidence from evidence, not mood. Ask what supports the impact estimate. A hunch, a slide or a manager's view earns almost nothing; customer data and test results earn most of the scale. Itamar Gilad's Confidence Meter gives a ready-made ladder. Result: a confidence number the team can defend by pointing at evidence.
- Combine, rank and pick the top few. Multiply the three ratings, or average them, and sort the backlog. Pick one method and keep it, because the two can order the same ideas differently. Result: a ranked list and a decision on the next two or three tests.
- Rescore after every result. When a test finishes, update the confidence of related ideas and drop the ones the result disproved. Result: a backlog that gets more accurate each cycle instead of a ranking frozen on day one.
Examples
GitLab's experiment template
GitLab runs its product experiments in public issues, and its Experiment Idea template includes an ICE table with the score set to the average of the three ratings. Engineering is asked to fill in ease, and an issue carries an 'ICE Score Needed' label until all three values are in. One 2022 issue proposed moving the Pages menu entry from Settings to the deployment menu, scored 7 for impact, 8 for confidence and 9 for ease, for an average of 8. The test compared page opens between two groups of the same size.
Bing's under-rated headline idea
Ron Kohavi and Stefan Thomke describe in Harvard Business Review a 2012 proposal by a Bing employee to change the way ad headlines were displayed. It needed a few days of engineering, but program managers judged it a low priority and it waited more than six months. When an engineer finally tested it, revenue rose 12%, worth more than $100 million a year in the US. In ICE terms the ease was obvious and the impact was badly underestimated, which is the argument for cheap tests on easy ideas.
A payments app scoring three ideas
Illustrative, no real company. A cross-border payments app scores three ideas on a 1 to 10 scale and uses Gilad's evidence ladder for confidence. Instant payouts to cards: impact 8, ease 3, evidence is two sales requests, so confidence 1, score 24. Showing the full fee before the amount is entered: impact 5, ease 8, evidence is 20 user interviews and a usability test, so confidence 3, score 120. A bigger referral bonus: impact 6, ease 9, evidence is the team's opinion, so confidence 0.2, score about 11. The fee change goes first.
When to use it
Use ICE when a growth or product team has more ideas than it can test and needs a fast, shared way to pick the next few. It fits weekly or fortnightly testing cycles, early-stage companies without the data for a fuller model, and any backlog where ideas are small enough that a wrong pick costs days, not quarters.
When not to use it
Skip it for large, expensive bets such as a new market, a platform rebuild or a regulated launch, where a three-number score hides too much. Use a business case, cost of delay or a fuller model instead. It is also a poor fit when ideas reach very different numbers of users; RICE handles that by scoring reach on its own.
Common mistakes
- Letting the person who proposed an idea score its confidence alone, which turns confidence into a measure of enthusiasm.
- Changing what the numbers mean from one month to the next, so old and new scores cannot be compared.
- Mixing methods, multiplying some ideas and averaging others, which reorders the backlog for no reason.
- Treating the score as the decision. Two ideas at 6.2 and 6.0 are a tie; the team still has to judge.
- Never rescoring after a test, so the backlog keeps ranking ideas on evidence the team has already replaced.
FAQ
What does ICE stand for?
ICE stands for impact, confidence and ease. Impact is how much an idea would move the goal metric if it works. Confidence is how sure the team is about that impact. Ease is how little time and effort the idea needs. Each is usually rated from 1 to 10 and the three are combined into a single score.
What is the difference between ICE and RICE?
RICE adds reach and replaces ease with effort. Intercom's RICE multiplies reach, impact and confidence, then divides by effort in person-months, with confidence as a percentage. ICE folds reach into impact and rates everything on one 1 to 10 scale. RICE takes longer but separates how many people an idea touches from how much it changes for each.
Should ICE scores be multiplied or averaged?
Both are in use. Itamar Gilad and Atlassian's Jira automation guide multiply; GitLab's experiment template averages. Multiplying punishes an idea that scores low on any one letter, so an idea rated 9, 9 and 1 falls below one rated 5, 5 and 5. Averaging lets a strong rating hide a weak one. Pick one method and keep it.
How do you score confidence in ICE?
Base it on evidence, not on how strongly people feel. Itamar Gilad's Confidence Meter rates evidence on a 0 to 10 scale: personal conviction, pitch decks and other people's opinions sit near zero, estimates and anecdotes are low, market data and customer evidence are in the middle, and test and launch results score highest.
Who invented ICE scoring?
ICE is credited to Sean Ellis, who coined the term growth hacking and founded GrowthHackers, and it was first used to rank growth experiments. We could not find a dated original post that defines it, so the exact year and Ellis's original formula are not documented. Itamar Gilad later added the Confidence Meter for the confidence rating.
Sources
- Itamar Gilad, Product discovery with ICE and the Confidence Meter
- Itamar Gilad, Confidence Meter calculator
- Itamar Gilad, Evidence-Guided: Creating High-Impact Products in the Face of Uncertainty
- Penguin Random House, Hacking Growth by Sean Ellis and Morgan Brown (2017)
- Lenny's Newsletter, The original growth hacker: Sean Ellis (2024)
- GitLab, Experiment Idea issue template
- GitLab, Move Pages menu entry under Deploy (experiment issue 373547)
- GitLab, Geo failover container registry migration (experiment issue 458448)
- Atlassian, How to create a rule that calculates ICE score and prioritizes tickets
- Atlassian, Jira Product Discovery fields reference
- Kohavi, Crook, Longbotham et al., Online Experimentation at Microsoft (2009)
- Harvard Business Review, Kohavi and Thomke, The Surprising Power of Online Experiments (2017)
- Cambridge University Press, Kohavi, Tang and Xu, Trustworthy Online Controlled Experiments (2020)
- Harvard Business Review, Thomke, Building a Culture of Experimentation (2020)
- Harvard Business Review, Kahneman, Rosenfield, Gandhi and Blaser, Noise (2016)
- Harvard Business Review, Schoemaker and Tetlock, Superforecasting: How to Upgrade Your Company's Judgment (2016)
- Journal of Personality and Social Psychology, Buehler, Griffin and Ross, Exploring the planning fallacy (1994)
- Flyvbjerg and Budzier, Why Your IT Project May Be Riskier Than You Think (Harvard Business Review, 2011; arXiv)
- Harvard Business Review, Lovallo and Kahneman, Delusions of Success (2003)
- Intercom, RICE: Simple prioritization for product managers
- Scaled Agile Framework, Weighted Shortest Job First
- Practical Ecommerce, Chris Goward, Use the PIE Method to Prioritize Ecommerce Tests (2013)
Last updated Oct 9, 2026


Marketing agency or growth system: when a company outgrows its agency
An agency is the right call while the founder still runs most of the company. Once the business starts copying itself into new locations or markets, it needs a system that sets goals, tests hypotheses and owns the result.

Why healthcare marketing agencies stall: the short, mid and long wins model we use with clinics
Most agencies own the click and nobody owns the front desk. How we structure clinic work in three horizons, the research behind each one, and one year of results.

Why channel tests stall after month three
Most paid channel tests do not end with a decision. They end when the budget runs out, the attribution model changes, or everyone quietly stops looking at the dashboard.