Sales capacity planning
Sales capacity planning is the arithmetic that turns a revenue target into a number of salespeople and a hiring calendar, after allowing for ramp time, attrition and the share of quota reps actually deliver.
Sales capacity planning is a method for working out how many salespeople a revenue target needs and when to hire them. It multiplies productive reps by quota and by realistic attainment, then corrects for new hires who are still ramping and for reps who will leave. The result is a hiring plan with dates, not just a headcount.
- Origin
- No single inventor; sizing models by Leonard Lodish, then Andris Zoltners, Prabhakant Sinha and Sally Lorimer, 1980 (Lodish sizing model); 2004 (Zoltners, Sinha and Lorimer)
- Level
- 301 · Advanced
- Fits
- Scale-up
- Time to apply
- half a day for a first model, then a quarterly refresh
- What you need
- next year's new revenue target, split by segment if reps sell to different segments · 12 months of rep-level history: quota, closed revenue, start and leave dates · the real recruiting lead time, from opening a role to a signed offer and a start date
Sales capacity planning is the arithmetic that connects a revenue target to a number of salespeople and the dates they must start. There is no single inventor and no standard. The practitioner version is a spreadsheet, and it descends from academic sales force sizing: Leonard Lodish published a sizing and allocation model in the Journal of Marketing in 1980, and Andris Zoltners, Prabhakant Sinha and Sally Lorimer gave sizing a full chapter in their 2004 book. Heads of sales and finance use the spreadsheet version when a target depends on hiring.
It sits downstream of two earlier choices. Who you sell to and which accounts fit decide what one rep can close. Capacity planning then asks how many reps, hired when, that takes.
What is the sales capacity formula?
The basic formula is reps times individual quota times average attainment. Salesforce’s planning guide writes it that way and then corrects the rep count: fully ramped reps count at 100 percent, new hires at 50 percent, and the average number of leavers is subtracted. Its example, 20 reps plus half of 2 ramping reps minus 2 leavers, gives 19 complete reps.
Three inputs do the damage, and each one is a number you can measure in your own CRM and HR records.
Ramp: new hires are not full reps
Ramp time is the months a new rep needs to reach the output of a tenured one. Insight Partners, an investor, gives 6 to 9 months for SMB and mid-market reps and about 12 months for enterprise. That is a vendor-side benchmark, so treat it as a starting point and replace it with the curve of your own last ten hires.
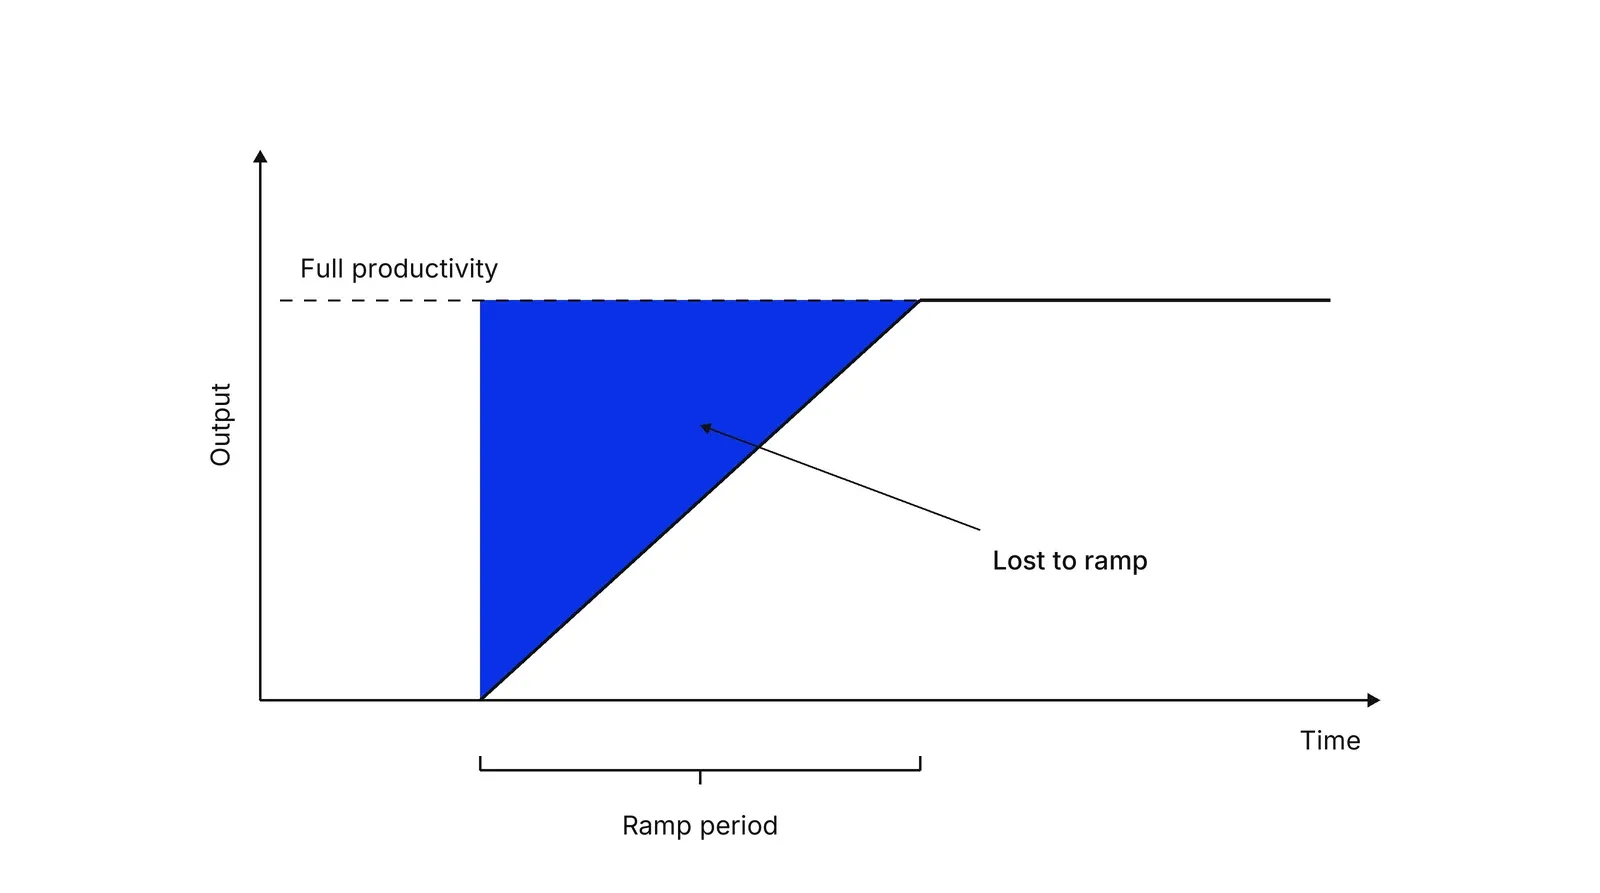
The blue triangle is why hiring date matters as much as headcount. In the example below, a rep who starts in July books about a third of what the same rep books starting in January, before any attrition.
Attrition: plan for leavers
Attrition is the share of reps who leave in a year. The Bridge Group’s 2017 report, a survey of 384 SaaS executives, found average rep tenure of 2.4 years and about 30 percent annual turnover, with involuntary exits a little over half. Insight Partners suggests 20 percent when you have no history. Both are vendor-side figures, and your own rate is the one to use.
Leaving is contagious inside a team. Sunder, Kumar, Goreczny and Maurer followed 6,727 salespeople for two years and found that peer turnover substantially raises a rep’s own chance of leaving. A model that spreads leavers evenly can understate the quarter after a visible departure.
Attainment: quota is not output
Attainment is delivered revenue divided by quota. Ebsta and Pavilion’s 2024 benchmark, covering 530 companies, reports 69 percent of reps missing quota, with average quotas 19 percent smaller than the year before. It is a vendor dataset, so read it as direction. Capacity built on 100 percent attainment builds a miss into the plan.
Quota itself is a design choice. Raju and Srinivasan showed that quota plans can vary quotas across territories to reflect heterogeneity. Chung, Steenburgh and Sudhir found in field data that quarterly bonuses help weaker performers stay on track toward annual quotas.
A worked example
The numbers are illustrative arithmetic, not a real company, and the method follows the Salesforce and Insight Partners guides. All money is in millions of dollars of new annual contract value. Target: 12. Quota: 1.2 per ramped rep. Attainment: 70 percent, so 0.84 delivered per rep. Ten ramped reps, 20 percent annual attrition (half a rep a quarter), four hires on 1 January at 50 percent output for two quarters.
| Quarter | Ramped reps | Ramping, at weight | Productive reps | Bookings, $M |
|---|---|---|---|---|
| Q1 | 10.0 | 2.0 | 12.0 | 2.52 |
| Q2 | 9.5 | 2.0 | 11.5 | 2.42 |
| Q3 | 9.0 | 4.0 | 13.0 | 2.73 |
| Q4 | 8.5 | 4.0 | 12.5 | 2.62 |
The year totals 10.29 against a target of 12. Paper capacity was 14 reps times a 1.2 quota, which is 16.8, so the chart shows 6.5 disappearing into ramp, attrition and attainment.
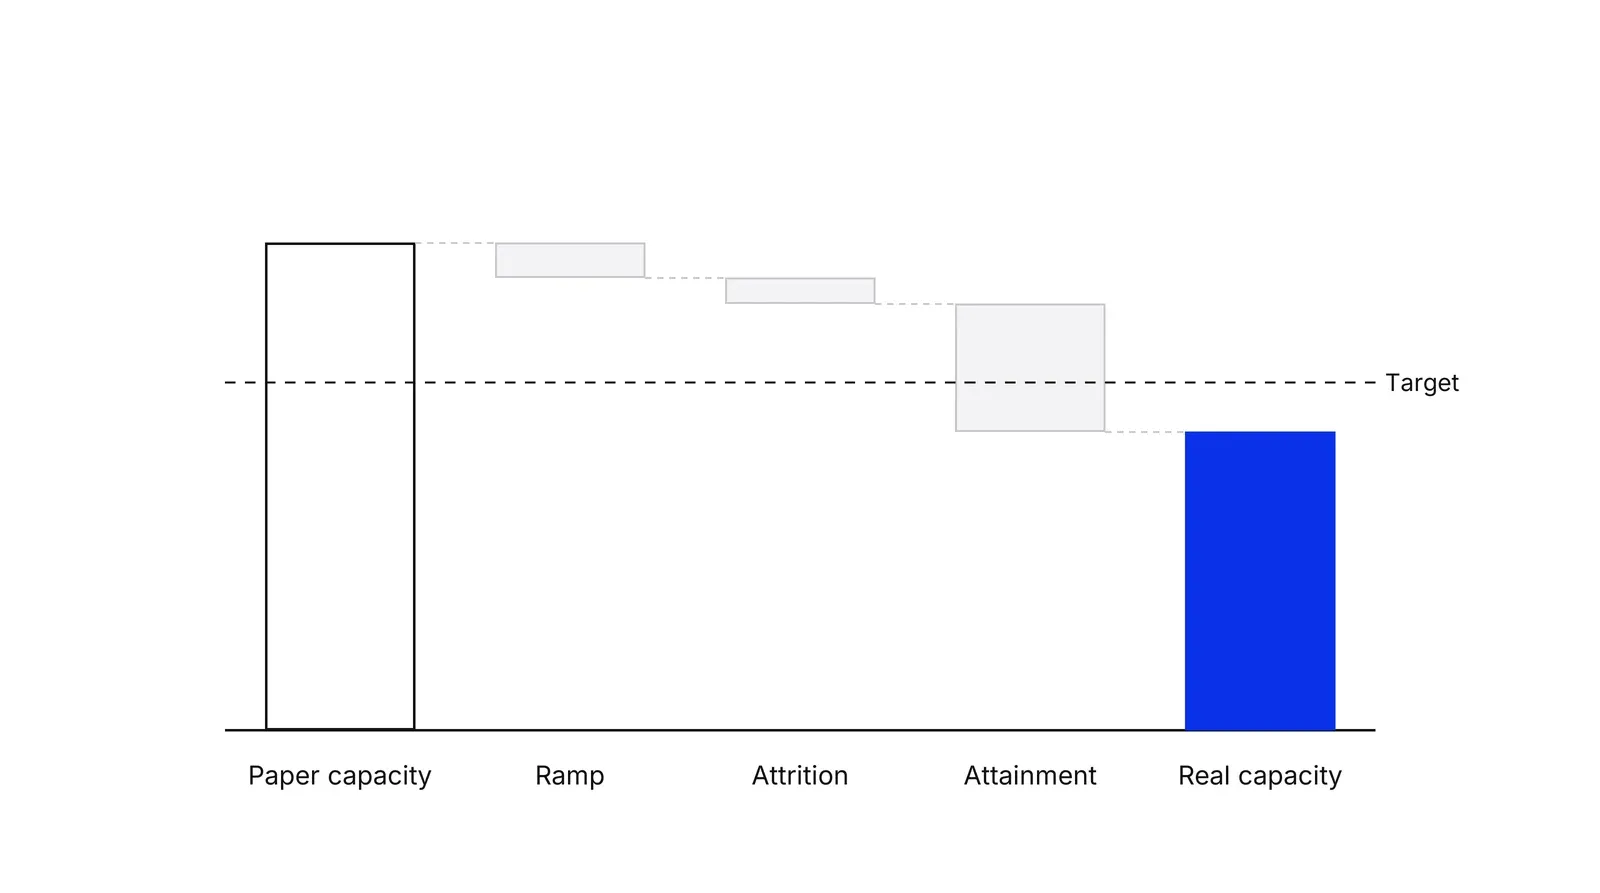
Hiring timing changes the answer more than most people expect. Each extra hire on 1 January adds about 0.63, so closing the gap takes three more hires, seven in all. A quota-times-attainment shortcut would have said 14.3 reps in total, about four hires.
| Scenario | Hires | Year bookings, $M | Gap to 12, $M |
|---|---|---|---|
| Four hires on 1 January | 4 | 10.29 | 1.71 |
| Two hires in January, two in April | 4 | 9.87 | 2.13 |
| Four hires on 1 July | 4 | 8.61 | 3.39 |
| Seven hires on 1 January | 7 | 12.18 | none |
At the Bridge Group’s average quota-to-OTE ratio of 5.3, a 1.2M quota implies on-target earnings of roughly $226,000 per rep. That is arithmetic on a vendor average, and it is the cost side of the decision.
How academic sizing differs
Academic models answer a different question: how large should the force be, given what an extra rep adds? Zoltners, Sinha and Lorimer note that companies use many sizing rules, and that some often lead to poor decisions. Axtria, a consultancy, lists six classic approaches, including same as last year, a fixed percentage of sales, matching a competitor, workload build-up, affordable coverage and sales response modeling.
The response approach is where the research is. At Syntex Laboratories, Lodish and colleagues built subjective response functions from manager estimates, used them to decide to enlarge the pharmaceutical sales force, and reported a continuing $25M, 8 percent annual sales increase. Albers, Mantrala and Sridhar pooled 506 estimates from 75 articles and found a mean personal selling elasticity of 0.34, higher for early life cycle offerings. At that average, 10 percent more selling effort goes with about 3.4 percent more sales, so returns shrink as the team grows, and a rep is worth adding only while the extra gross profit exceeds the loaded cost.
Sizing also sits beside two neighbouring decisions. Zoltners and Sinha describe territory alignment work across 1,500 implementations for 500 companies, and Skiera and Albers showed that balancing territories does not by itself maximize profit. Zoltners, Sinha and Lorimer also argue in Harvard Business Review that structure should match the stage of the business.
Capacity planning supplies the calendar and the response view supplies the ceiling. Run the spreadsheet for next year, then ask whether the last rep you plan to hire still pays. The stage definitions in sales process stages give you the conversion rates to check pipeline against the plan.
Teams that want this model built alongside their pipeline numbers can start from the Growth Lab practice.
How to apply Sales capacity planning, step by step
- Fix the target and the quota per rep. Write down the new revenue the team must book and the annual quota one fully ramped rep carries, per segment. Result: two numbers per segment that every later step uses.
- Measure attainment from history. For each of the last four quarters, divide closed revenue by the quota of the reps who carried one. Use the median, not the best quarter. Result: a realistic attainment percentage you can defend.
- Set the ramp curve. From your last 10 hires, find how many months passed before each reached the output of a tenured rep. Convert that to a weight per month, such as 25, 50, 75 and 100 percent. Result: a ramp table per segment.
- Set attrition and hiring lag. Count reps who left in the last 12 months as a share of average headcount, and measure recruiting lead time. Result: a quarterly leave rate and a number of months between opening a role and a start date.
- Build the quarter-by-quarter model. For each quarter, count ramped reps and ramping reps at their weights, subtract expected leavers, multiply by quarterly quota and attainment, and add the four quarters. Result: expected bookings against the target, with the gap in dollars.
- Close the gap and add the support roles. Test three levers one at a time: more hires, earlier hire dates, higher attainment through better lead quality or enablement. Then size managers, sales engineers and development reps from your ratios. Result: a hiring calendar with start dates and an owner for each requisition.
Examples
A B2B software team, illustrative
Illustrative numbers, no real company, in millions of dollars. The target is 12 of new annual contract value. Each ramped rep has a quota of 1.2 and delivers 70 percent of it. Ten ramped reps are in place, 20 percent leave over the year, and four hires start on 1 January and ramp at half output for six months. The model gives 10.29, a gap of 1.71. Seven hires on 1 January close it.
A payments company selling to merchants, illustrative
Illustrative numbers, no real company. Opening a role takes about 60 days to fill, and the average deal takes 90 days from first call to signature, so a hire approved today books its first revenue around 150 days out, before any ramp. A plan that needs the revenue in Q4 has to approve the requisitions in Q1. Compliance onboarding in a regulated product can lengthen the ramp further, so measure it from your own hires.
A hospital group selling to employers, illustrative
Illustrative numbers, no real group. Four account executives sell corporate health plans with a 9-month cycle. Two of them are in their first year. Counting all four at full quota would count 4 productive reps where the plan should count 3, so it weights the two new reps at 50 percent until their sixth month and moves the hiring decision forward.
When to use it
Use it when a revenue target depends on adding reps, when you are setting quotas for the first time across several segments, or when bookings keep missing plan although headcount grew. It is most useful for teams of roughly ten reps and up, where hiring timing changes the year.
When not to use it
Skip the full model when the team has fewer than five reps and no history, since the inputs would be guesses. It also does not answer which segment to sell to, or whether the product sells at all. Settle that with go-to-market and ideal-customer work first.
Common mistakes
- Multiplying headcount by quota and calling it capacity. The product counts new hires and leavers as full reps and assumes everyone hits 100 percent.
- Using the best quarter's attainment instead of the median, which builds optimism into every later number.
- Ignoring hiring lag, so requisitions open in the quarter the revenue is needed.
- Setting the same quota for every territory without checking whether potential is equal, which hides weak coverage behind an average.
- Planning headcount only and forgetting that managers, sales engineers and development reps scale with it.
FAQ
How do you calculate sales capacity?
Multiply the number of productive reps by individual quota and by average attainment. Count fully ramped reps at 100 percent, new hires at a lower weight, and subtract expected leavers. Salesforce's guide gives the basic form as reps times quota times attainment, then adjusts it for ramp and churn.
What is a realistic quota attainment rate?
Use your own history. Ebsta and Pavilion's 2024 benchmark, built on 530 companies, found 69 percent of reps missed quota, even though average quotas had fallen 19 percent. A plan that assumes every rep hits 100 percent builds a miss into the year.
How long does it take a new sales rep to ramp?
It depends on deal size and cycle. Insight Partners gives 6 to 9 months for SMB and mid-market reps and about 12 months for enterprise, as benchmarks from an investor. Measure your last hires and use that curve instead.
How many salespeople do I need to hit a sales target?
Divide the target by what one ramped rep delivers, which is quota times attainment, then add reps for ramp and attrition. In the worked example below, a simple division suggests about 14 reps, while the full model with leavers and ramping hires needs 17.
How often should you rerun a capacity plan?
Rerun it every quarter with actual attainment, actual leavers and actual hire dates. The plan degrades quickly because attrition and ramp are the two inputs that move most between planning and reality.
Sources
- Andris Zoltners, Prabhakant Sinha and Sally Lorimer, Sales Force Design for Strategic Advantage, Palgrave Macmillan, 2004
- Zoltners, Sinha and Lorimer, Sizing the Selling Organization (chapter 7 of Sales Force Design for Strategic Advantage), 2004
- Zoltners, Sinha and Lorimer, Match Your Sales Force Structure to Your Business Life Cycle, Harvard Business Review, 2006
- Leonard Lodish, Ellen Curtis, Michael Ness and M. Kerry Simpson, Sales Force Sizing and Deployment Using a Decision Calculus Model at Syntex Laboratories, Interfaces, 1988
- Leonard Lodish, A User-Oriented Model for Sales Force Size, Product, and Market Allocation Decisions, Journal of Marketing, 1980
- Leonard Lodish, CALLPLAN: An Interactive Salesman's Call Planning System, Management Science, 1971
- Prabhakant Sinha and Andris Zoltners, Sales-Force Decision Models: Insights from 25 Years of Implementation, Interfaces, 2001
- Andris Zoltners and Prabhakant Sinha, Sales Territory Design: Thirty Years of Modeling and Implementation, Marketing Science, 2005
- Bernd Skiera and Sönke Albers, COSTA: Contribution Optimizing Sales Territory Alignment, Marketing Science, 1998
- Sönke Albers, Murali Mantrala and Shrihari Sridhar, Personal Selling Elasticities: A Meta-Analysis, Journal of Marketing Research, 2010
- Murali Mantrala, Sönke Albers, Fabio Caldieraro and Ove Jensen, Sales Force Modeling: State of the Field and Research Agenda, Marketing Letters, 2010
- Jagmohan Raju and V. Srinivasan, Quota-Based Compensation Plans for Multiterritory Heterogeneous Salesforces, Management Science, 1996
- Doug Chung, Thomas Steenburgh and K. Sudhir, Do Bonuses Enhance Sales Productivity? A Dynamic Structural Analysis of Bonus-Based Compensation Plans, Marketing Science, 2014
- Sarang Sunder, V. Kumar, Ashley Goreczny and Todd Maurer, Why Do Salespeople Quit? Own and Peer Effects on Salesperson Turnover, Journal of Marketing Research, 2017 (Indian School of Business repository record)
- Salesforce (vendor guide), Sales capacity planning
- Insight Partners (investor), Capacity planning for sales
- Axtria (consultancy), Pharma sales force sizing strategy, part 1: classic approaches
- The Bridge Group (research firm), 2017 SaaS AE Metrics Report, via For Entrepreneurs
- The Bridge Group (research firm), AE models, motions and metrics study, 2026
- Ebsta and Pavilion (vendor and community), 2024 B2B Sales Benchmarks
Last updated Oct 9, 2026


Marketing agency or growth system: when a company outgrows its agency
An agency is the right call while the founder still runs most of the company. Once the business starts copying itself into new locations or markets, it needs a system that sets goals, tests hypotheses and owns the result.

Why healthcare marketing agencies stall: the short, mid and long wins model we use with clinics
Most agencies own the click and nobody owns the front desk. How we structure clinic work in three horizons, the research behind each one, and one year of results.

Why channel tests stall after month three
Most paid channel tests do not end with a decision. They end when the budget runs out, the attribution model changes, or everyone quietly stops looking at the dashboard.