Marginal CAC and diminishing returns
Marginal CAC is the cost of the next customer a channel can win, which rises with spend and tells you where extra budget stops paying back.
Marginal CAC is the extra spend needed to win one extra customer from a channel, calculated as the change in spend divided by the change in new customers. Because returns diminish, it sits above average CAC and rises as spend grows. It tells you the point where the next dollar of advertising costs more than the customer is worth.
- Origin
- Economics of marginal cost; response-curve estimation by Google (Jin et al.) and Meta (Robyn) marketing mix teams, marginal cost is textbook economics; Google's Bayesian MMM paper with carryover and shape effects is 2017
- Level
- 301 · Advanced
- Fits
- Small and mid-size, Scale-up
- Time to apply
- a few hours to compute the ladder from history; four to six weeks for one spend test
- What you need
- weekly spend and new customers for one channel, ideally by region, for at least a year · gross profit per new customer, or the payback window you will accept · the ability to raise or cut that channel's spend in some regions only
Marginal CAC is the cost of winning the next customer from a channel: the extra spend divided by the extra customers it brings. Average CAC divides everything spent by everything won. The two numbers are close at small budgets and drift apart as spend grows, and the gap is where growth budgets quietly stop paying back.
No standard source defines “marginal CAC” as a metric. The idea comes from economics, where marginal cost is the cost of one more unit and average cost rises whenever marginal cost sits above it. Marketing measurement teams at Google and Meta reached the same place from the other side, under the name marginal ROAS or marginal ROI, which is the inverse view: return on the next dollar instead of cost of the next customer.
Why does the next customer cost more?
Returns diminish because the cheapest audience is reached first. David Skok notes that lead sources saturate and “produce less leads for more dollars invested”. The first thousand spent on search ads meets people already looking for you. The tenth thousand bids on weaker queries at higher prices.
Evidence from experiments agrees. Thomas Blake, Chris Nosko and Steven Tadelis ran paid search tests at eBay (Econometrica, 2015) and found brand-keyword ads had no measurable short-term benefit, and that for non-brand keywords the frequent buyers who needed no persuasion accounted for most of the spend, giving negative average returns. Bradley Shapiro, Gunter Hitsch and Anna Tuchman studied 288 brands (Econometrica, 2021) and found negative marginal returns on TV for more than 80% of them. These are results from specific datasets, not laws.
Average CAC hides the last dollars
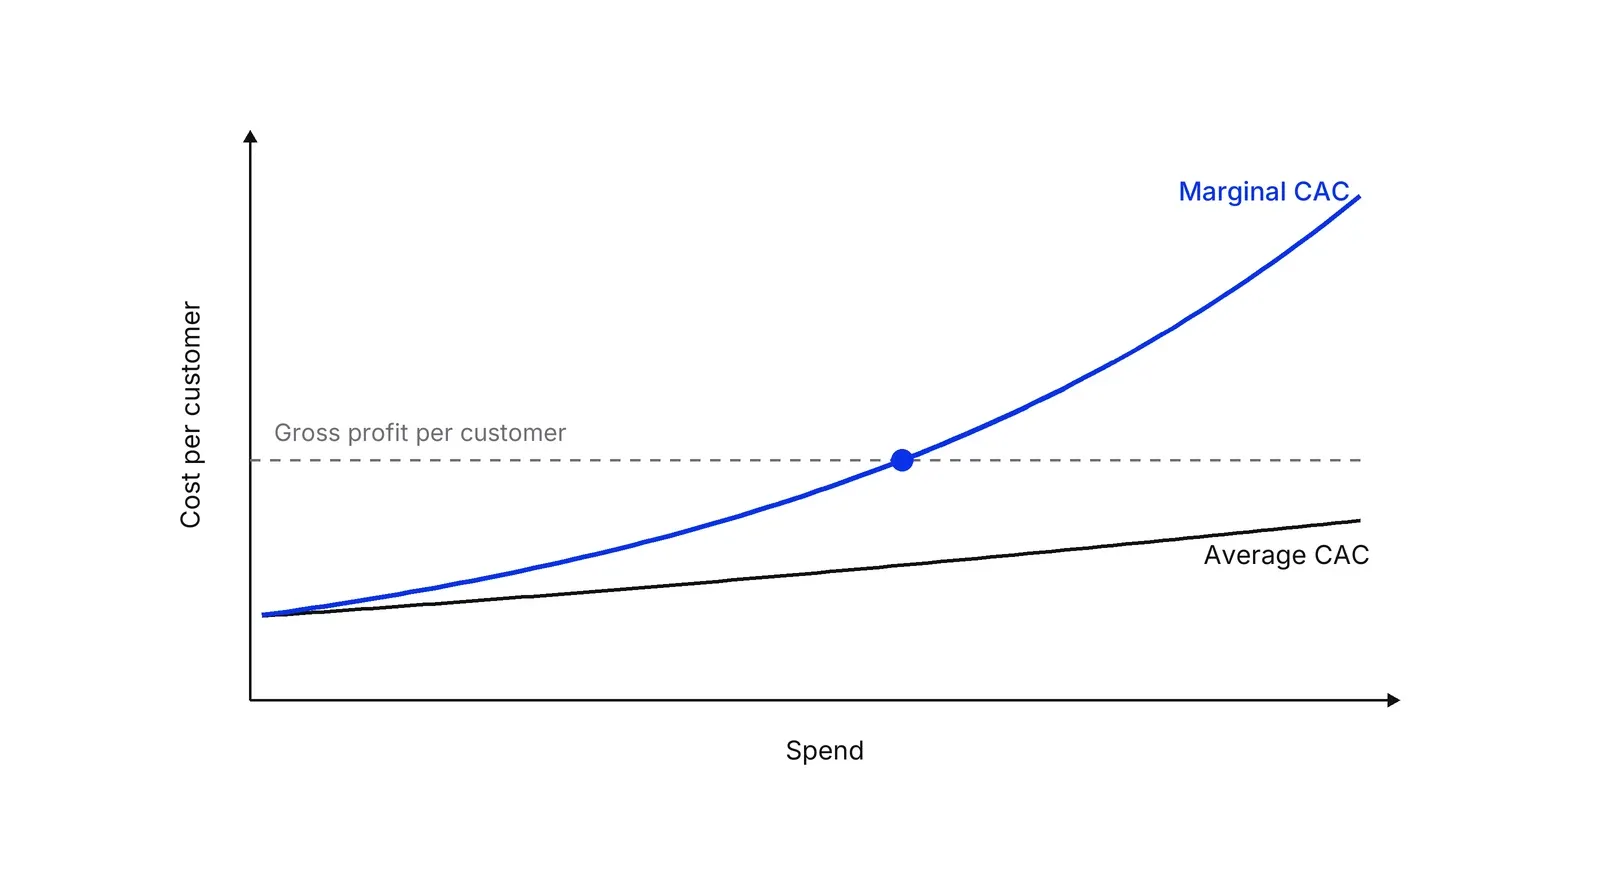
Average CAC is a running mean, so it moves slowly and flatters the latest spend. In the first example above, average CAC drifts from $50 to $82 while marginal CAC climbs from $71 to $167. A team watching the average sees a mild rise. A team watching the margin sees that the last band loses money.
Andreessen Horowitz says blended CAC, which counts organic users, can hide whether paid spending is profitable, and that investors weigh paid CAC more. Marginal CAC goes one level further: the cost inside a paid channel at one spend level. It also differs from CAC payback, which divides CAC by monthly gross profit. Payback measures how fast the average customer repays; marginal CAC tells you which customer you should still buy. The LTV to CAC ratio and the magic number both use average cost, so they share the blind spot. The unit economics page covers where CAC sits in the wider model.
What is a response curve?
A response curve plots the outcome a channel produces at each spend level, and its slope at your current spend is the marginal return. Yuxue Jin and four Google colleagues modelled (2017) two features of advertising: carryover, the lagged effect after spend occurs, and shape, the diminishing returns. In the paper marginal ROAS is the derivative of the response with respect to spend, which the authors estimate by raising spend in a chosen period by 1% and recomputing the prediction. They cap carryover at 13 weeks and fit the model to 2.5 years of weekly data for a shampoo advertiser, where TV and magazines were the two largest channels.
Google’s Meridian model defines mROI as the return on the next dollar above historical spend, and illustrates it with an ROI of $2.50 beside an mROI of $0.80. Meta Marketing Science’s Robyn documentation calls marginal ROAS the most important metric for budget allocation, and its allocator offers a maximum-response scenario and a target-efficiency scenario for ROAS or CPA. Marginal CAC is the reciprocal in customer terms. A $0.80 mROI on a $1 spend means you pay $1.25 of spend per dollar of revenue at the margin, and with revenue per customer known you can convert that to a cost per customer.
Curves do not always flatten from the start. A 2004 Marketing Science study by Demetrios Vakratsas and colleagues found that response to advertising is not necessarily concave everywhere, with threshold effects in SUVs and minivans but not in liquid detergent, and Meridian’s documentation says a slope above 1 gives an S-shaped curve that rises slowly before it flattens. The PyMC-Marketing guide calls each channel’s saturation level vital for future spend decisions, and the marketing mix modeling page explains how the curves are fitted.
How do you estimate marginal CAC from a spend test?
Change spend on purpose in some places and measure what happens. Google’s Meridian documentation lists a heavy-up geo test as the design that measures the incremental response to added budget, used to forecast marginal returns on established channels. A multi-cell design compares several budget levels with a common control.
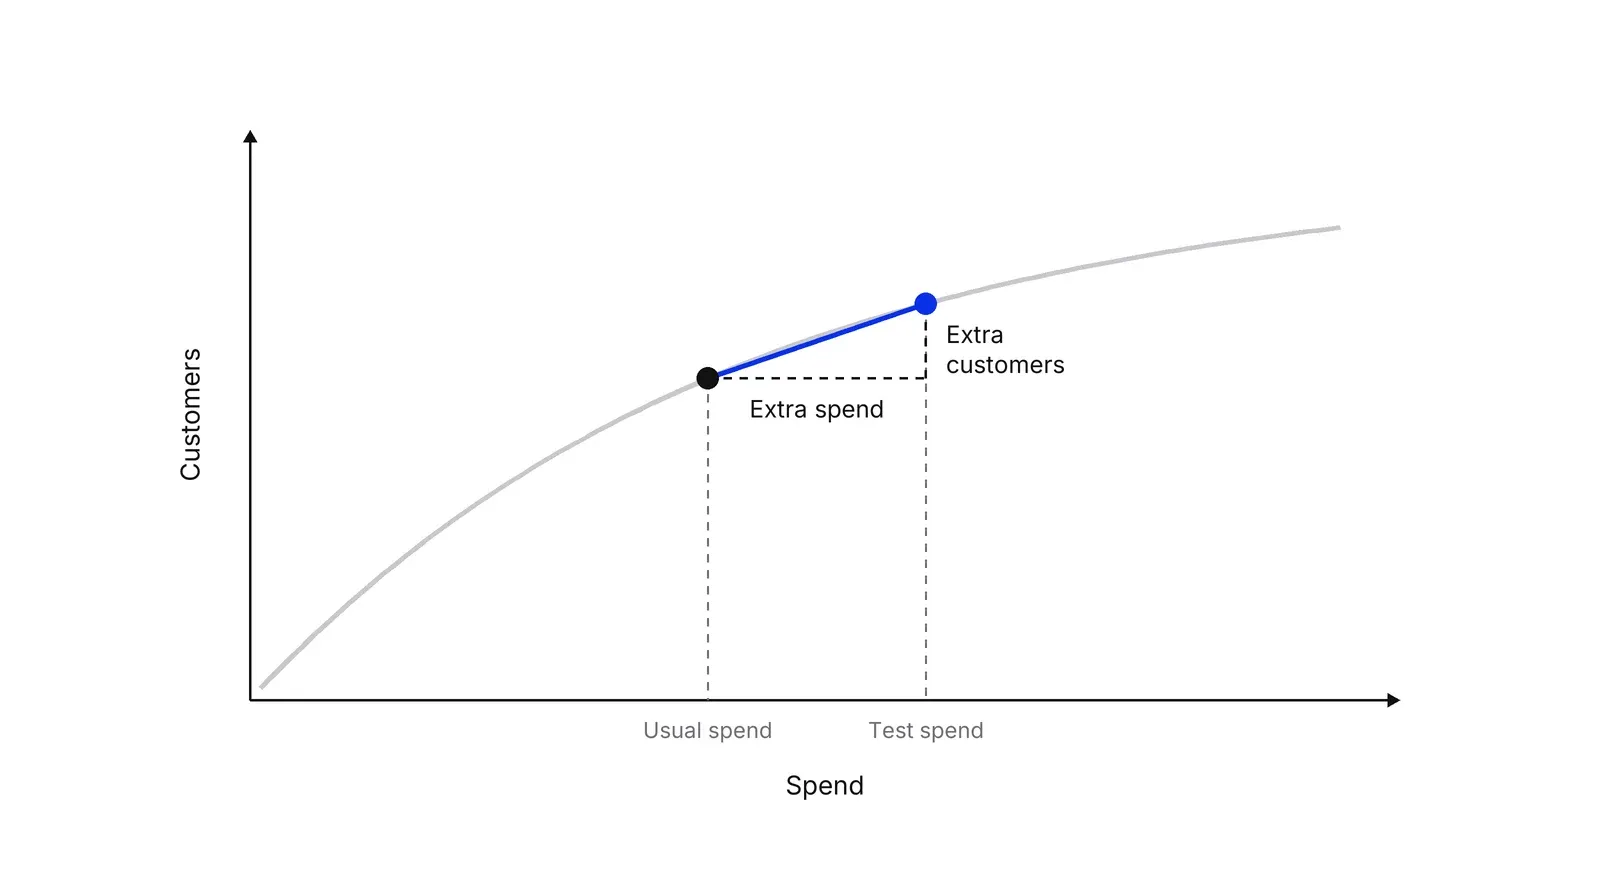
The calculation is the slope between the two points: extra spend divided by extra incremental customers. Geo experiments, introduced by Jon Vaver and Jim Koehler at Google, randomly assign regions to treatment or control, and the time-based regression variant by Jouni Kerman and colleagues suits settings with few regions. The geo-lift testing and incrementality testing pages cover how test and control regions are built. Blake and colleagues set the precedent: they suspended non-brand ads in roughly 30% of the 210 US Nielsen DMAs and compared matched regions. Meta’s GeoLift guidance recommends at least 20 geo units and four to six weeks of weekly data, covering at least one purchase cycle. For user-level tests, Meta lift studies report a cost per incremental conversion, which is a CAC measured against a holdout.
Two cautions apply. First, precision. Randall Lewis and Justin Rao found in the Quarterly Journal of Economics the median confidence interval on ROI across 25 large field experiments was over 100 percentage points wide. The same paper reports a coefficient of variation of about 10 for individual-level sales, and says informative experiments can need more than 10 million person-weeks. Marginal CAC comes from the difference between two noisy estimates, so we would expect it to be harder to pin down than a total effect, and you should publish the interval, not just the midpoint. Second, the range. A test describes the spend levels it covered, and a curve fitted to it describes nothing beyond them with confidence.
Combining tests and models
A test gives one slope at one point. A model gives a whole curve, but one that rests on assumptions, and David Chan and Mike Perry outline the challenges such models face in giving valid answers. Jin and colleagues report that Bayesian estimation works well with large datasets, while with the sample sizes typical of a couple of years of weekly national data the estimates can be biased and the priors matter a lot. Meridian’s guidance is to use experiment results as informative priors, and it warns that experiments measuring marginal lift create an estimand mismatch with the model’s zero-spend baseline, so a test result needs translating before it is used.
Platform simulators sit at the cheap end. The Google Ads API returns projected cost and conversions for different budgets, built from past data, and Google states they are predictions and not guarantees. We treat them as a hypothesis for a spend test to confirm. Brett Gordon and three co-authors compared 15 Facebook experiments, covering 500 million user-experiment observations, with observational methods and found the observational ones often failed to recover the experimental result, so model output needs an experiment behind it.
Setting the stopping rule
Spend in a channel until marginal CAC equals the most you will pay for one more customer. That ceiling is gross profit over the payback window you accept, or a conservative share of lifetime value. Meridian’s optimizer offers a target-mROI scenario that finds the maximum spend per channel that still meets a minimum marginal ROI. With several channels, move money from the one with the highest marginal CAC to the one with the lowest until the gap closes.
A Growth Lab plan starts from the marginal CAC of each channel, so budget moves follow the next customer and not the average.
How to apply Marginal CAC and diminishing returns, step by step
- Set the break-even ceiling. Decide the most you will pay for one more customer: gross profit per customer over the payback window you accept, or a share of lifetime value. Result: a single number that marginal CAC is judged against.
- Build the spend ladder from history. Sort a channel's weeks or months into spend bands and compute customers and CAC per band, then the extra spend divided by extra customers between neighbouring bands. Result: a first, rough marginal CAC per band, to be treated as a hypothesis because other things changed between bands.
- Design a spend test. Raise the channel's spend by 20 to 30 percent in randomly chosen regions and keep it unchanged in the rest, or cut it in some regions. Add a second, larger step if you can afford a multi-cell design. Result: a test plan with named regions, spend levels and a start date.
- Run it for at least one purchase cycle. Keep everything else steady for four to six weeks or one full buying cycle, whichever is longer. Result: outcome data for test and control regions with no mid-test changes to explain away.
- Compute incremental marginal CAC. Divide the extra spend by the extra customers in test regions compared with their expected level without the extra spend, and report the confidence interval beside the point estimate. Result: a measured marginal CAC for that spend range.
- Compare with the ceiling and move budget in small steps. If marginal CAC is below the ceiling, add budget; if above, cut it and shift the money to the channel with the lowest marginal CAC. Repeat the test after the move. Result: a budget that follows the marginal customer, not the average.
Examples
A paid search ladder (illustrative)
A channel returns 200 customers on $10,000, 340 on $20,000, 430 on $30,000 and 490 on $40,000. Average CAC rises from $50 to $82, a drift that looks harmless. Marginal CAC between bands is $71, $111 and $167. With $120 of gross profit per customer, the last $10,000 buys 60 customers and loses about $2,800.
A payments app buying merchants (illustrative)
A fintech app raises paid social spend by 25 percent in half of its regions for five weeks. Test regions bring in 30 extra merchants for $15,000 of extra spend, so marginal CAC is $500, while the average CAC reported for the channel is $320. If the app keeps about $400 of gross profit per merchant over its payback window, the extra spend loses money even though the average looks safe.
A dental clinic with two channels (illustrative)
A clinic finds marginal CAC of $140 for search and $95 for a referral offer, and a ceiling of $180 per new patient. Both clear the ceiling, but the referral offer has headroom to take more money first. The clinic moves a slice of search budget into referrals and re-measures next quarter.
When to use it
Use it when a channel carries a large budget, when you plan to scale spend by half or more, or when blended CAC looks fine while growth costs more each quarter. It matters most when capital is limited and every extra dollar has to clear a payback bar.
When not to use it
Skip it for channels too small to move the outcome, since a spend test cannot detect the effect. Do not use a single average-CAC number to set next quarter's budget either. Avoid extrapolating a curve far beyond the spend range you have actually run.
Common mistakes
- Using blended or average CAC to decide the next budget increase. The average includes the cheap early customers, so it understates what the next customer costs.
- Reading marginal CAC from platform-reported conversions only. Reported conversions include sales that would have happened anyway, so marginal CAC built on them can be far too low.
- Extrapolating a fitted curve past the highest spend you have observed. The fitted shape there is an assumption, not a measurement.
- Testing for a week. Lagged effects and noise mean a short test often shows nothing or a mirage.
- Setting the ceiling from first-month revenue instead of gross profit over the payback window, which pushes the stopping point too far out.
FAQ
What is marginal CAC?
Marginal CAC is the cost of the next customer a channel can win. You calculate it as the change in spend divided by the change in new customers between two spend levels. It is usually higher than average CAC, because the cheapest customers are won first.
What is the difference between marginal CAC and average CAC?
Average CAC is total spend divided by total customers, so it blends cheap early customers with expensive late ones. Marginal CAC is the cost of one more customer at the current spend level. When marginal sits above average, each added dollar pulls the average up.
How do you calculate marginal CAC?
Raise or cut a channel's spend by a set amount in some regions, measure the incremental change in customers against comparable regions, and divide the extra spend by the extra customers. A response curve from a marketing mix model gives the same figure as the curve's slope at current spend.
When should you stop increasing ad spend?
Stop when marginal CAC reaches the most you will pay for one more customer, usually gross profit over your payback window. Total profit is highest at that point. Past it, each added customer costs more than it returns, even if average CAC still looks acceptable.
Sources
- Yuxue Jin, Yueqing Wang, Yunting Sun, David Chan, Jim Koehler, Bayesian Methods for Media Mix Modeling with Carryover and Shape Effects, Google, 2017
- Jin et al., full text of the Google Bayesian media mix modeling paper (PDF)
- David Chan, Mike Perry, Challenges and Opportunities in Media Mix Modeling, Google, 2017
- Google, Meridian, Media saturation and lagging
- Google, Meridian, Incremental outcome, ROI, mROI and response curves
- Google, Meridian, Interpret the optimizations
- Google, Meridian, ROI priors and calibration
- Google, Meridian, Types of geo experiments
- Google, Meridian, Geo experiment design methodology
- Meta Marketing Science, Robyn features: adstock, saturation and budget allocation
- PyMC Labs, PyMC-Marketing, Introduction to media mix modeling
- Thomas Blake, Chris Nosko, Steven Tadelis, Consumer Heterogeneity and Paid Search Effectiveness: A Large-Scale Field Experiment, Econometrica 83(1), 2015
- Randall A. Lewis, Justin M. Rao, The Unfavorable Economics of Measuring the Returns to Advertising, Quarterly Journal of Economics 130(4), 2015
- Bradley T. Shapiro, Gunter J. Hitsch, Anna E. Tuchman, TV Advertising Effectiveness and Profitability: Generalizable Results From 288 Brands, Econometrica 89(4), 2021
- Brett R. Gordon, Florian Zettelmeyer, Neha Bhargava, Dan Chapsky, A Comparison of Approaches to Advertising Measurement: Evidence from Big Field Experiments at Facebook, Marketing Science, 2019 (author version)
- Jon Vaver, Jim Koehler, Measuring Ad Effectiveness Using Geo Experiments, Google, 2011
- Jouni Kerman, Peng Wang, Jon Vaver, Estimating Ad Effectiveness Using Geo Experiments in a Time-Based Regression Framework, Google, 2017
- Meta Open Source, GeoLift best practices
- Meta for Developers, Lift studies
- Google Ads API, Bid simulations overview
- OpenStax, Principles of Economics 2e, Costs in the short run
- David Skok, SaaS Metrics 2.0, For Entrepreneurs
- Andreessen Horowitz, 16 startup metrics
- Demetrios Vakratsas, Fred Feinberg, Frank Bass, Gurumurthy Kalyanaram, The Shape of Advertising Response Functions Revisited, Marketing Science 23(1), 2004
Last updated Oct 9, 2026


Marketing agency or growth system: when a company outgrows its agency
An agency is the right call while the founder still runs most of the company. Once the business starts copying itself into new locations or markets, it needs a system that sets goals, tests hypotheses and owns the result.

Why healthcare marketing agencies stall: the short, mid and long wins model we use with clinics
Most agencies own the click and nobody owns the front desk. How we structure clinic work in three horizons, the research behind each one, and one year of results.

How to calculate channel payback and unit economics
A CAC number that only marketing believes will not survive a finance review. This guide calculates channel payback so both teams work from the same model.