Van Westendorp price sensitivity meter
The Van Westendorp price sensitivity meter is a four-question survey that shows the range of prices customers find acceptable for a product, and where inside that range resistance to the price is lowest.
The Van Westendorp price sensitivity meter is a survey method that asks customers four price questions: too cheap, cheap, expensive and too expensive. Plotting the answers as cumulative curves gives four crossing points that mark a range of acceptable prices. Dutch researcher Peter van Westendorp presented it at the 1976 ESOMAR Congress; a 1993 extension adds purchase intent to estimate reach and revenue.
- Origin
- Peter van Westendorp (NSS, Netherlands); purchase-intent extension by D. Newton, J. Miller and P. Smith, 1976; extension 1993
- Level
- 301 · Advanced
- Fits
- Startup, Small and mid-size, Scale-up
- Time to apply
- a day to write and test the survey, one to two weeks in field, half a day to analyse
- What you need
- a product or concept you can describe or show in a few sentences, with the main alternatives a buyer would compare it with · access to 200 to 400 people from the target segment, through a panel or your customer list · a survey tool that accepts open numeric answers and can check that the four prices rise in order · your unit cost and current or planned price, to compare with the result
The Van Westendorp price sensitivity meter (PSM) is a survey method that finds the range of prices customers accept for a product by asking them four questions about price. Peter van Westendorp, a researcher at the Dutch agency NSS, presented it at the 1976 ESOMAR Congress in Venice. Fifty years later it is offered by survey platforms such as Qualtrics and Conjointly, and as an open-source R package. Health economists have used it too, for example to set price thresholds for an AI tool in the NHS in a 2025 ISPOR poster.
Its appeal is speed. A respondent answers in about a minute, by Sawtooth Software’s estimate, and the output is a chart a founder can read. Its weakness is the same simplicity: it measures how people perceive prices, which is not the same as what they will pay.
The four questions
Van Westendorp asked respondents to point to a price on a printed scale, usually 25 to 40 steps, for four judgements:
| Question | What it captures |
|---|---|
| At what price does the product start to feel cheap? | Cheap, often worded as “a bargain” |
| At what price does it start to feel expensive? | Expensive, but still considered |
| At what price is it too expensive, so you would never consider buying it? | Upper limit |
| At what price is it too cheap, so “the quality cannot be good”? | Lower limit |
The two “too” questions were not new. Van Westendorp notes that André Gabor and Clive Granger, who studied the pricing of new products in the 1960s, and others had used them. The idea that buyers carry an acceptable range of prices also appears in Kent Monroe’s work from 1971. What he added were the cheap and expensive questions and a way to read all four together. He also wrote that purchase-intent questions were not part of the standard technique.
How the chart is built
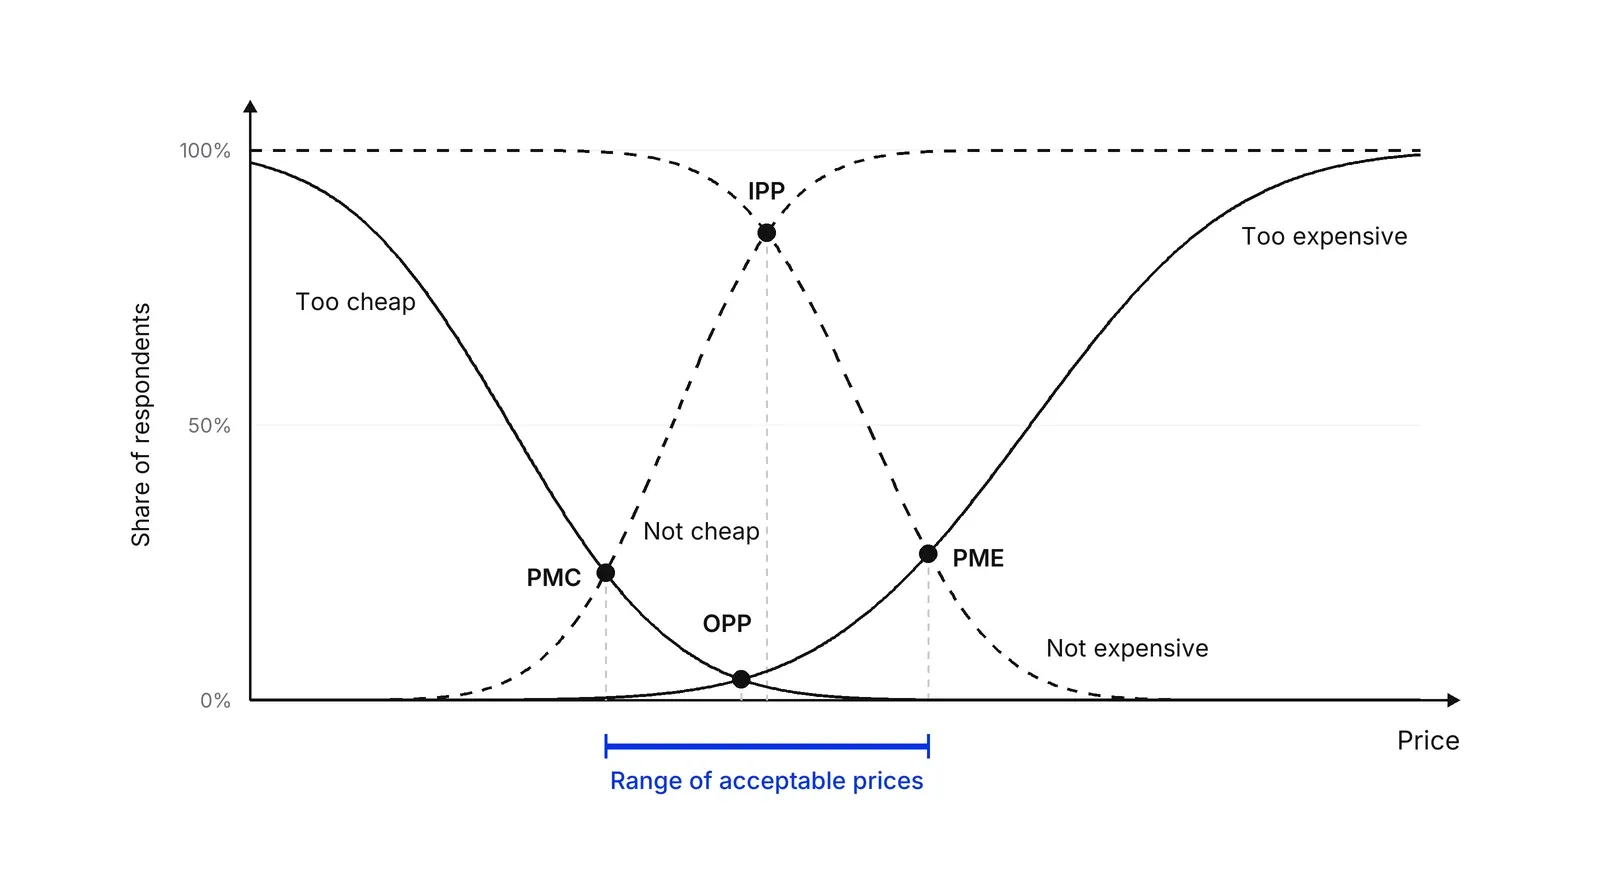
Each question becomes a cumulative curve: for every price on the axis, the share of respondents for whom that price is too cheap, cheap, expensive or too expensive. Too cheap and cheap fall as price rises; expensive and too expensive rise. Van Westendorp then reversed the first pair into “not cheap” and “not expensive”, the share of people for whom a price is no longer cheap or not yet expensive. The R package documentation follows the same construction.
What the four price points mean
The four curves cross at four prices. Each has a precise definition in the 1976 paper:
| Point | Curves that cross | What van Westendorp said it means |
|---|---|---|
| Point of marginal cheapness (PMC) | Too cheap and not cheap | Lower end of the range of acceptable prices |
| Optimal price point (OPP) | Too cheap and too expensive | Equal shares reject the price from each side, so resistance is lowest |
| Indifference price point (IPP) | Cheap and expensive (same as not cheap and not expensive) | The “normal” price, usually the median price paid or the market leader’s price |
| Point of marginal expensiveness (PME) | Too expensive and not expensive | Upper end of the range of acceptable prices |
His electric razor study in the Netherlands shows the scale of these numbers. The cheap and expensive curves crossed at 14%, at a price of 88.50 guilders, so 72% of respondents saw that price as normal. The optimal price point came lower, at 72.50 guilders, where only 4% called the razor too cheap or too expensive. He reported that most sales in his studies happened inside the range of acceptable prices.
The word optimal misleads people. Van Westendorp added a footnote: “No relation to the ‘optimum-theory’ in economy is meant.” The point marks the least resistance, and it knows nothing about your costs or margins.
The gap between the two inner points carries information too. He found the optimal and indifference prices usually coincide; when the optimal point sits left of the indifference point, he read it as stress, a market where many people already find the normal price too high. He had never seen the reverse. A 2025 study of HPV vaccine prices reports exactly that for one vaccine, with an optimal point of 610 CNY above an indifference point of 588.89 CNY, so treat his observation as a tendency.
Two definitions of the range
This matters whenever you compare two studies. The original range runs between the crossings of the “too” curves with the reversed not cheap and not expensive curves. Some research firms use a narrower range instead: too cheap crossed with expensive, and too expensive crossed with cheap. The R package offers both, calling the second “narrower”, and Conjointly uses the narrower one on purpose, arguing the original range is too wide to be useful. Other write-ups, such as a ZHAW start-up guide, describe the curves loosely enough that the reader cannot tell which version is meant.
| Range bound | Original (1976) | Narrower variant |
|---|---|---|
| Lower (PMC) | Too cheap and not cheap | Too cheap and expensive |
| Upper (PME) | Too expensive and not expensive | Too expensive and cheap |
Neither is wrong, but a range from one cannot be compared with a range from the other. Write the definition next to the chart.
The Newton-Miller-Smith extension
In 1993 D. Newton, J. Miller and P. Smith presented an extension at the American Marketing Association’s Advanced Research Techniques Forum that turns the meter into a rough demand estimate. Respondents answer two extra purchase-likelihood questions on a five-point scale, one at their own cheap price and one at their own expensive price. Purchase probability is set to zero at their too cheap and too expensive prices, and the points are joined with straight lines.
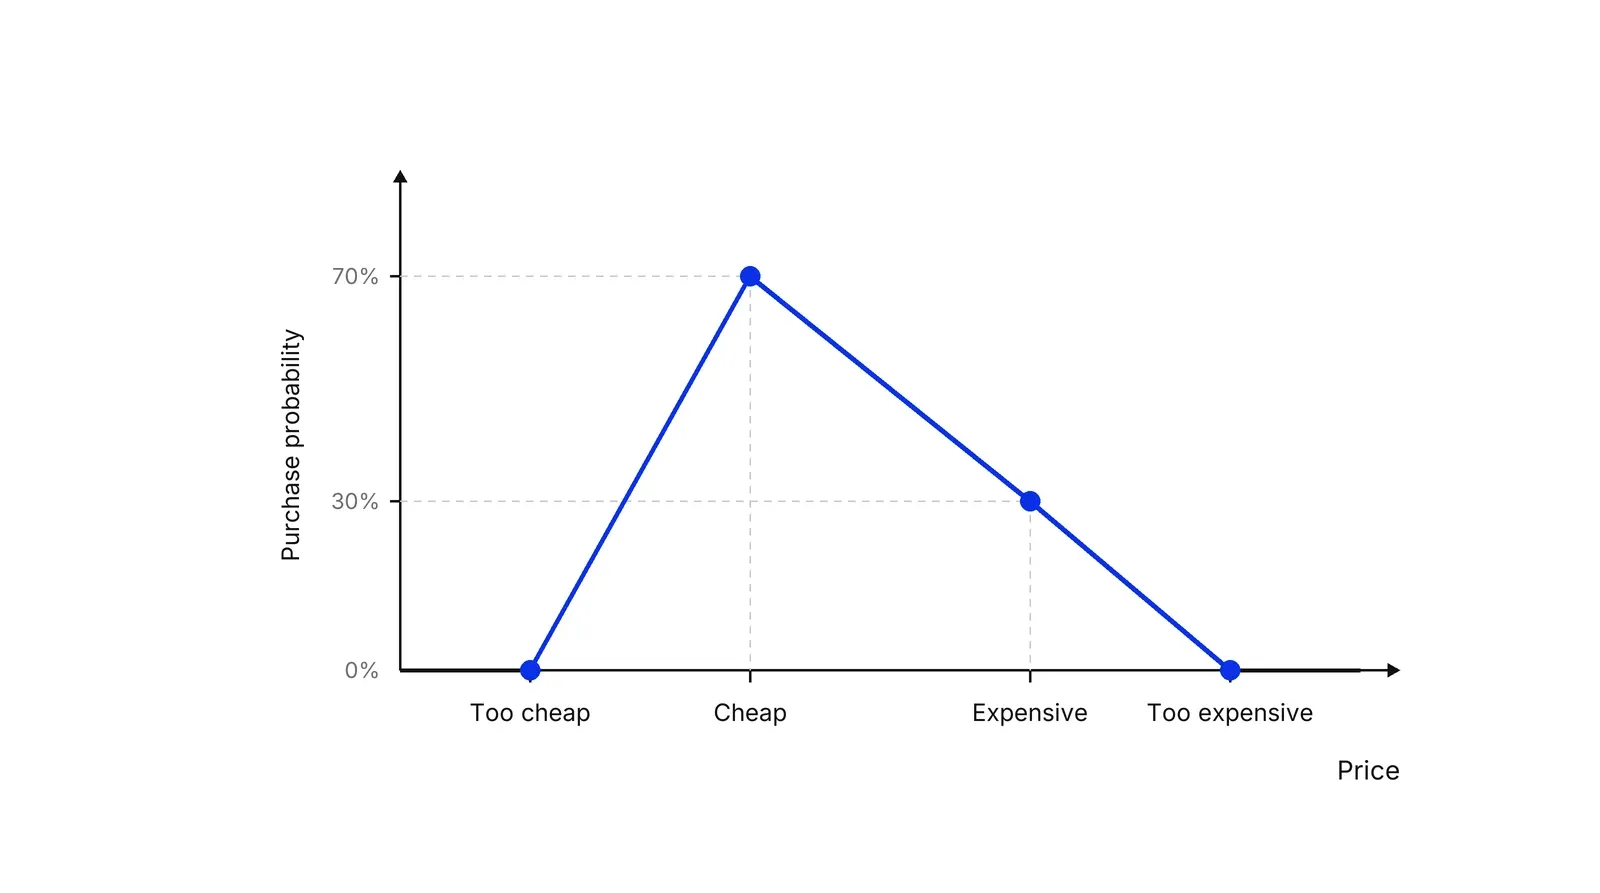
The five-point answers need converting into probabilities first. The R package defaults, taken from Sawtooth Software’s Excel tool, are 70%, 50%, 30%, 10% and 0%; Sawtooth’s CEO Bryan Orme shows a harsher 75%, 25%, 10%, 0%, 0% for packaged goods. Averaging the profiles across respondents gives a reach curve; multiplying by price gives a revenue index and its peak. Orme also notes that zero probability at the too cheap price clashes with economic sense, and that keeping intent flat below the cheap price gives a slightly lower recommended price.
What the evidence says
The method has more users than validation studies. Van Westendorp himself warned that the link between perception and behaviour was unproven. Orme calls the line-crossing reading weak and the method “a better measurement of price expectations” than of price sensitivity, and Sawtooth’s question library names choice-based conjoint as its preferred technique.
The studies that exist are mixed. Kloss and Kunter (2016) found the meter biased by its hypothetical questions, yet with results comparable to an incentive-aligned Becker-DeGroot-Marschak auction. In a test with 1,124 Swiss consumers, Miller and colleagues found hypothetical methods overestimate willingness to pay, though they still pointed to workable prices. Wertenbroch and Skiera’s auction-based estimates came out 21% to 59% lower than other methods, according to MIT Sloan Management Review.
Read the output as a range to test, not a price to set. In Pushers’ Growth Lab work, a price range from a survey is a hypothesis for the next experiment, in the same way as findings from voice of the customer research.
How to apply Van Westendorp price sensitivity meter, step by step
- Describe the product and the buyer. Write the concept the way a buyer would meet it: what it does, the pack size or plan, and the alternatives on the market. Sawtooth Software advises showing competing products and prices so respondents have a market frame. Result: one concept card and a screener that admits only people who buy in this category.
- Write the four questions. Ask at what price the product is so cheap you would doubt its quality, at what price it is a bargain, at what price it starts to feel expensive but you would still consider it, and at what price it is so expensive you would not consider it. Add two purchase-likelihood questions at the bargain and expensive prices if you want the Newton-Miller-Smith extension. Result: a six-question block, tested on five people for wording.
- Field the survey and clean the answers. Collect open numeric answers. Remove respondents whose prices do not rise in order from too cheap to too expensive; van Westendorp reported such answers at a few percent. Result: a clean dataset with four prices per respondent, and the share removed written down.
- Plot the curves and read the four points. For each price, compute the share who call it too cheap, cheap, expensive and too expensive. Reverse the cheap and expensive curves into not cheap and not expensive, plot all four, and read PMC, OPP, IPP and PME. State which definition of the range you used. Result: a chart, the four prices and the range of acceptable prices.
- Estimate reach and revenue, if you asked purchase intent. Convert each purchase-intent answer into a probability, set it to zero at the respondent's too cheap and too expensive prices, join the points with straight lines and average across respondents. Multiply by price for a revenue index. Result: the price with the highest expected reach and the price with the highest expected revenue.
- Check the result against costs and a stronger test. Compare the range with your unit cost and current price. If the decision is large, test two or three prices inside the range with a choice-based conjoint study or a live price test. Result: a recommended price or a short list of prices to test.
Examples
A Hong Kong buffet restaurant
Raab, Mayer, Kim and Shoemaker ran the meter for the dinner buffet of a Hong Kong restaurant, in a 2009 paper in the Journal of Hospitality & Tourism Research. A Virginia Tech summary of the study reports a point of marginal cheapness of HK$100, an indifference point of HK$139 and a point of marginal expensiveness of HK$148, while the regular price was HK$128. A HK$99 promotion sat below the point of marginal cheapness, where guests start to doubt quality. A companion paper in the International Journal of Contemporary Hospitality Management found guests fairly insensitive to price, yet the restaurant still needed deep cost cuts to become profitable.
HPV vaccine prices for students in China
According to Li and colleagues, writing in Frontiers in Public Health, a 2024 survey of 4,928 students at Guangdong Medical University applied the meter to HPV vaccines. Per Table 3 of the paper, the nine-valent vaccine's acceptable range ran from 942.42 to 1,204.80 CNY and the optimal price point was 1,061.19 CNY, against a market price of 1,331 CNY. The authors used the 126.2 CNY gap above the range and the 269.81 CNY gap above the optimal point to size a possible subsidy.
A payments app testing a business plan
Illustrative, no real company implied. A payments app for freelancers plans a business plan at $19 a month. A survey of 300 users gives a point of marginal cheapness at $8, an indifference price at $11 and a point of marginal expensiveness at $15. The planned price sits above the whole range, so the team either adds features that justify a higher reference price, or tests $12 and $15 in a live experiment before launch.
When to use it
Use it early, when you need a sensible price range for a new product, a new plan or a new market and have no sales data to learn from. It is quick for respondents, needs a smaller sample than split-cell price tests, and works well as a first filter before a conjoint study. It also helps track whether the price customers consider normal is drifting over time.
When not to use it
Skip it when you need to know how share moves against named competitors, which needs choice-based conjoint or a market test. It gives weak results for luxury goods, where a higher price can raise demand, for free or near-free add-ons where too cheap has no meaning, and for products buyers cannot picture yet. Do not treat its optimal price point as a profit-maximizing price.
Common mistakes
- Reading the optimal price point as the profit-maximizing price. Van Westendorp meant the price with the least resistance, and the method knows nothing about your costs.
- Mixing definitions. One vendor's range uses the not cheap and not expensive curves, another's uses cheap and expensive, and the second gives a narrower range. Say which one you used.
- Keeping respondents whose answers are out of order, such as a too expensive price below the expensive price. They distort every curve.
- Asking about the product in a vacuum. Without competitors on screen, respondents answer about price expectations, not about a choice.
- Treating stated prices as real willingness to pay. Hypothetical answers drift from real purchase behaviour, so confirm big decisions with a stronger test.
FAQ
What is the Van Westendorp method?
It is a survey technique for pricing, published by Peter van Westendorp at the 1976 ESOMAR Congress. Respondents name four prices for a product: too cheap, cheap, expensive and too expensive. The cumulative share for each price is plotted, and the crossing points give a range of acceptable prices plus two reference prices inside it.
What are the four Van Westendorp questions?
At what price would the product be so cheap that you doubt its quality? At what price is it a bargain? At what price does it start to seem expensive, though you would still consider it? At what price is it so expensive you would not consider buying it? Wording varies by vendor; the logic stays the same.
Is the optimal price point the best price to charge?
Not necessarily. Van Westendorp defined it as the price where equal shares call the product too cheap and too expensive, so resistance is lowest, and he wrote that no link to economic optimum theory was meant. It ignores costs and competitors. For revenue, add the Newton-Miller-Smith questions or run a conjoint study.
How many respondents does a Van Westendorp study need?
There is no fixed rule. One practitioner, Mike Pritchard of 5 Circles Research, suggests about 400 consumers or 200 business buyers per segment. Sawtooth Software notes the meter needs fewer people than split-cell price tests, which it puts at 300 to 500 per cell. Small samples give jagged curves.
Should I use Van Westendorp or conjoint analysis?
Use Van Westendorp to find a plausible range quickly, especially for a new product. Use choice-based conjoint when the decision depends on competitors and features, because respondents choose between options as they do in a market. Sawtooth Software, which sells both, calls conjoint its preferred technique for measuring price sensitivity.
Sources
- Peter van Westendorp, NSS-Price Sensitivity Meter (PSM): A new approach to study consumer perception of price, Proceedings of the 29th ESOMAR Congress, 1976 (Research World reprint, archived)
- CRAN, pricesensitivitymeter: Van Westendorp Price Sensitivity Meter Analysis (Max Alletsee), package page
- CRAN, pricesensitivitymeter reference manual: original and narrower range definitions, Newton-Miller-Smith extension
- CRAN, pricesensitivitymeter vignette: Visualizing PSM results
- Bryan Orme, Sawtooth Software, Pricing Research Tools You Must Know: Monadic Experiments, Van Westendorp, and Conjoint Analysis
- Sawtooth Software, Question library: Van Westendorp
- Sawtooth Software, Van Westendorp pricing model: definition, how it works, examples
- Conjointly, Van Westendorp Price Sensitivity Meter
- ZHAW School of Management and Law, Entrepreneurship resources: Price sensitivity meter
- Qualtrics, Van Westendorp pricing explained
- Mike Pritchard, 5 Circles Research, Van Westendorp pricing (the Price Sensitivity Meter)
- Dennis Kloss, Marcus Kunter, The Van Westendorp Price-Sensitivity Meter as a Direct Measure of Willingness-to-Pay, European Journal of Management 16(2), 2016
- Klaus M. Miller, Reto Hofstetter, Harley Krohmer, Z. John Zhang, Measuring Consumers' Willingness to Pay: Which Method Fits Best?, GfK Marketing Intelligence Review 4(1), 2012 (updated version of their 2011 Journal of Marketing Research article)
- IDEAS/RePEc, record of Miller, Hofstetter, Krohmer, Zhang, Measuring Consumers' Willingness to Pay
- Reto Hofstetter, Klaus M. Miller, Harley Krohmer, Z. John Zhang, A De-biased Direct Question Approach to Measuring Consumers' Willingness to Pay, arXiv, 2020
- MIT Sloan Management Review, How Much Will People Pay for That? (on Wertenbroch and Skiera), 2001
- Kent B. Monroe, The Information Content of Prices: A Preliminary Model for Estimating Buyer Response, Management Science 17(8), 1971
- ESOMAR, André Gabor and Clive Granger, The pricing of new products, European Marketing Research Review
- Li et al., Exploring the willingness to pay for HPV vaccines and price sensitivity among Chinese college students, Frontiers in Public Health, 2025
- ISPOR Europe 2025, Chauhan, Rose, Bajre, Integrating stakeholder willingness to pay using the Van Westendorp Price Sensitivity Meter into cost-effectiveness analysis
- Virginia Tech VTechWorks, summary of Raab, Mayer, Kim, Shoemaker, Price-Sensitivity Measurement: a Tool for Restaurant Menu Pricing (Journal of Hospitality & Tourism Research, 2009)
- Carola Raab, Karl Mayer, Stowe Shoemaker, Steve Ng, Activity-based pricing: can it be applied in restaurants?, International Journal of Contemporary Hospitality Management 21(4), 2009
Last updated Oct 9, 2026


Marketing agency or growth system: when a company outgrows its agency
An agency is the right call while the founder still runs most of the company. Once the business starts copying itself into new locations or markets, it needs a system that sets goals, tests hypotheses and owns the result.

Why healthcare marketing agencies stall: the short, mid and long wins model we use with clinics
Most agencies own the click and nobody owns the front desk. How we structure clinic work in three horizons, the research behind each one, and one year of results.

Why channel tests stall after month three
Most paid channel tests do not end with a decision. They end when the budget runs out, the attribution model changes, or everyone quietly stops looking at the dashboard.