Outcome-Driven Innovation (ODI)
Outcome-Driven Innovation is Tony Ulwick's survey-based method for finding which of a customer's measurable needs are important and poorly met, so a team knows what to build and for whom.
Outcome-Driven Innovation (ODI) is Tony Ulwick's method for finding underserved customer needs. It breaks a job into steps, captures 50 to 150 desired outcome statements that say how customers measure success, and surveys customers on the importance of each outcome and their satisfaction with it. An opportunity score, importance + max(importance − satisfaction, 0), ranks the outcomes so teams build for the largest unmet needs.
- Origin
- Anthony (Tony) Ulwick, Strategyn, 1991 (Strategyn founded, first client Cordis); HBR 2002; book 2005. Lucassen et al. date the method to 1996
- Level
- 301 · Advanced
- Fits
- Scale-up, Enterprise
- Time to apply
- several weeks for a full study; Strategyn says its project sprints can take as little as four weeks
- What you need
- one core job and one type of person who does it, named before any research starts · two to three dozen interviews with people who do the job (Bosch's study used 30) · a survey tool and a sample of a few hundred; according to Strategyn, its surveys reach 180 to 3,000 respondents · an analyst who can compute scores and run a segmentation on the survey data
Outcome-Driven Innovation (ODI) is a research method that finds which customer needs are important and badly served, then ranks them with a survey. It was built by Tony Ulwick, who spent a decade at IBM before founding the consultancy Strategyn in 1991. ODI is the quantitative branch of jobs to be done: it treats a job as a functional task, breaks it into steps and measures each step.
Dates differ by source. Strategyn names Cordis, a client from 1991, as its first project and 1992 as its first documented success. Ulwick’s patent on scoring desired outcomes claims priority from 1996, and Lucassen and colleagues call it “the 1996 Outcome-Driven Innovation method”. The method went public in Ulwick’s January 2002 Harvard Business Review article and his 2005 book What Customers Want.
The starting complaint is simple. Companies ask customers what they want, customers describe solutions, and the products built from those wishes often fail. Ulwick’s answer is to stop collecting solutions and collect the metrics people use to judge a job instead.
What is a desired outcome statement?
A desired outcome statement is a sentence that says how a customer measures success at one step of a job. It has a fixed structure: a direction of improvement, a metric, an object of control and, where needed, a contextual clarifier. Ulwick’s circular saw example is “minimize the likelihood that the cut goes off track”, from his 2016 CustomerThink article.
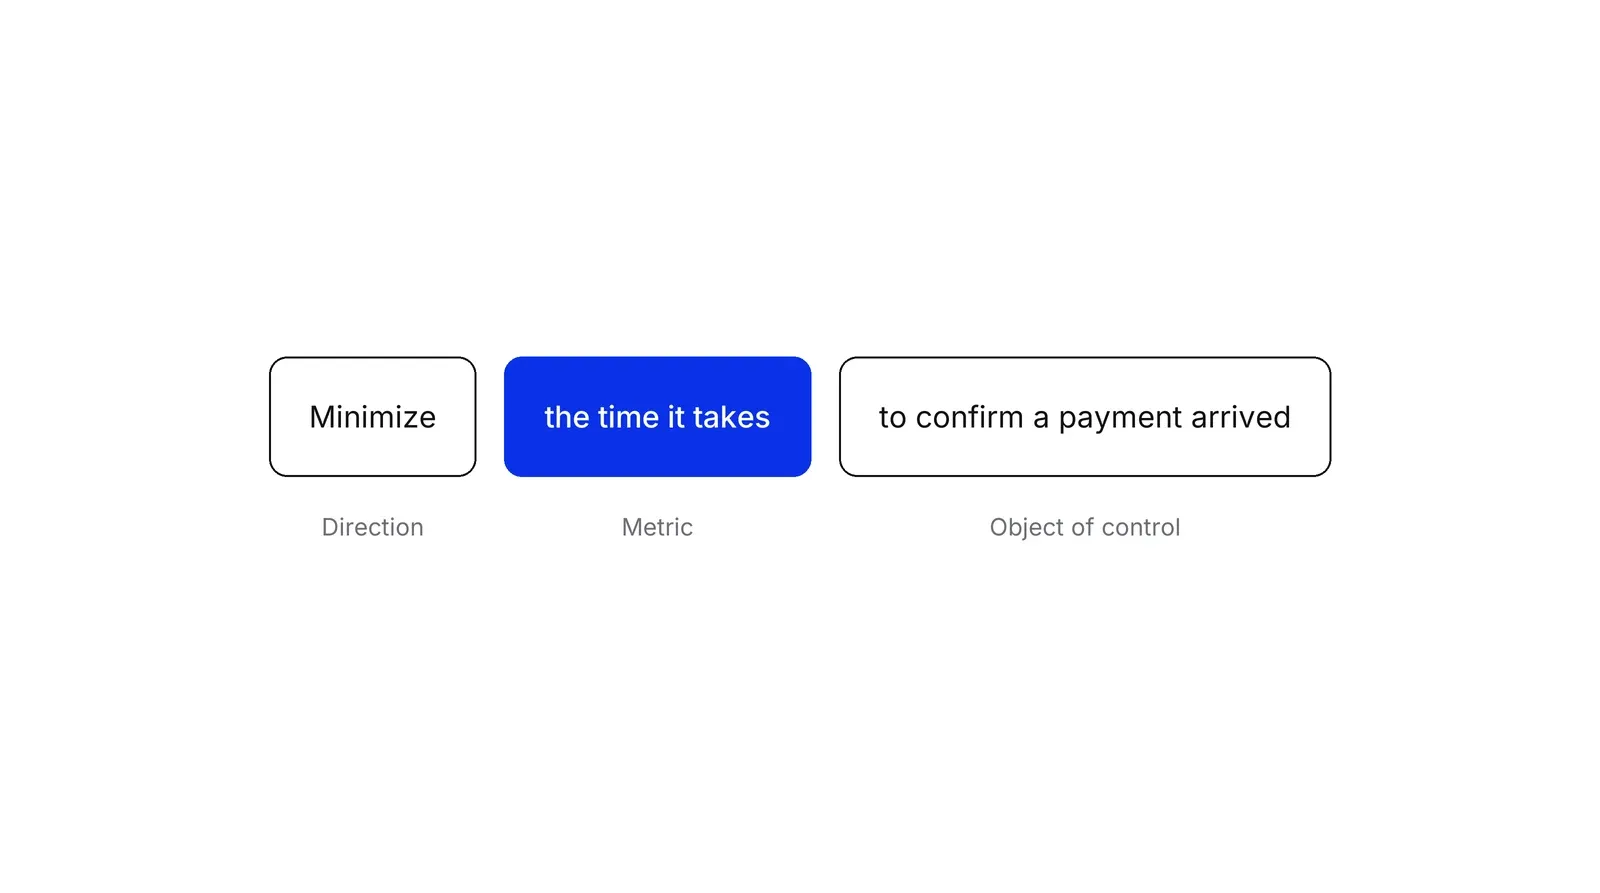
Ulwick’s published examples mostly start with “minimize” and use time or likelihood as the metric. A 2023 masterclass write-up with Ulwick shows a pet nutrition study: “minimize the time it takes to determine what nutrition is needed” for a pet’s health issues. Strategyn requires each statement to be solution-free, measurable and stable over time, and says a market typically yields 50 to 150 of them.
The strict format exists because loose wording breaks the survey. Two statements phrased differently get rated differently for reasons that have nothing to do with the need. Ulwick and Bettencourt wrote that across hundreds of companies, not even 5% agreed on what a customer need is. Their standards, set out in MIT Sloan Management Review, rest on an analysis of over 10,000 need statements.
How is the opportunity score calculated?
The opportunity score is importance + max(importance − satisfaction, 0), with both inputs on a 0 to 10 scale. Strategyn asks respondents to rate each outcome on a 1 to 5 scale and counts the share who answer 4 or 5, the top two boxes. That share divided by 10 becomes the input.
Ulwick’s worked example uses 270 circular saw users. For the off-track cut, 200 rated importance 4 or 5 (74%, so 7.4) and 75 rated satisfaction 4 or 5 (28%, so 2.8). The score is 7.4 + (7.4 − 2.8) = 12.0. Strategyn says 10 or more marks an outcome as underserved.
The formula counts importance twice and satisfaction once, by design. A simple gap, importance minus satisfaction, would rank an outcome rated 3 and 0 the same as one rated 10 and 7. ODI puts the second one far ahead. Satisfaction above importance never lowers the score below importance itself, because the max() clips the gap at zero.
Teams adapt the scales, and the numbers then stop being comparable:
| Who | Ratings | Inputs | Bands |
|---|---|---|---|
| Strategyn | 1 to 5 | Share of 4s and 5s, divided by 10 | 10 or more underserved |
| GitLab handbook | 1 to 10 | Scores on the 1 to 10 scale | 16 to 20 immediate action, 10 to 15 high priority |
| Lucassen et al., 2018 | 7-point Likert | Mean scores | Plotted, no numeric cut-off |
Reading the opportunity landscape
The opportunity landscape is a scatter chart of every outcome, with importance on the horizontal axis and satisfaction on the vertical one. The diagonal where satisfaction equals importance separates overserved outcomes above it. The line where the score equals 10 bounds the underserved area at bottom right.
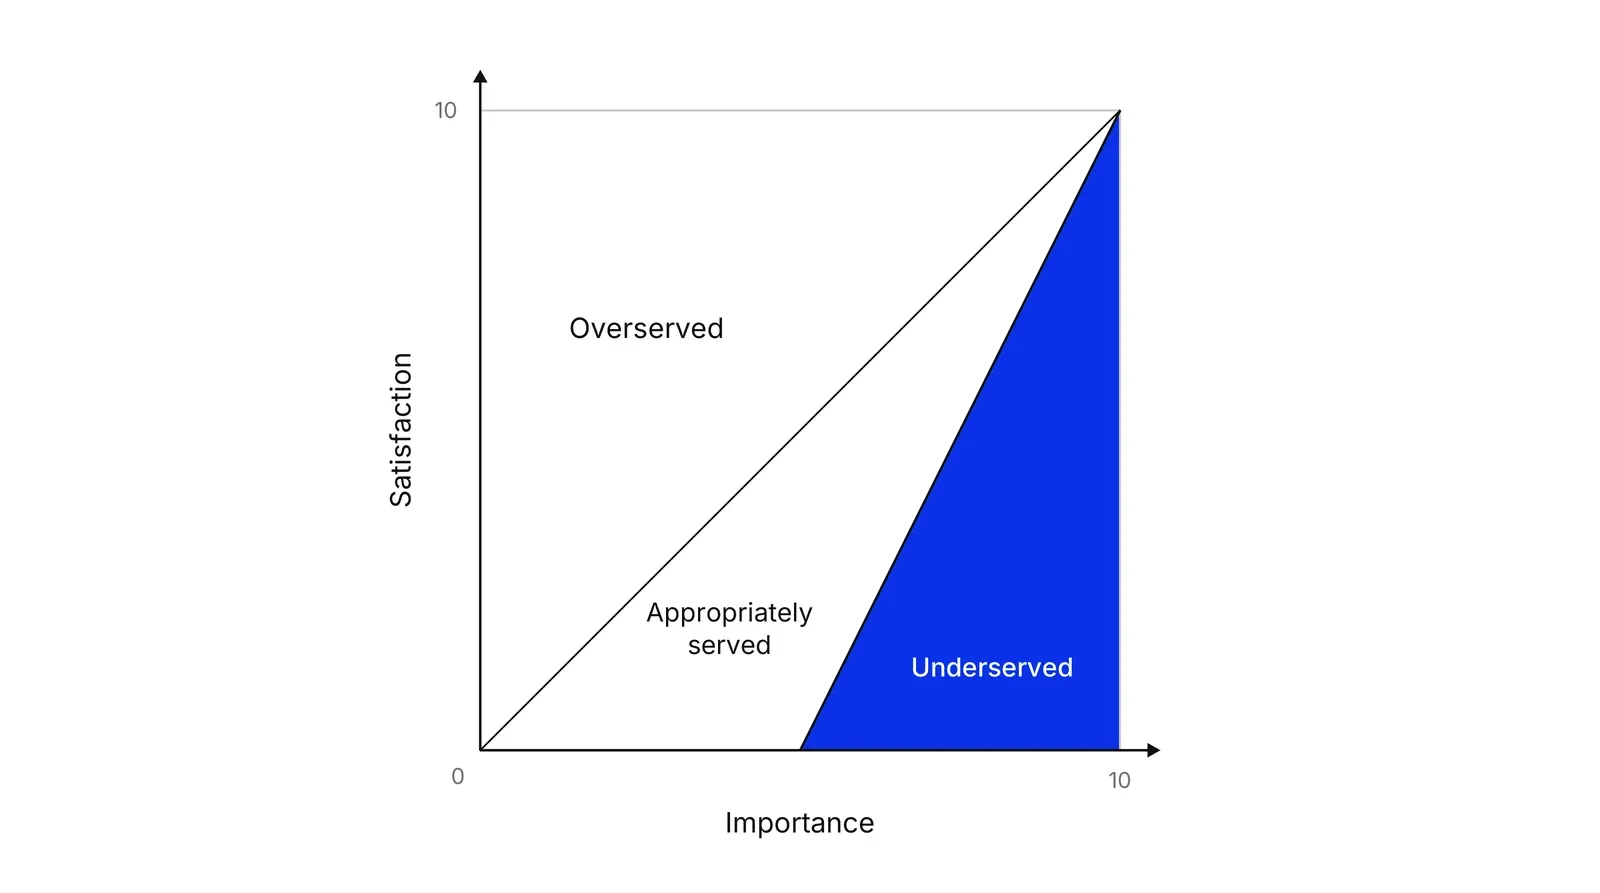
Each zone suggests a different move. Underserved outcomes are where a better product creates value. Strategyn treats overserved outcomes as targets for cost reduction and calls an overserved market ripe for disruption. Important outcomes that are already well satisfied, at top right, are table stakes: a new product must match them but wins nothing by exceeding them.
Check the axes before you read someone else’s chart. Dan Olsen’s version, described by Mind the Product, puts importance on the vertical axis, so his best opportunities sit at top left.
Segments hidden in the averages
ODI’s second claim is that unmet needs often belong to a segment, not to the whole market. In the Bosch case study, the total sample of 270 saw users showed no unmet outcomes at all. Clustering respondents by which outcomes they rated underserved found four segments. One of them, mostly finish and advanced carpenters, made up over 30% of users and had 14 of the 85 outcomes unmet.
Strategyn’s web version of the case adds that segmenting by trade or years of experience found nothing unique. Those cuts mixed the carpenters with everyone else and averaged their complaints away. Teams that run an ODI-style survey on their own often stop at the ranked list and never look for these clusters.
How strong is the evidence?
Most of the evidence for ODI comes from Strategyn. Its process page reports an 86% success rate: 18 of 21 product launches across 43 client companies, “rated successful by the sponsoring companies”. It compares this with a 17% industry average drawn from 12 outside sources. The Cordis and Bosch results are also told by the firm that ran the projects, and its pages disagree on Cordis’s starting share.
Independent work shows the method can be applied, not that it predicts success. A Journal of Cleaner Production study used an ODI-inspired survey to find 30 needs around TV use, 11 of them poorly met. An ICIS 2025 paper applied ODI to sports wearables at a German manufacturer. Lucassen’s team ran it with 10 survey responses. We found no study that tests whether high opportunity scores lead to more successful products than other ways of choosing.
Use ODI when you need a ranked list of needs and can survey enough people to trust it. For the story behind a purchase, pair it with interviews. In our Growth Lab work, a top-scoring outcome becomes a hypothesis with a metric already attached, which is the part of ODI most teams can adopt at once.
How to apply Outcome-Driven Innovation (ODI), step by step
- Define the market as a job. Write down who does the job and what the core job is, with no product in the sentence: 'surgeons restoring blood flow in an artery', not 'buyers of balloon catheters'. Strategyn defines a market as a job executor plus the job. Result: one solution-free sentence that sets the scope of the study.
- Map the job step by step. Interview people who do the job and lay out what they do from start to finish. Strategyn's universal job map has eight steps: define, locate, prepare, confirm, execute, monitor, modify and conclude. Result: a job map with the steps in the order customers follow them.
- Write desired outcome statements. For each step, turn what interviewees said into statements of how they judge success: a direction, a metric, an object of control and, if needed, a context. Keep the wording identical in structure across all statements. Result: a list of 50 to 150 outcome statements, none naming a feature.
- Survey importance and satisfaction. Ask a few hundred people who do the job to rate each outcome for importance and for satisfaction with how they do it today. Strategyn's version uses 1 to 5 scales and counts the share who answer 4 or 5. Result: two percentages per outcome, converted to a 0 to 10 scale.
- Score and plot the outcomes. Compute importance + max(importance − satisfaction, 0) for each outcome and plot all of them on an importance by satisfaction chart. Ulwick treats 10 or more as underserved; outcomes where satisfaction beats importance are overserved. Result: a ranked list and an opportunity landscape.
- Find segments and aim the team. Cluster respondents by which outcomes they find underserved, not by age, title or company size. Pick the segment you can serve best and generate ideas against its top outcomes only. Result: a target segment and a short list of outcomes the product must improve.
Examples
Bosch CS20 circular saw (as reported by Strategyn)
In 2001 Bosch decided to enter the North American professional circular saw market, seen as mature. According to Strategyn's case study, the team interviewed 30 users about cutting wood in a straight line, wrote 85 desired outcomes and had 270 users rate them. Across all users no outcome stood out as unmet. Segmenting by unmet outcomes found, according to Strategyn, a group of mostly finish and advanced carpenters, over 30% of users, with 14 underserved outcomes. Bosch designed the CS20 saw around them. These figures come from the consultancy that ran the project.
Cordis angioplasty balloons (as reported by Strategyn)
According to Strategyn, Cordis, a Florida medical device maker, became its client in 1991. Interviews covered the outcomes cardiologists, nurses and lab staff wanted when restoring blood flow in an artery. Strategyn says Cordis then launched 19 balloon products, all ranked first or second in their market, and grew its share to over 20%. Strategyn's pages give the starting share as less than 1% in one place and 2% in a client quote in another.
A payments provider for small importers
Illustrative, arithmetic only. A cross-border payments company surveys 300 small importers. For 'minimize the time it takes to confirm a supplier received a payment', 82% rate importance 4 or 5 and 35% rate satisfaction 4 or 5: 8.2 + (8.2 − 3.5) = 12.9, underserved. For 'minimize the number of steps to add a new payee', the figures are 45% and 70%: 4.5 + 0 = 4.5, overserved. The team funds payment tracking and stops polishing the payee form.
When to use it
Use it when a company needs to decide which of many customer needs to build for, in a market where the obvious needs are already met: a mature category, a crowded B2B niche, a new product line from an established firm. It fits teams that can afford a survey of a few hundred people and want a ranked, defensible list.
When not to use it
Skip it before you know who does the job or why people switch; start with interviews instead. It is heavy for an early startup with a handful of customers, since a 100-statement survey on 15 respondents will not give stable scores. It also says little about emotional and social reasons for buying, which the progress school of JTBD covers better.
Common mistakes
- Writing outcome statements that name a solution ('add a mobile app') or mix two metrics in one line. Respondents then rate the idea, not the need.
- Reading only whole-market averages. In Strategyn's Bosch study the total market showed no unmet outcome; the opportunity sat in one segment.
- Comparing scores across studies that used different scales. A 12 on a 1 to 5 top-two-box survey is not a 12 on a 1 to 10 mean-score survey.
- Treating small differences as real. With a few dozen respondents, 10.4 and 9.8 are the same result.
- Ignoring overserved outcomes. Strategyn reads them as targets for cost cuts and as signs a market is open to a cheaper entrant.
FAQ
What is a good opportunity score in ODI?
In Strategyn's scheme, a score of 10 or more marks an outcome as underserved. Ulwick's Jobs to be Done book, as summarized in a 2023 masterclass write-up, calls scores above 12 high and above 15 extreme. The thresholds assume 1 to 5 ratings converted to a 0 to 10 scale; other scales need their own cut-offs.
What is an example of a desired outcome statement?
Ulwick's own circular saw example is 'minimize the likelihood that the cut goes off track'. It names a direction (minimize), a metric (likelihood), and what the customer controls (the cut going off track). Statements contain no solution, so they stay valid as products change.
How many survey respondents does ODI need?
According to Strategyn, its surveys typically go to 180 to 3,000 respondents; the Bosch study used 270. Academic applications have used far fewer, such as 10 responses in a 2018 requirements-engineering case, which is enough to test the method but not to rank 50 outcomes with confidence.
Is Outcome-Driven Innovation the same as jobs to be done?
No. Jobs to be done is the broader theory that people hire products to get jobs done. ODI is Ulwick's specific process for applying it, built on job maps, outcome statements and a quantitative survey. Other practitioners apply the same theory through qualitative switch interviews instead.
Sources
- Anthony W. Ulwick, Turn Customer Input into Innovation, Harvard Business Review, January 2002
- Lance A. Bettencourt, Anthony W. Ulwick, The Customer-Centered Innovation Map, Harvard Business Review, May 2008
- Anthony W. Ulwick, Lance A. Bettencourt, Giving Customers a Fair Hearing, MIT Sloan Management Review, Spring 2008
- Tony Ulwick, What Unmet Needs Should Be Targeted for Growth?, CustomerThink, August 2016
- Strategyn, Outcome-Driven Innovation
- Strategyn, The Outcome-Driven Innovation Process
- Strategyn, Quantify Your Customers' Unmet Needs
- Strategyn, Market Opportunity
- Strategyn, Jobs-to-be-Done: overview and universal job map
- Strategyn, Jobs-to-be-Done Theory and Methodology
- Strategyn, History of Jobs-to-be-Done
- Strategyn, About Us
- Strategyn, Bosch case study
- Strategyn, Creating the Bosch CS20 Circular Saw, case study PDF
- Strategyn, Cordis case study
- Google Patents, US7340409B1, Anthony W. Ulwick, Computer based process for strategy evaluation and optimization based on customer desired outcomes and predictive metrics
- The Product Compass, Paweł Huryn, Jobs-to-be-Done Masterclass with Tony Ulwick and Sabeen Sattar, November 2023
- Lucassen, van de Keuken, Dalpiaz, Brinkkemper et al., Jobs-to-be-Done Oriented Requirements Engineering: A Method for Defining Job Stories, REFSQ 2018
- Hankammer, Brenk, Fabry, Nordemann, Piller, Towards Circular Business Models: Identifying Consumer Needs Based on the Jobs-to-Be-Done Theory, Journal of Cleaner Production, 2019
- Sebastian Brenk, Stefan Raff-Heinen, Outcome-Driven Innovation and Smart Product-Service Systems: Case Evidence from a Sports Goods Manufacturer, ICIS 2025 Proceedings
- GitLab Handbook, JTBD Research Playbook
- Mind the Product, Prioritising Customer Needs with Dan Olsen, September 2022
Last updated Oct 9, 2026


Marketing agency or growth system: when a company outgrows its agency
An agency is the right call while the founder still runs most of the company. Once the business starts copying itself into new locations or markets, it needs a system that sets goals, tests hypotheses and owns the result.

Why healthcare marketing agencies stall: the short, mid and long wins model we use with clinics
Most agencies own the click and nobody owns the front desk. How we structure clinic work in three horizons, the research behind each one, and one year of results.

Why channel tests stall after month three
Most paid channel tests do not end with a decision. They end when the budget runs out, the attribution model changes, or everyone quietly stops looking at the dashboard.