Experimentation program
An experimentation program is the set of metrics, tools, trust checks and team roles that lets a company run dozens of A/B tests a month and act on results it can trust.
An experimentation program is the operating system behind A/B testing at scale: one agreed success metric called the overall evaluation criterion (OEC), guardrail metrics that must not get worse, automatic trust checks such as sample ratio mismatch, and clear owners for running and reading tests. Ron Kohavi, Diane Tang and Ya Xu describe how companies build one in four phases: crawl, walk, run and fly.
- Origin
- Ron Kohavi, Diane Tang and Ya Xu (book); Aleksander Fabijan and colleagues (crawl, walk, run, fly model); Kohavi and Stefan Thomke (HBR), 2017 to 2020
- Level
- 301 · Advanced
- Fits
- Scale-up
- Time to apply
- a month to agree the OEC and run the first trustworthy tests; a year or more to reach the run phase
- What you need
- thousands of users or sessions a week on the product you want to test · event logging that a person outside the feature team can read · an analyst who understands randomization, confidence intervals and A/A tests · an executive who will accept a test result that contradicts their opinion
An experimentation program is the set of metrics, tools, checks and roles that lets a company run many A/B tests at once and act on the results without arguing about them. The standard reference is Trustworthy Online Controlled Experiments (Cambridge University Press, 2020) by Ron Kohavi, Diane Tang and Ya Xu, who built testing systems at Microsoft, Google and LinkedIn. Their summary of the problem: getting numbers is easy, getting numbers you can trust is hard.
A single A/B test needs an analyst. Thirty tests a month need a system, or teams start shipping on results that are broken, conflicting or cherry-picked.
Why one test at a time is not enough
Most ideas do not work, so a company has to test many of them to find the few that do. Kohavi and Stefan Thomke reported in Harvard Business Review in 2017 that about one third of Microsoft’s experiments improved their target metric, one third were neutral and one third hurt it. At Google and Bing only 10% to 20% came out positive. The same article says Microsoft, Amazon, Booking.com, Facebook and Google each ran more than 10,000 controlled experiments a year.
The returns come from volume. The authors’ best-known case is a Bing ad headline change that sat unbuilt for six months and then raised revenue 12% once someone tested it. They draw the lesson in the book’s first chapter: the overhead of running an experiment must be small, or good ideas never get tried.
The book names three tenets a company needs before a program can work. It wants data-driven decisions and has a formal OEC. It will invest in infrastructure and in checks that make results trustworthy. And it accepts that it is poor at judging ideas in advance.
The four maturity phases: crawl, walk, run, fly
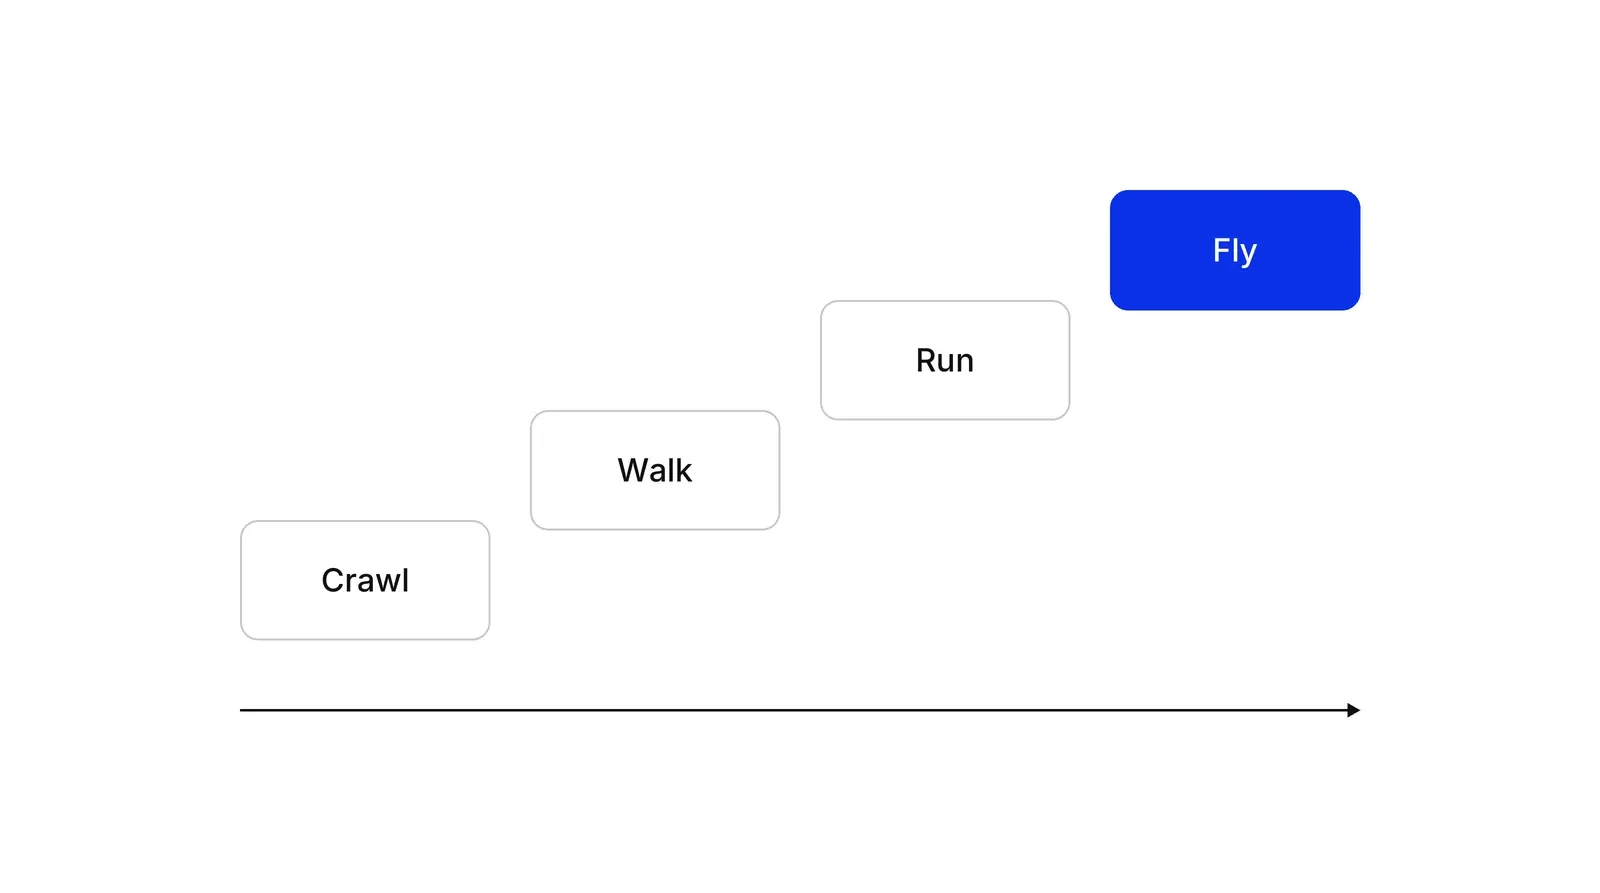
A program grows in phases, and skipping one leaves a gap the next phase falls into. Aleksander Fabijan, Pavel Dmitriev, Helena Holmström Olsson and Jan Bosch described the four phases in a 2017 ICSE paper based on Microsoft’s experience, and the book’s fourth chapter opens with the same model.
| Phase | What gets built | Who runs tests | State of the OEC |
|---|---|---|---|
| Crawl | Readable event logging; first tests run by hand, no platform yet | A data science team | A first version from a few key signals |
| Walk | Metrics built from events; a platform with power analysis and A/A tests | Product managers set tests up, analysts run them | Success, guardrail and data quality metrics |
| Run | Alerting, gradual ramp-up from a small share of traffic, protection from carry-over effects | Product teams run their own tests; analysts review | Tuned toward one weighted metric |
| Fly | Automatic shutdown of harmful tests, interaction detection, a searchable experiment log | Product teams, with central review on request | Stable, changed about once a year |
The paper puts the move into the run phase at roughly 100 experiments a year, the point where manual review stops working. In the fly phase thousands run at the same time and almost every change, down to bug fixes, ships through a test.
The OEC: one number every test answers to
An overall evaluation criterion (OEC) is the quantitative measure every experiment is judged on. It must move within a one-to-two-week test and predict long-term success. Without it, each team picks the metric that makes its own test look good.
Choosing it takes argument. Bing’s long-term goals are query share and ad revenue, but worse search results would push both up for a while, because users search again and click more ads. Bing’s leaders settled on fewer queries per task and more tasks per user instead, HBR reports. The book rules out profit as an OEC for the same reason: raising prices lifts it this quarter and loses customers next year.
The 2019 summit paper from 34 experts across companies including Airbnb, Google, Netflix and Uber lists four properties of a good OEC: it predicts long-term results, it is hard to game, it is sensitive enough to move in a normal test, and it is cheap to compute. Kohavi and Thomke recommend adjusting it once a year.
Guardrails and trust checks
Guardrail metrics are measures a test is not trying to improve but must not harm. Alex Deng and Xiaolin Shi’s 2016 KDD paper gives revenue per user and page latency as typical examples. Trust checks sit one level lower: they ask whether the experiment itself worked before anyone reads its outcome.
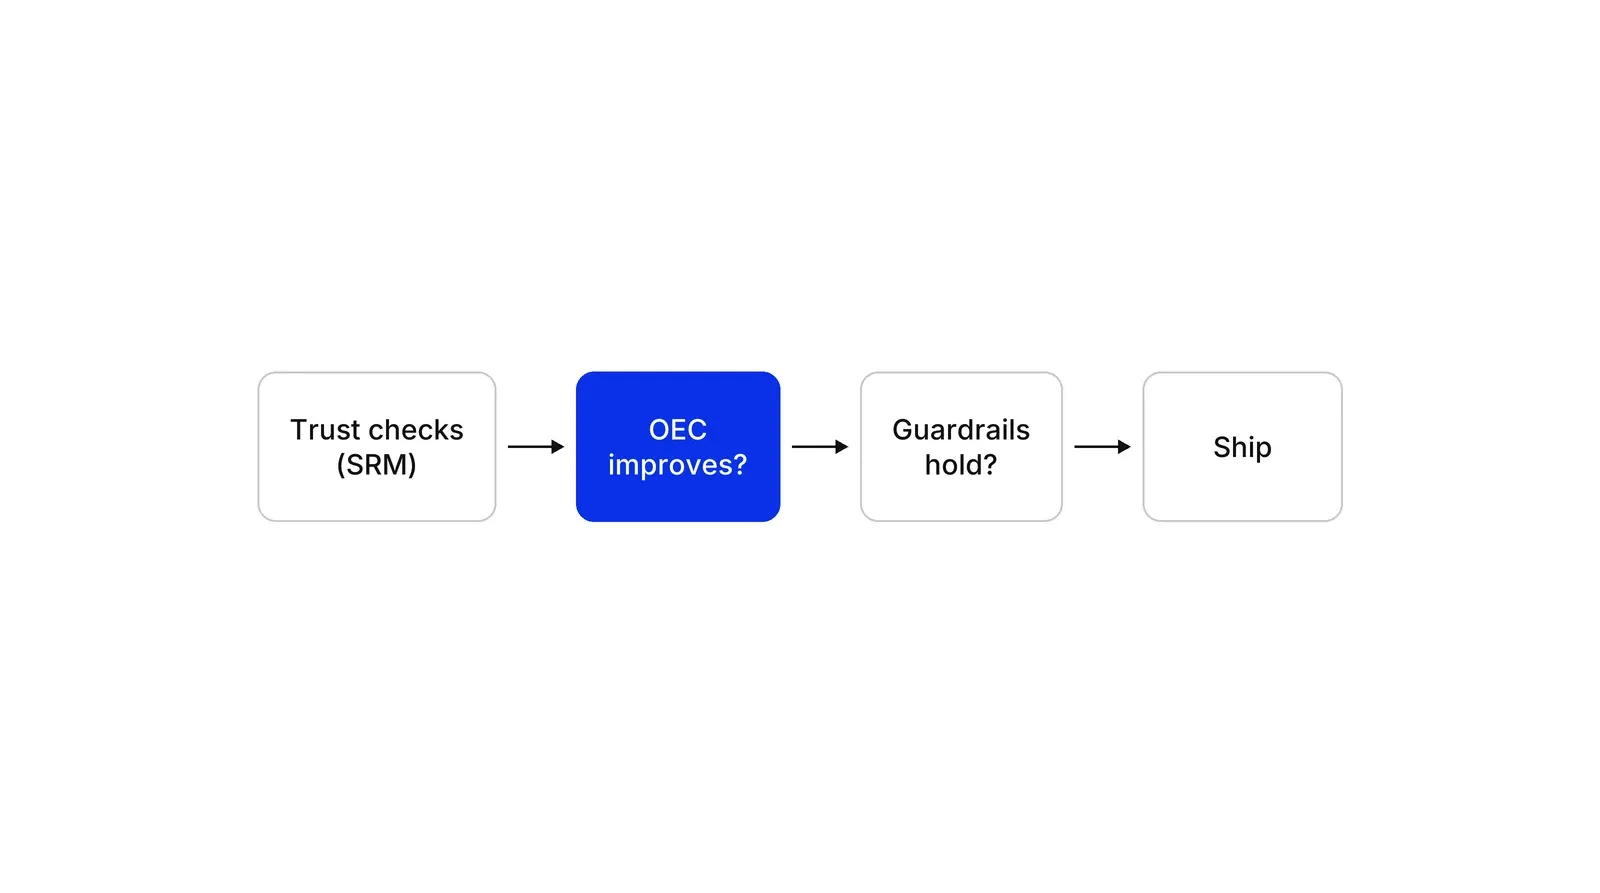
The most common trust check is sample ratio mismatch (SRM): a gap between the traffic split you set and the split you got. A 2019 Microsoft and Booking.com study gives an example: 821,588 users against 815,482 looks like 50.2/49.8, yet the odds of that under a true 50/50 split are below 1 in 500,000. About 6% of Microsoft’s experiments showed an SRM, the study found, and in most cases it invalidates the result.
Spotify publishes its ship rule. A change goes out only if it beats control on at least one success metric, is not worse on any guardrail, and passes every quality test, SRM included, according to Mårten Schultzberg and colleagues. The rule is fixed before the test starts. How many users a test needs to detect a given effect is a separate question, covered on the minimum detectable effect page.
Who runs the program
HBR describes three ways to organize the people. A central team serves the whole company and builds good tools but can feel remote from product goals. Analysts spread through business units know their domain but lack career paths and shared tooling. A center of excellence, the model Microsoft uses, keeps a platform team in the middle and analysts in product teams.
Small companies usually start central or with a third-party tool, then move analysts into teams as volume grows. Booking.com went furthest, letting anyone own an experiment end to end with safeguards and a shared repository of results, as Raphael Lopez Kaufman and colleagues describe.
The experiment log is what turns tests into a program. A searchable record of every hypothesis, result and decision stops teams from repeating old tests and shows which kinds of ideas tend to win. Ideas enter the queue ranked with ICE scoring, and each result feeds the next hypothesis in a HADI loop, the weekly cycle our Growth Lab runs on.
How to apply Experimentation program, step by step
- Agree the OEC. Sit the strategy owner and the analyst together and choose one metric, or a weighted combination, that every test will be judged on. It must move within one to two weeks and predict the long-term goal. Write down why you rejected the obvious candidates, such as revenue alone. Result: a one-line OEC definition that the leadership team has signed off.
- Fix logging and run A/A tests. Give events consistent names across products, then split users into two identical groups and check that the system reports no significant difference about 95% of the time, according to Kohavi and Thomke. Result: proof that the pipeline does not invent effects before any real test runs.
- Set guardrails and automatic trust checks. List the metrics no test may harm, such as revenue per user, page load time or complaint rate, and add a sample ratio mismatch check to every scorecard. Decide in advance what blocks a launch. Result: a written ship rule that applies to every test.
- Build one backlog and one review rhythm. Put every test idea in a single queue with a hypothesis, the OEC movement expected and an owner, rank it with a simple score such as ICE, and review results weekly. Result: a steady flow of tests instead of bursts tied to whoever shouts loudest.
- Choose a team model. Start with a central team or a third-party tool, then move analysts into product teams as volume grows, keeping a small central group for the platform and methods. Result: named owners for running tests, reading results and maintaining the platform.
- Keep an experiment log. Record every test with its hypothesis, dates, segments, result and decision in a searchable place, and review it each quarter for patterns. Result: an institutional memory that stops teams from rerunning old tests and shows which kinds of ideas tend to win.
Examples
Bing ad headlines, a documented case
In 2012 a Microsoft employee proposed showing longer ad headlines on Bing. The idea sat in the backlog for more than six months as low priority, until an engineer ran a simple A/B test. Revenue rose 12%, over $100 million a year in the US, according to Kohavi and Thomke in Harvard Business Review. The result first triggered a 'too good to be true' alert, and the program's OEC mattered: Bing judges tests on revenue weighed against user experience metrics such as sessions per user, and those did not degrade. A low-cost testing platform turned a forgotten idea into the best revenue result in Bing's history.
A payments app adding guardrails
Illustrative. A consumer payments app with 400,000 weekly active users tests a shorter sign-up flow. The OEC is the share of new users who complete a first transfer within seven days. Guardrails are the fraud review rate and support tickets per 1,000 users. The shorter flow lifts first transfers, but the fraud review rate rises past the agreed limit, so the team does not ship. It reruns the test with one identity step restored. Without a guardrail written in advance, the conversion gain would have been shipped and the cost found later in chargebacks.
A telehealth service catching a broken split
Illustrative. A telehealth booking site splits visitors 50/50 to test a new doctor-profile page. After a week the scorecard shows 52,400 users in control and 50,100 in treatment. The sample ratio mismatch check flags it: the gap is far too large to be chance. The cause is a redirect on the new page that drops some visitors before they are logged. The team fixes the redirect and restarts the test instead of reporting a lift that came from losing part of one group.
When to use it
Use it once a company runs, or wants to run, more than a handful of A/B tests a month across more than one team, when results start to conflict, nobody trusts the numbers, or tests stall waiting for an analyst. It suits digital products with thousands of users a week: marketplaces, fintech and consumer apps, SaaS products, content sites.
When not to use it
Skip a formal program when traffic is too low to detect realistic effects; a B2B product with 300 accounts learns more from customer interviews and staged rollouts. It also does not fit decisions that cannot be split between groups, such as a merger, a rebrand or a price change where customers will compare notes. For a single test, a careful analyst and a sample size calculation are enough.
Common mistakes
- Using revenue or profit alone as the OEC. Short-term tricks such as more ads or higher prices raise it while driving users away; Kohavi, Tang and Xu warn against exactly this.
- Reading the OEC before the trust checks. A sample ratio mismatch in most cases invalidates the result, so a lift in a broken test is noise.
- Writing the ship rule after seeing the data. Decide which success metric must improve and which guardrails must hold before the test starts.
- Expecting most tests to win. At Microsoft about one third of tests were positive, and at Google and Bing 10% to 20%; a program that reports mostly wins is probably not checking its results.
- Jumping from a few tests a year to hundreds without the platform features each phase needs, such as alerting and automatic shutdown, which leaves harmful tests running on real users.
FAQ
What is an experimentation program?
It is the system that lets a company run many controlled experiments and trust the results. It combines an agreed success metric (the OEC), guardrail metrics, automated data quality checks, an experimentation platform, a backlog and review rhythm, and defined roles. Kohavi, Tang and Xu's 2020 book Trustworthy Online Controlled Experiments is the standard reference.
What is an overall evaluation criterion (OEC)?
An OEC is the quantitative measure every experiment is judged on, chosen because it moves within the test period and predicts long-term success. It can combine several metrics. Bing's OEC weighs revenue against user experience measures such as sessions per user. Kohavi and Thomke recommend revisiting it once a year.
What are guardrail metrics in A/B testing?
Guardrail metrics are measures a test is not trying to improve but must not harm, such as page load time, revenue per user or complaint rate. Spotify's published decision rule ships a change only if it beats control on a success metric and is not worse than control on any guardrail.
What is sample ratio mismatch (SRM)?
SRM is a gap between the traffic split you configured and the split you observe, for example 50.2% against 49.8% on 1.6 million users. A chi-square test shows whether the gap is too large to be chance. According to Microsoft and Booking.com researchers, about 6% of Microsoft experiments had an SRM, which usually means the result cannot be trusted.
What are the crawl, walk, run and fly phases?
They are the four maturity phases in Aleksander Fabijan and colleagues' 2017 model, used in Kohavi, Tang and Xu's book. Crawl builds logging and runs first tests by hand. Walk adds metrics and a platform with A/A tests. Run scales beyond about 100 tests a year with alerting. Fly tests nearly every change automatically.
Sources
- Ron Kohavi, Diane Tang, Ya Xu, Trustworthy Online Controlled Experiments: A Practical Guide to A/B Testing, Cambridge University Press, 2020
- Kohavi, Tang, Xu, the book's website, experimentguide.com
- Kohavi, Tang, Xu, Chapter 1: Introduction and Motivation (free PDF)
- Cambridge University Press, Chapter 4: Experimentation Platform and Culture (abstract)
- Cambridge University Press, Chapter 7: Metrics for Experimentation and the Overall Evaluation Criterion (abstract)
- Cambridge University Press, Chapter 8: Institutional Memory and Meta-Analysis (abstract)
- Ron Kohavi, Stefan Thomke, The Surprising Power of Online Experiments, Harvard Business Review, September-October 2017
- Aleksander Fabijan, Pavel Dmitriev, Helena Holmström Olsson, Jan Bosch, The Evolution of Continuous Experimentation in Software Product Development, ICSE 2017
- Aleksander Fabijan et al., Diagnosing Sample Ratio Mismatch in Online Controlled Experiments: A Taxonomy and Rules of Thumb for Practitioners, KDD 2019
- Aleksander Fabijan et al., Three Key Checklists and Remedies for Trustworthy Analysis of Online Controlled Experiments at Scale, ICSE-SEIP 2019
- Nanyu Chen, Min Liu, Ya Xu, Automatic Detection and Diagnosis of Biased Online Experiments, arXiv, 2018
- Pavel Dmitriev, Somit Gupta, Dong Woo Kim, Garnet Vaz, A Dirty Dozen: Twelve Common Metric Interpretation Pitfalls in Online Controlled Experiments, KDD 2017
- Alex Deng, Xiaolin Shi, Data-Driven Metric Development for Online Controlled Experiments: Seven Lessons Learned, KDD 2016
- Somit Gupta, Ronny Kohavi, Diane Tang, Ya Xu et al., Top Challenges from the first Practical Online Controlled Experiments Summit, SIGKDD Explorations 21(1), 2019
- Mårten Schultzberg, Sebastian Ankargren, Mattias Frånberg, Risk-aware product decisions in A/B tests with multiple metrics, Spotify Engineering, 2024
- Tong Xia, Sumit Bhardwaj, Pavel Dmitriev, Aleksander Fabijan, Safe Velocity: A Practical Guide to Software Deployment at Scale using Controlled Rollout, ICSE-SEIP 2019
- Ron Kohavi, Roger Longbotham, Dan Sommerfield, Randal M. Henne, Controlled experiments on the web: survey and practical guide, Data Mining and Knowledge Discovery 18(1), 2009
- Ron Kohavi, Randal M. Henne, Dan Sommerfield, Practical Guide to Controlled Experiments on the Web: Listen to Your Customers not to the HiPPO, KDD 2007
- Ron Kohavi, Roger Longbotham, Online Experiments: Lessons Learned, IEEE Computer, 2007
- ExP Platform (Ron Kohavi), HiPPO FAQ
- Aleksander Fabijan, Pavel Dmitriev, Helena Holmström Olsson, Jan Bosch, The Benefits of Controlled Experimentation at Scale, SEAA 2017
- Stefan Thomke, Building a Culture of Experimentation, Harvard Business Review, March-April 2020
- Raphael Lopez Kaufman, Jegar Pitchforth, Lukas Vermeer, Democratizing online controlled experiments at Booking.com, arXiv, 2017
- Ya Xu et al., From Infrastructure to Culture: A/B Testing Challenges in Large Scale Social Networks, KDD 2015
- Diane Tang, Ashish Agarwal, Deirdre O'Brien, Mike Meyer, Overlapping Experiment Infrastructure: More, Better, Faster Experimentation, KDD 2010, Google Research
Last updated Oct 9, 2026


Marketing agency or growth system: when a company outgrows its agency
An agency is the right call while the founder still runs most of the company. Once the business starts copying itself into new locations or markets, it needs a system that sets goals, tests hypotheses and owns the result.

Why healthcare marketing agencies stall: the short, mid and long wins model we use with clinics
Most agencies own the click and nobody owns the front desk. How we structure clinic work in three horizons, the research behind each one, and one year of results.

Why channel tests stall after month three
Most paid channel tests do not end with a decision. They end when the budget runs out, the attribution model changes, or everyone quietly stops looking at the dashboard.