Value chain analysis
Value chain analysis splits a company into the nine activities that produce what it sells, so you can see which ones earn the margin and which ones eat it.
Value chain analysis is a method for breaking a company into nine activities, five primary (inbound logistics, operations, outbound logistics, marketing and sales, service) and four support (procurement, technology development, human resource management, firm infrastructure), then costing each one and asking what it adds for the customer. Michael Porter introduced it in his 1985 book Competitive Advantage to find where margin is created or lost.
- Origin
- Michael E. Porter, 1985
- Level
- 201 · Tool
- Fits
- Scale-up, Enterprise
- Time to apply
- two to three days for a first map with real cost data; one workshop for a rough version
- What you need
- a profit and loss statement for the last twelve months, broken down as far as your accounts allow · one owner per activity who knows what the work costs and who does it · a clear statement of whether you compete on lower cost or on being different
Value chain analysis is a method for splitting a company into the activities that produce what it sells, then checking each one for two things: what it costs and what it adds for the customer. Michael Porter of Harvard Business School set it out in Competitive Advantage, published by Free Press in 1985. Porter’s research group at Harvard describes the chain as “the activities involved in delivering value to customers,” and says advantage comes from activities that let a company charge more or spend less than rivals.
Porter was not alone that year. Bruce Kogut published a “value-added chain” in MIT Sloan Management Review in the summer of 1985, using it to decide which links a company should own and in which country to place them. Porter and Victor Millar also applied the chain to information technology in Harvard Business Review that July. Porter’s version became the standard, and his nine categories are what most teams draw today.
The tool answers a different question from Porter’s five forces. Five forces asks whether an industry is worth competing in. The value chain asks where, inside your own company, the money is made and where it leaks out.
The nine activities
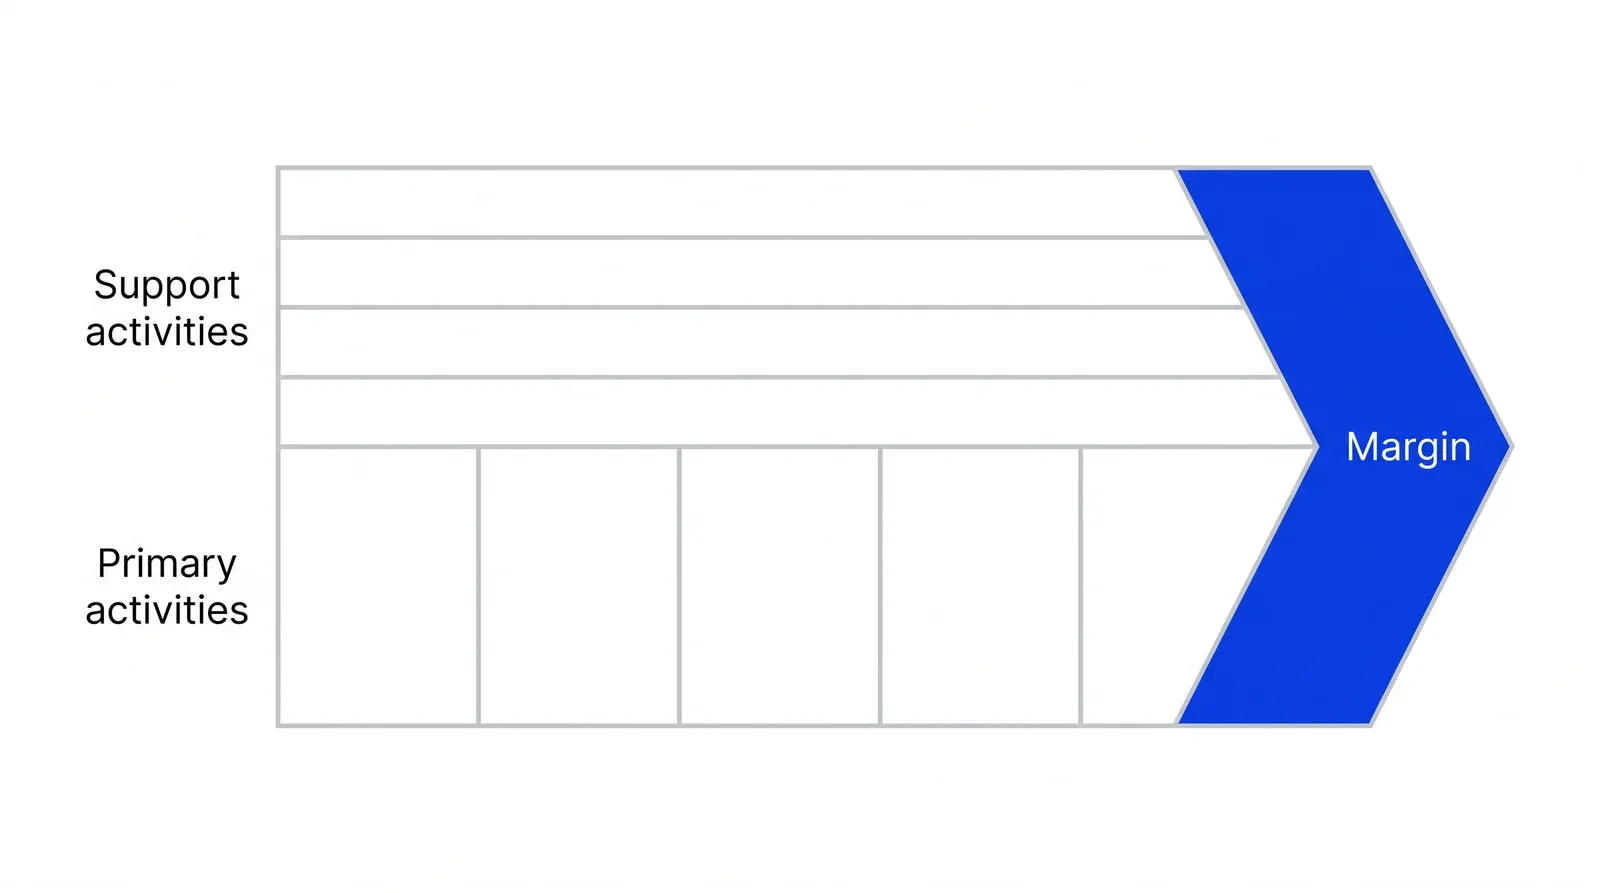
Porter’s chain has five primary activities, which make and deliver the product, and four support activities, which make the primary ones possible. The definitions below follow the University of Cambridge Institute for Manufacturing and Harvard Business School Online.
| Activity | Type | What it covers | In a clinic network |
|---|---|---|---|
| Inbound logistics | Primary | Receiving, storing and distributing inputs | Supplies, referrals in, booking slots |
| Operations | Primary | Turning inputs into the product or service | The appointment, tests, procedures |
| Outbound logistics | Primary | Getting the output to the buyer | Test results, prescriptions, referrals out |
| Marketing and sales | Primary | Informing buyers and making it easy to buy | Ads, call center, price list |
| Service | Primary | Keeping the product working after the sale | Follow-up calls, rebooking, complaints |
| Procurement | Support | Buying inputs of every kind | Contracts with labs and suppliers |
| Technology development | Support | Know-how, software, process design | Booking system, clinical protocols |
| Human resource management | Support | Hiring, training, paying people | Doctor recruitment and pay |
| Firm infrastructure | Support | Finance, legal, planning, general management | Licensing, accounting, head office |
Support activities sit across the top of Porter’s diagram because each one serves several primary ones. A booking system supports inbound logistics, marketing and service at once.
Where margin comes from
Margin, in Porter’s terms, is the gap between what buyers will pay and the total cost of performing all nine activities. There are two ways to widen it. You can perform activities more cheaply than rivals, or you can perform them in a way buyers will pay more for. Harvard Business School Online calls these cost advantage and differentiation, and IBM’s guide asks teams to pick one as the primary goal before they start, because the same activity can look wasteful under one goal and essential under the other.
Porter’s 1996 article “What Is Strategy?” adds the point most teams miss: advantage comes from how activities fit together, and “the essence of strategy is choosing what not to do.”
How to find where margin is created or lost
Start by putting a cost on every activity. Michael Hergert and Deigan Morris showed in Strategic Management Journal in 1989 that accounting systems collect costs by department and expense type, which hides the cost of each activity. You will need to reallocate the profit and loss statement by hand, splitting salaries by time spent.
Then look for cost drivers, the causes behind each number. Porter’s book lists ten, among them scale, learning, capacity utilization, location and linkages between activities. A clinic’s operations cost per visit depends far more on how full the doctors’ schedules are than on rent.
For differentiation, ask the reverse question: which activities make customers choose you and pay your price? John Shank and Vijay Govindarajan, in a 1992 field study in the Journal of Management Accounting Research, found that building a value chain produced different cost conclusions than conventional cost analysis or a growth-share matrix.
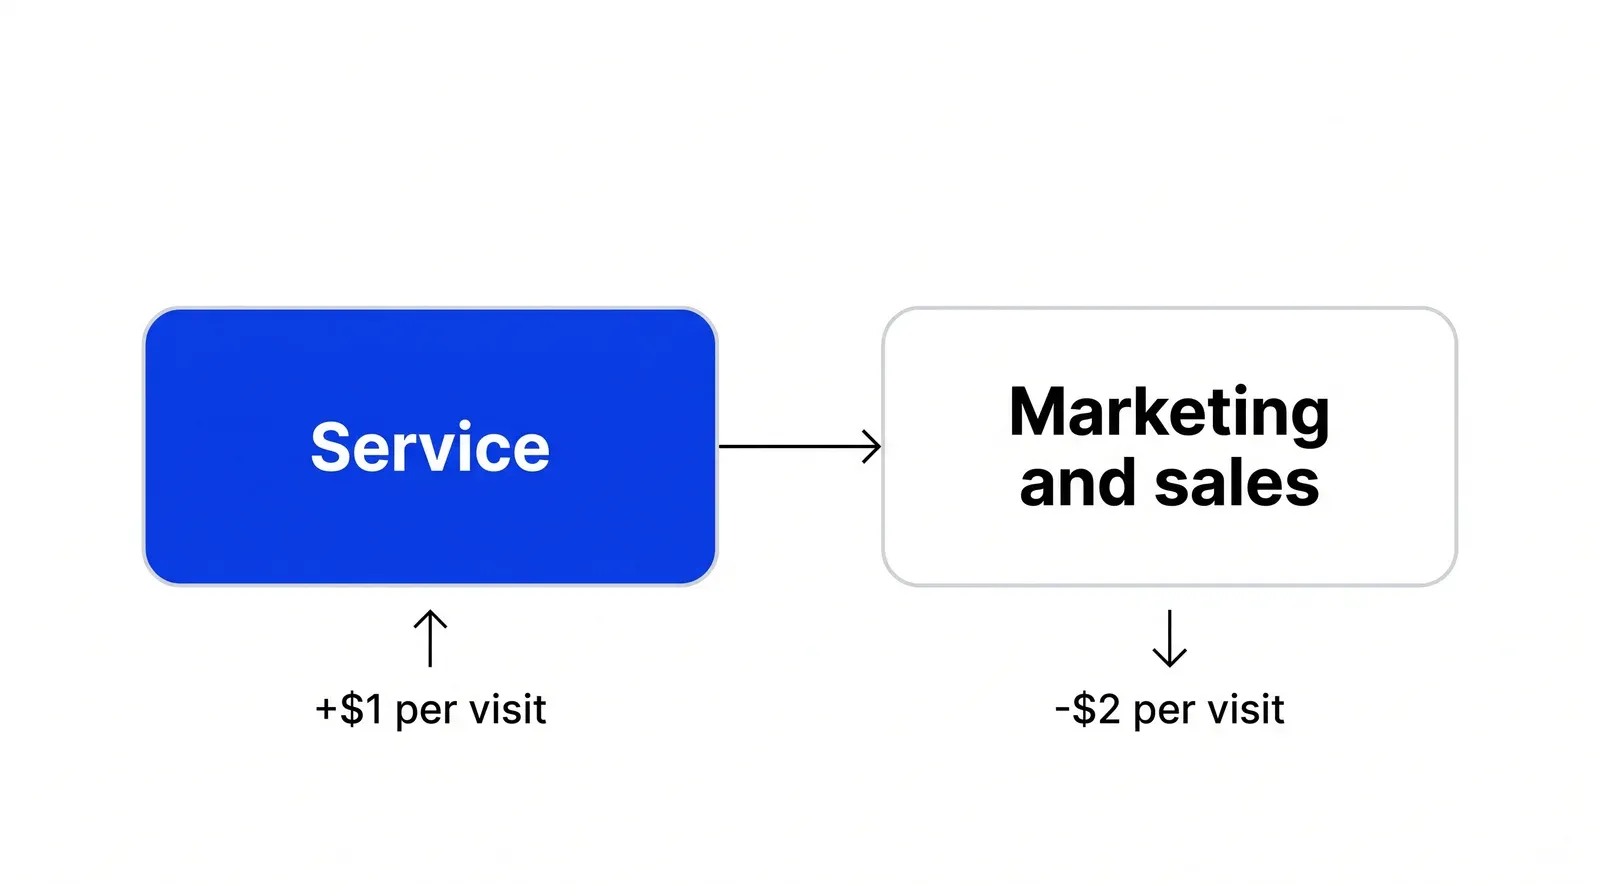
The most useful findings are usually linkages. A linkage is a pair of activities where spending in one changes the cost of another.
Take an illustrative network of four clinics with 6,000 visits a month at an average price of $100, so $600,000 in revenue. All nine activities together cost $92 per visit, leaving a margin of $8. Operations, mostly clinician time, takes $52. Marketing and sales takes $14, inbound logistics $8, outbound logistics $3, service $4, and the four support activities $11 between them. Marketing and sales is the second largest box after operations. Service, mostly follow-up calls, is one of the cheapest. The team adds a nurse who calls every first-time patient and books the next visit, which raises service cost by $1 per visit, or $6,000 a month. More patients return, so the network needs 300 fewer new patients a month to fill the same 6,000 visits. At $40 to acquire each new patient, marketing saves $12,000 a month, or $2 per visit. Margin rises from $8 to $9 per visit.
Once you have a cost per visit or per transaction, check it against contribution margin to see which activity costs rise with each sale and which stay fixed.
Value chain, supply chain and value stream map
All three draw work as a sequence, so they get mixed up.
| Value chain | Supply chain | Value stream map | |
|---|---|---|---|
| Scope | One company’s activities | Several companies, from raw material to end customer | One product’s flow, order to delivery |
| Question | Where is margin made or lost? | How do goods, information and money move between partners? | Where are waste and waiting in the flow? |
| Unit of analysis | Activity cost and customer value | Partners, inventory, lead time | Process steps, wait times, handoffs |
| Origin | Porter, 1985 | Logistics practice; CSCMP definition | Toyota Production System; Learning to See by Mike Rother and John Shook |
The Council of Supply Chain Management Professionals defines supply chain management as planning and managing sourcing, procurement, conversion and logistics, including coordination with suppliers, intermediaries and customers. The Lean Enterprise Institute, which published Learning to See, describes value stream mapping as drawing every step of material and information flow from order to delivery. If you need to map a process step by step, BPMN process mapping is the more precise tool.
One more source of confusion: the “global value chain.” The World Bank and researchers such as Gary Gereffi, John Humphrey and Timothy Sturgeon use the term for production split across countries and companies. The World Bank’s 2020 World Development Report says these chains account for almost half of all trade. That is an industry-level idea, not Porter’s company-level tool.
When the chain is the wrong shape
Charles Stabell and Øystein Fjeldstad of the Norwegian School of Management reported in Strategic Management Journal in 1998 that they ran into serious problems applying the value chain to more than two dozen firms. Their fix was two more models. A value shop solves a unique problem for each customer, as medicine, law and engineering do. A value network connects customers to each other, as banks and telephone companies do.
This matters for clinics and payments companies. A clinic’s core work is diagnosis and treatment, closer to a shop than a production line. Porter and Elizabeth Teisberg, in Redefining Health Care (Harvard Business School Press, 2006), built a care delivery value chain for health care, with stages from monitoring and preventing through diagnosing, intervening and recovering, organised around one medical condition. A payments company earns its margin by connecting merchants and cardholders, which is a network. The nine boxes still help you find costs in both cases, but name the activities in the language of your actual business.
Once you know which activities earn the margin, the next question is where to put growth spend, which is the work of Pushers’ Growth Lab practice.
How to apply Value chain analysis, step by step
- Draw your own nine boxes. Rename Porter's activities in your company's words. For a clinic, operations is the appointment itself; for a payments company, it is authorisation, settlement and risk scoring. The result is one page with every piece of work placed in exactly one box.
- Put a cost on every box. Reallocate the P&L from accounting lines (salaries, rent, software) to activities. A salary that covers two activities gets split by time spent. The result is a cost per activity, and ideally a cost per unit sold, such as per visit or per transaction.
- Ask what each box adds for the customer. For each activity, write what the customer would notice if it got worse, and whether they pay more because of it. The result is a short list of activities that justify the price and a list of ones the customer never sees.
- Find the drivers. For the three most expensive activities, name what makes the cost go up or down: volume, capacity use, location, a handoff with another activity. The result is a cause for each big number, not just the number.
- Look for linkages. Check pairs of activities where spending in one changes cost in another, such as follow-up calls and patient acquisition, or onboarding checks and chargebacks. The result is one or two trades worth testing.
- Pick two changes and measure them. Choose the changes that fit your strategy, cheaper or different, and set a number to watch for each. The result is a dated plan with an owner, reviewed after one quarter.
Examples
A card payments company and its disputes
Illustrative. A processor handles 2,000,000 card transactions a month and keeps $0.30 per transaction after scheme and interchange fees. Disputes run at 0.5 percent, so 10,000 a month, and each costs $15 to handle. That is $150,000 a month, or $0.075 per transaction: a quarter of net revenue disappears in the service box. The cause sits upstream in operations, where merchant risk checks at onboarding are light. Tightening those checks costs more per merchant but is the cheapest way to shrink the service cost.
A clinic-software vendor choosing to be different
Illustrative. A company selling scheduling software to private clinics finds that its onboarding team, part of service, is its most expensive activity per new customer. The cost-cutting reflex is to replace it with videos. The value chain view asks what clinics pay for: they choose this vendor because staff are trained on site and the first month goes smoothly. The onboarding team is the differentiation, so the company keeps it, raises the setup fee, and cuts cost in outbound activities instead.
When to use it
Use it when margins are thin and nobody can say which part of the business causes it, before a decision to outsource or bring work in-house, when a competitor sells at a price you cannot match, or when you need to choose between competing on cost and competing on being different. It works best in a company large enough to have separate teams for most of the nine activities.
When not to use it
Skip it in an early startup, where costs are too small and too mixed to split into nine boxes. Be careful in businesses that solve one-off problems, such as clinics, law firms and consultancies, or that connect customers to each other, such as banks and payment networks: researchers argue a different model fits them better, and forcing their work into a production line distorts the costs.
Common mistakes
- Drawing the nine boxes and stopping, with no cost attached to any of them.
- Using accounting lines (salaries, rent) as the activities, which hides the work that costs money.
- Cutting the most expensive activity without asking whether it is the reason customers pay more.
- Looking at each activity alone and missing linkages, where more spend in one box saves more in another.
- Confusing it with a supply chain map, then optimising suppliers when the margin leak is in sales or service.
FAQ
What are the 9 activities in Porter's value chain?
Five primary activities: inbound logistics, operations, outbound logistics, marketing and sales, and service. Four support activities: procurement, technology development, human resource management, and firm infrastructure, which covers finance, legal, planning and general management. Primary activities make and deliver the product; support activities make the primary ones possible.
What is the difference between a value chain and a supply chain?
A value chain is the set of activities inside one company that design, make, sell and support its product, analysed for cost and customer value. A supply chain is the flow of goods, information and money across several companies, from raw material suppliers to the final customer, managed for cost, speed and reliability.
How do you do a value chain analysis?
List your activities under Porter's nine headings, assign every cost in the P&L to one of them, then ask what each activity adds for the customer. Find what drives cost in the biggest boxes, look for linkages between activities, and pick one or two changes that fit your strategy of lower cost or differentiation.
What is margin in Porter's value chain?
Margin is the difference between what buyers are willing to pay for a product and the total cost of performing all nine activities to deliver it. Porter draws it as the arrowhead at the end of the chain. A company raises margin by lowering the cost of activities or by doing them in a way buyers will pay more for.
Does value chain analysis work for service companies?
Partly. It was built around companies that turn inputs into products. Charles Stabell and Øystein Fjeldstad found it hard to apply in many service firms and proposed two other models in 1998: the value shop for problem-solvers such as clinics and law firms, and the value network for intermediaries such as banks and telephone companies.
Sources
- Michael E. Porter, Competitive Advantage: Creating and Sustaining Superior Performance, Free Press, 1985, Internet Archive record
- Institute for Strategy and Competitiveness, Harvard Business School, The Value Chain
- Michael E. Porter, Victor E. Millar, How Information Gives You Competitive Advantage, Harvard Business Review, July 1985
- Michael E. Porter, What Is Strategy?, Harvard Business Review, November-December 1996
- University of Cambridge, Institute for Manufacturing, Porter's Value Chain
- Harvard Business School Online, What Is Value Chain Analysis?
- IBM Think, What is value chain analysis?
- Bruce Kogut, Designing Global Strategies: Comparative and Competitive Value-Added Chains, MIT Sloan Management Review, Summer 1985
- Michael Hergert, Deigan Morris, Accounting Data for Value Chain Analysis, Strategic Management Journal 10(2), 1989
- John K. Shank, Vijay Govindarajan, Strategic Cost Management: The Value Chain Perspective, Journal of Management Accounting Research 4, 1992
- Charles B. Stabell, Øystein D. Fjeldstad, Configuring Value for Competitive Advantage: On Chains, Shops, and Networks, Strategic Management Journal 19(5), 1998
- Ioan Lucian Grigorescu, Value Chain Analysis: Basic Element of an Organization's Competitive Advantage, Knowledge-Based Organization 21(2), 2015
- Jeffrey F. Rayport, John J. Sviokla, Exploiting the Virtual Value Chain, Harvard Business Review, November-December 1995
- Gary Gereffi, John Humphrey, Timothy Sturgeon, The Governance of Global Value Chains, Review of International Political Economy 12(1), 2005
- World Bank, World Development Report 2020: Trading for Development in the Age of Global Value Chains
- Council of Supply Chain Management Professionals, definition of supply chain management, via University of Tennessee Libraries
- Lean Enterprise Institute, Lexicon, Value-stream mapping
- Lean Enterprise Institute, Lexicon, Value stream
- Mike Rother, John Shook, Learning to See, Lean Enterprise Institute
- Elizabeth Teisberg, Creating a High-Value Health Care System, Federal Reserve Bank of Chicago, April 2008
- Michael E. Porter, Elizabeth Olmsted Teisberg, Redefining Health Care: Creating Value-Based Competition on Results, Harvard Business School Press, 2006
- Michael E. Porter, Thomas H. Lee, The Strategy That Will Fix Health Care, Harvard Business Review, October 2013
Last updated Oct 9, 2026


Marketing agency or growth system: when a company outgrows its agency
An agency is the right call while the founder still runs most of the company. Once the business starts copying itself into new locations or markets, it needs a system that sets goals, tests hypotheses and owns the result.

Why healthcare marketing agencies stall: the short, mid and long wins model we use with clinics
Most agencies own the click and nobody owns the front desk. How we structure clinic work in three horizons, the research behind each one, and one year of results.

How to calculate channel payback and unit economics
A CAC number that only marketing believes will not survive a finance review. This guide calculates channel payback so both teams work from the same model.