Weekly business review
A weekly business review is a standing meeting where metric owners explain last week's numbers, discuss only what moved unusually, and leave with named follow-ups; Amazon's version splits metrics into controllable inputs and outputs.
A weekly business review (WBR) is a recurring meeting where metric owners present last week's numbers, discuss only what moved unusually or missed target, and leave with logged follow-ups. Amazon's version, described by former executives Colin Bryar and Bill Carr, separates controllable input metrics a team can act on from output metrics, such as revenue, that it can only watch.
- Origin
- Amazon; practice described by Colin Bryar and Bill Carr, early 2000s (per Commoncog); book 2021
- Level
- 201 · Tool
- Fits
- Small and mid-size, Scale-up, Enterprise
- Time to apply
- two to three weeks to pick metrics and owners, then 60 minutes a week
- What you need
- an output metric or two that the company already reports every week · a named owner for each metric who can explain it without an analyst · one person, ideally from finance, to run the meeting and log follow-ups
A weekly business review (WBR) is a standing meeting in which the owners of a company’s metrics look at last week’s numbers, explain only what moved unusually, and leave with named follow-ups. Amazon’s version is the best documented. Colin Bryar and Bill Carr, two former Amazon executives, describe the company’s management practices in their 2021 book Working Backwards and teach them through their firm, Working Backwards LLC. The most detailed public account of the meeting itself comes from Cedric Chin of Commoncog, who learned it from Bryar. His account is a secondary source, not Amazon’s own, so we mark it wherever we lean on it.
We found no primary source that dates the first review or names who started it. Chin says the practice goes back to the early 2000s. Amazon’s 2009 shareholder letter is related but not the same thing: it describes annual goal setting, not this meeting, though it states the same belief about inputs.
What does a WBR actually look at?
A WBR looks at two kinds of metrics. Controllable input metrics are numbers a team can move directly through its own work. Output metrics are the results the business is judged on, which Working Backwards LLC says cannot generally be manipulated sustainably and which include revenue, gross profit, free cash flow, churn and customer satisfaction. Bryar and Carr prefer these names to leading and lagging indicators, which our page on leading vs lagging indicators covers in general.
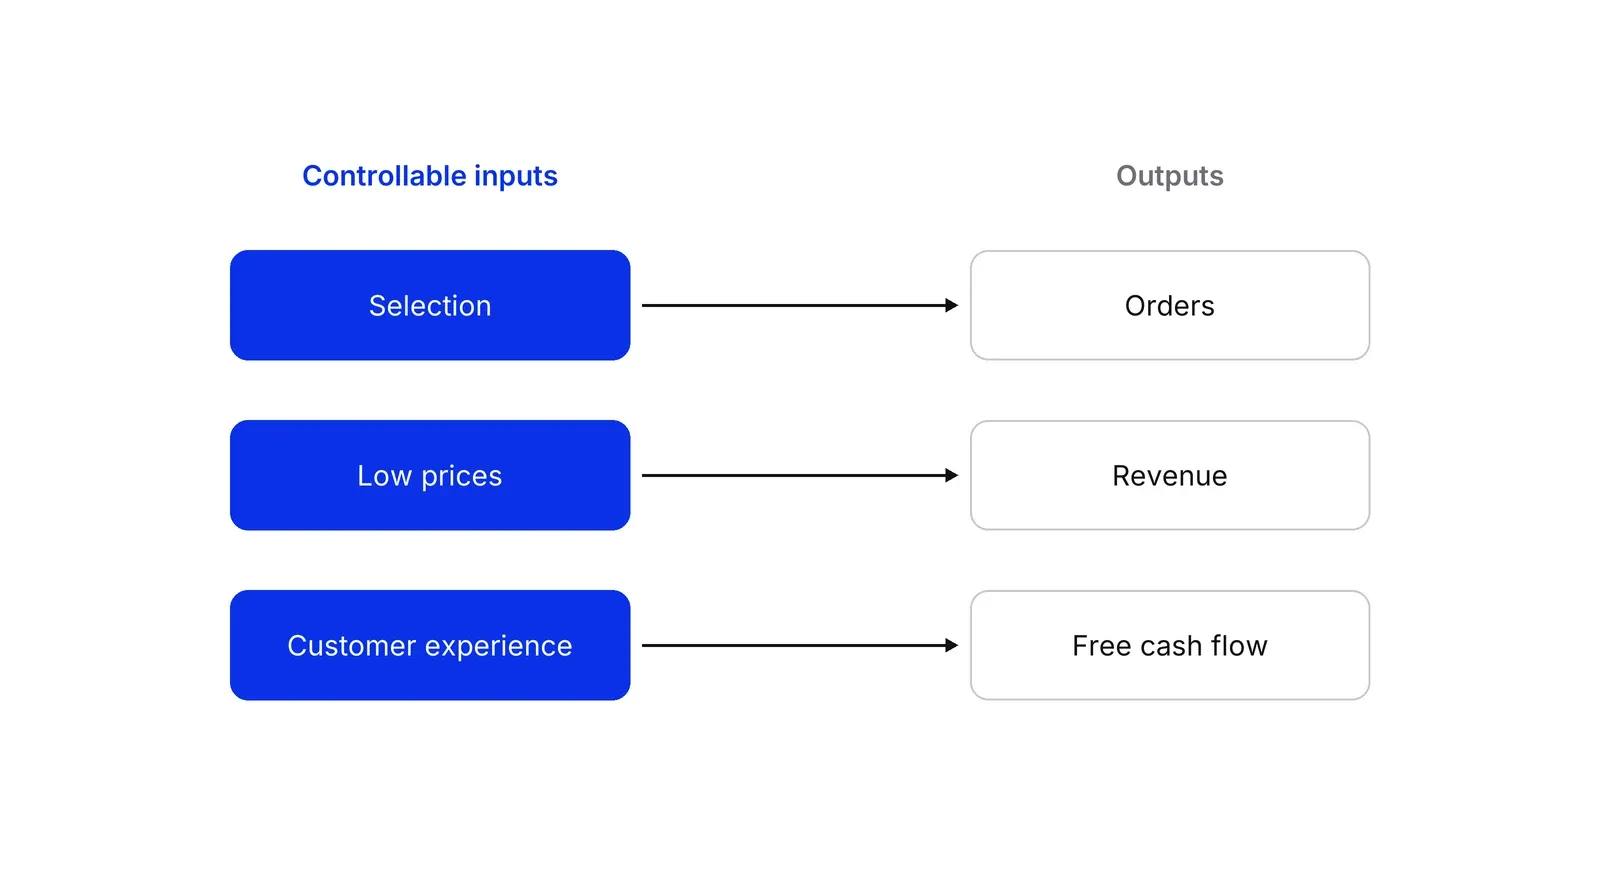
Jeff Bezos set out the same logic in the 2009 letter to shareholders: Amazon believed that focusing on the controllable inputs to its business was the most effective way to maximise financial outputs over time. Of 452 goals set for 2010, the letter says 360 would directly affect customer experience, and the terms net income, gross profit and operating profit appeared in none of them. Working Backwards LLC describes Bezos breaking Amazon’s aim into three customer-facing drivers: selection, low prices and customer experience.
| Type | What it is | Example | Discussed in the meeting? |
|---|---|---|---|
| Controllable input | A team can change it directly | Share of page views where the item is in stock | Yes, when it misses or moves unusually |
| Output | The result the business cares about | Revenue, free cash flow | Reported as the score, not debated |
| Context | Useful background, not tied to action | Mobile share of traffic | Reported only |
The last two rows follow Chin’s account, which also notes that an output in one process can be an input in another.
How does the weekly cycle run?
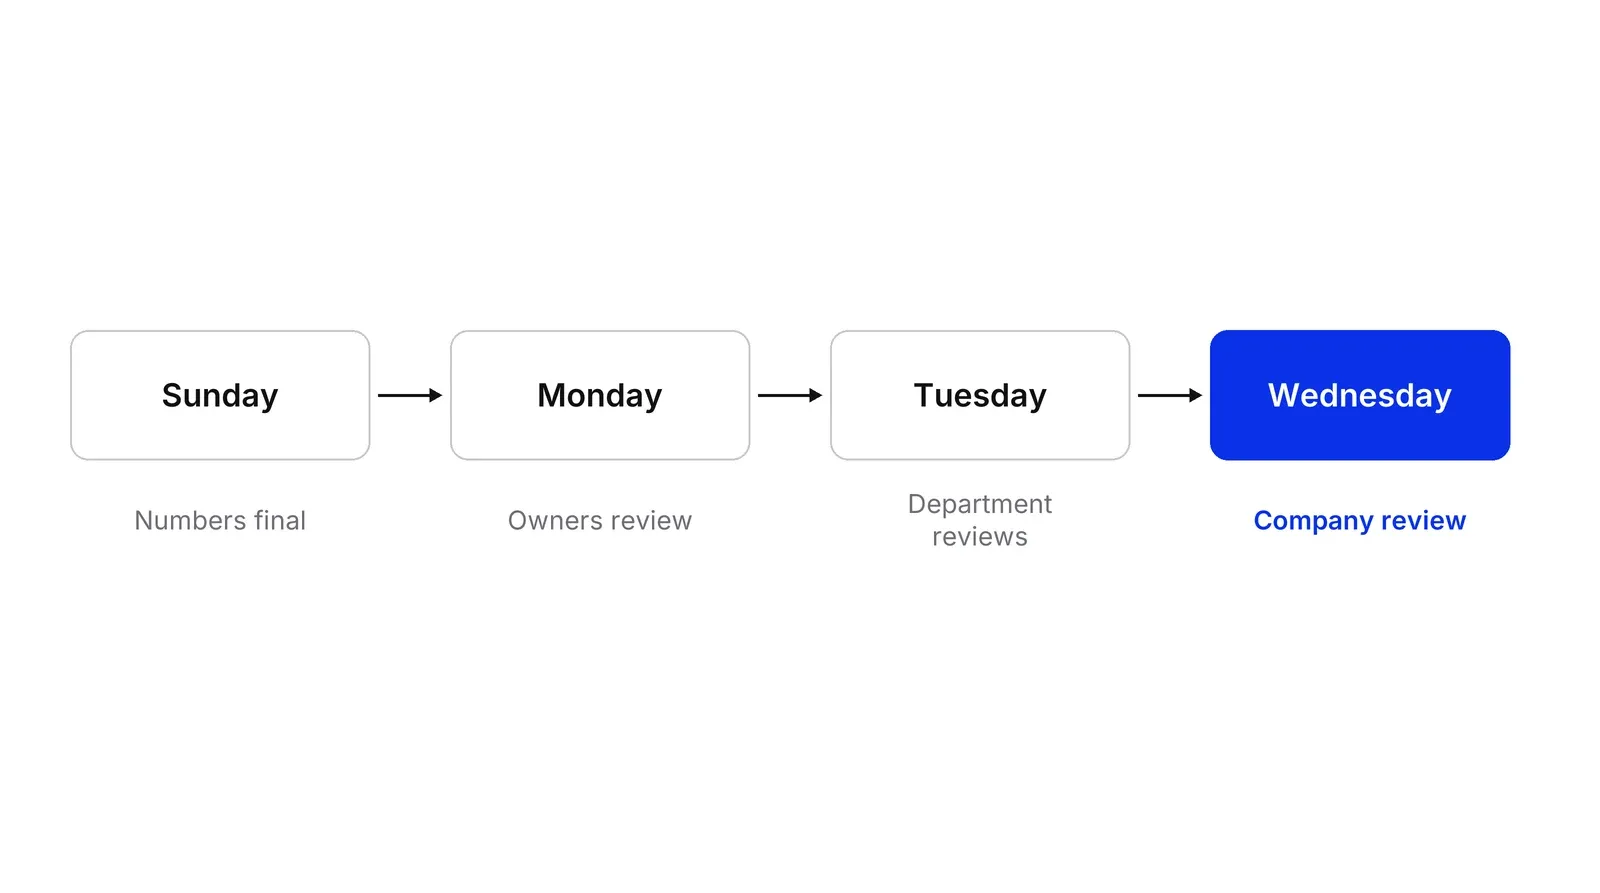
Chin’s account describes a four-day cycle that ends in the company-level meeting. The week’s numbers are generated after midnight on Sunday. On Monday each owner reviews their metrics and investigates anything unusual. On Tuesday departments run their own reviews, covering a larger set of metrics. On Wednesday the company-level WBR runs for 60 minutes, or 90 in the holiday season, with every executive of note in the room.
A facilitator, typically from finance, opens with follow-ups from the previous week. Each owner then presents a chart. If the metric is inside its normal range, the answer is that there is nothing to see, and the room moves on. An owner who does not know why a metric missed says so, and the facilitator logs a follow-up. Strategy debates are pushed offline. Chin says the standard view is a chart of the trailing six weeks beside the trailing twelve months, with the target marked.
On scale, the sources disagree. Chin puts the company-level review at roughly 400 to 500 metrics, while Working Backwards LLC says Amazon’s covered more than 200 in an hour. We cannot tell whether the two describe different years or different levels of the company.
Why discuss only exceptions?
Because most week-to-week movement is noise, and treating noise as news wastes the room. The W. Edwards Deming Institute explains that a stable system produces common cause variation, which is predictable within limits, and that Deming estimated 94 percent of causes are common causes in the system, not special events. Chin ties the WBR to this statistical process control tradition, which goes back to Walter Shewhart’s control charts in the 1920s, described in Donald Wheeler’s history of the chart. Chin adds that the WBR itself does not use those charts. It relies on the owner’s judgment and the standard view.
The practical effect is time. Executives already spend nearly 23 hours a week in meetings, according to Perlow, Hadley and Eun in Harvard Business Review, so a weekly hour has to earn its place. Amazon’s leadership principle on diving deep asks leaders to be skeptical when metrics and anecdote differ. Chin also reports that Amazon’s customer service team brings selected customer stories to the meeting.
How are good inputs found?
By trial and error, over months. Chin’s case study of Amazon’s category expansion shows the pattern: a first input that teams could move without helping customers, followed by several refinements as the weekly review showed that sales were not following. The full story is in the examples below. Chin describes the loop as adding an output, having the owning team look for inputs, running experiments, and keeping the ones that work. His account says a metric can be dropped as soon as it shows no effect.
This is the main difference from a plain dashboard review. A WBR keeps testing the causal model behind the numbers. The 1992 Balanced Scorecard article argued that what you measure is what you get, and a WBR treats that as a risk to manage and not a slogan. Ittner and Larcker’s Harvard Business Review study notes that many firms track non-financial measures they believe will affect profit, and a weekly review is one place to test that belief against results.
Where does it go wrong?
It goes wrong when the numbers become targets that people serve instead of the customer. Chin cites what he calls Joiner’s rule: under pressure to hit a target, people can improve the system, distort the system, or distort the data. In his account, finance’s power to audit metrics is the safeguard. Our page on Goodhart’s law covers the general problem, and Manheim and Garrabrant classify its variants.
The research on goals is wary too. Ordonez and colleagues list side effects of goal setting that include a narrow focus on goals and a rise in unethical behaviour, and Harris and Tayler warn that employees can end up serving the metric in place of the strategy. A WBR also needs a culture where bad numbers can be said aloud. Chin describes a software group whose review became bloated and blame-focused until it limited attendance and metrics.
How does it fit with other tools?
The WBR is the weekly layer of an operating rhythm. A KPI tree is a good way to find which inputs sit under which outputs before the first meeting. The 4 disciplines of execution uses a similar split: FranklinCovey calls lag measures history and lead measures levers, but it applies them to a few goals. Chin contrasts the WBR with a North Star metric approach by noting that it lets leaders see far more metrics at once. Sull and colleagues report in Harvard Business Review that two-thirds to three-quarters of large organisations struggle with execution, the problem a weekly review targets. A Growth Lab plan starts from the outputs a business already reports and works down to the inputs a team can own; see Growth Lab.
How to apply Weekly business review, step by step
- List the outputs. Write down the results the business is judged on, such as revenue, free cash flow, churn or appointments completed. Result: a short list of output metrics that will sit at the top of the deck as the score.
- Find controllable inputs one level down. For each output, ask what a team can change directly that should move it, and keep asking until you reach something someone can act on this week. Result: a draft input metric for each output, each with a stated reason it should move the result.
- Give every metric an owner and a cut-off. Assign one person per metric and fix the time the previous week's data is final, for example Sunday night. Result: a table of metric, owner and data source, with no metric left to an analyst to explain.
- Standardise the view. Show every metric the same way: the last six weeks next to the last twelve months, with the target marked. Result: a static deck where a reader learns to scan it in seconds.
- Run the meeting on exceptions. The facilitator opens with last week's follow-ups, owners skip anything inside normal range, and only misses and unusual moves are discussed. Result: a 60-minute meeting and a log of follow-ups with owners and dates.
- Test whether inputs move outputs. After a few weeks, check whether each input actually moved its output, and replace the ones that did not. Result: an input list that changes as you learn, with a note on why each metric was added or dropped.
Examples
Amazon and the in-stock metric
Commoncog's case study, based on Colin Bryar's account, says Amazon first tracked selection as the number of new product detail pages. Teams added huge numbers of items, sometimes buying inventory nobody wanted, and sales did not rise. Through repeated reviews the input became page views, then in-stock views, then in-stock views ready for two-day shipping, and finally a demand-weighted version. The case says the search took a little over a year, and that sales rose when the final metric improved.
A payments company's onboarding
Illustrative, no real company implied. A cross-border payments company judges itself on monthly processed volume, an output. Its team cannot order volume to rise, but it can control the share of new merchants whose compliance review finishes within 24 hours and the share of failed card payments that are retried. Those two go in the weekly deck, each with an owner. When review time slips for two weeks, the owner explains why and a fix is logged.
A clinic's booking line
Illustrative, no real clinic implied. A clinic group judges itself on completed appointments per month. The front desk cannot control whether patients are ill, but it can control the share of calls answered within a set time and the share of next-day slots left open. The weekly review shows both for each site, and a site that misses its answer-time target says so and names the cause.
When to use it
Use it when a company has outgrown a single dashboard, when leaders learn about problems in the monthly report weeks too late, or when each department tells a different story about the same week. It suits a team that can name owners for dozens of metrics and will commit one hour a week to look at them.
When not to use it
Skip it before there is a stable process to measure, since a company still finding product-market fit has no baseline against which to call anything unusual. Also skip it where leaders will use the meeting to assign blame, because owners then hide bad numbers and the review stops being a source of truth.
Common mistakes
- Reviewing outputs instead of inputs. If the meeting only watches revenue, nobody leaves with something they can change by next Wednesday.
- Letting the meeting become a problem-solving session. Debates about causes and strategy belong offline, with the follow-up logged in the meeting.
- Picking an input that is easy to move but does not move the output, as with counting new product pages instead of products customers could buy.
- Reacting to every wiggle. A swing inside the metric's normal range is routine variation, and chasing it wastes the room's time.
- Tying pay or blame to a single input metric, which invites teams to distort the data or the system.
FAQ
What is a weekly business review?
It is a standing meeting where metric owners present the past week's numbers, discuss only unusual moves and missed targets, and leave with logged follow-ups. Amazon's version, described by former executives Colin Bryar and Bill Carr, reviews controllable input metrics alongside output metrics such as revenue.
How long does a WBR take and how many metrics does it cover?
Sources differ. Working Backwards LLC, the firm run by Bryar and Carr, says Amazon's covered more than 200 metrics in an hour. Cedric Chin's Commoncog account puts it at 400 to 500 metrics in 60 minutes, or 90 over the holidays. Both agree the meeting works only because most metrics get no discussion.
What is the difference between an input metric and an output metric?
An input metric is something a team can change directly through its own work, such as how many products are in stock. An output metric is the result the business cares about, such as revenue or churn, which cannot be moved sustainably by decree. Amazon's term for the first kind is controllable input metric.
Is a WBR the same as a weekly sales report?
No. A weekly report summarises what happened. A WBR is a meeting built around exceptions: owners explain misses and unusual moves, a facilitator logs follow-ups, and the team keeps testing whether its input metrics really drive the outputs. The report can be one input to the meeting, not a replacement for it.
Who should run the meeting?
Chin's account says Amazon's meeting is typically facilitated by someone from finance, who opens with the previous week's follow-ups and audits the metrics. Finance suits the role because it can check whether numbers have been distorted. Any neutral person with authority to move debates offline can do the job.
Sources
- Working Backwards LLC, Input metrics (concept page)
- Working Backwards LLC, company site of Colin Bryar and Bill Carr
- Publishers Weekly, listing for Working Backwards by Colin Bryar and Bill Carr (St. Martin's Press)
- Cedric Chin, Commoncog, The Amazon Weekly Business Review (secondary account)
- Commoncog, Colin Bryar on the practice of Amazon's Weekly Business Review (podcast notes)
- Cedric Chin, Commoncog, Becoming data driven, from first principles
- Commoncog, Amazon incentives and category expansion (case, secondary account)
- Jeff Bezos, Amazon 2009 letter to shareholders, SEC exhibit 99.1
- Amazon, Leadership principles
- W. Edwards Deming Institute, Knowledge of variation
- Donald J. Wheeler, A history of the chart for individual values, Quality Digest
- Robert S. Kaplan, David P. Norton, The Balanced Scorecard: Measures That Drive Performance, Harvard Business Review, 1992
- Christopher Ittner, David Larcker, Coming Up Short on Nonfinancial Performance Measurement, Harvard Business Review, 2003
- FranklinCovey, The 4 Disciplines of Execution, Discipline 2: Act on the Lead Measures
- Leslie Perlow, Constance Hadley, Eunice Eun, Stop the Meeting Madness, Harvard Business Review, 2017
- Donald Sull, Stefano Turconi, Charles Sull, Why Strategy Execution Unravels, Harvard Business Review, 2015
- Lisa Ordonez, Maurice Schweitzer, Adam Galinsky, Max Bazerman, Goals Gone Wild, Harvard Business School Working Paper 09-083, 2009
- Michael Harris, Bill Tayler, Don't Let Metrics Undermine Your Business, Harvard Business Review, 2019
- Gwyn Bevan, Christopher Hood, What's measured is what matters: targets and gaming in the English public health care system, Public Administration, 2006
- David Manheim, Scott Garrabrant, Categorizing Variants of Goodhart's Law, arXiv:1803.04585, 2018
Last updated Oct 9, 2026


Fractional COO or embedded operations team? How to choose at Series A
The two models solve different problems: how to tell which one your company needs, and what each costs in time and control.

What operational systems successful fintech startups use: lessons from ten companies
Starling, Monzo, Qonto, bunq, Lunar, Pleo, Tide, Ramp, Mercury and Column scaled on four operating systems. Regulators' findings show what breaks when one of them lags behind growth.

What a revenue operations manager actually owns
Pipeline definitions, CRM hygiene, forecasting and the handoffs between marketing, sales and success. What the role covers, and how it differs from sales ops.