Marketing mix modeling (MMM)
Marketing mix modeling is a statistical way to estimate how much each marketing channel adds to sales over time, so you can decide where the next unit of budget should go.
Marketing mix modeling (MMM) is a regression model that explains weekly sales or sign-ups with spend per channel, plus price, seasonality and other outside factors. It uses aggregate data, not user tracking, and it models two things: adstock, the effect that carries over after an ad runs, and saturation, the fall in return as spend grows. Its main use is deciding how to split a marketing budget.
- Origin
- Econometric practice with no single inventor; adstock is associated with Simon Broadbent; open-source tools by Google, Meta and PyMC Labs, No single date; Google's Bayesian MMM paper 2017; Meridian opened to all advertisers, January 2025
- Level
- 301 · Advanced
- Fits
- Small and mid-size, Scale-up, Enterprise
- Time to apply
- two hours for a first spreadsheet check; four to twelve weeks for a full model with a test to calibrate it
- What you need
- weekly sales or sign-ups for at least one year, ideally two or three · weekly spend per channel for the same weeks, including offline media · a calendar of price changes, promotions, holidays and stock-outs · someone who can run one controlled spend change per quarter
Marketing mix modeling (MMM) is a statistical model that explains a business outcome, usually weekly sales or sign-ups, with the spend in each marketing channel plus everything else that moves demand: price, promotions, seasonality, holidays. The PyMC-Marketing guide describes it plainly as regression modeling applied to business data. Once fitted, the model tells you roughly how many sales each channel produced and what the next unit of spend in each channel is likely to return.
MMM has no single inventor. It grew out of econometric work for consumer brands that advertised on TV, where no click could be tracked. It came back into fashion as tracking of individual users got harder, and as Google, Meta and PyMC Labs released free, open-source versions. The people who use it are heads of marketing and finance teams who have to defend a budget split across several channels.
What does MMM measure?
MMM measures the contribution of each channel to an outcome over time, using only aggregate data. You need no cookies, no user IDs and no click paths. That makes it one of the few methods that can put TV, radio, outdoor, leaflets and digital ads on the same scale.
The model starts from a base: the sales you would get with no marketing at all, driven by brand, word of mouth, seasonality and price. Each channel then adds a slice on top. Two adjustments make the slices realistic, and they are what separate MMM from a plain regression. Google’s 2017 paper by Jin and colleagues calls them carryover and shape effects. Most practitioners say adstock and saturation.
Adstock: ads keep working after they stop
Adstock is the share of an ad’s effect that carries over into the following weeks. Someone sees a billboard in week one and books an appointment in week three. The Meridian documentation defines it as a weighted average of current and past media, with weights that decay over time up to a maximum lag.
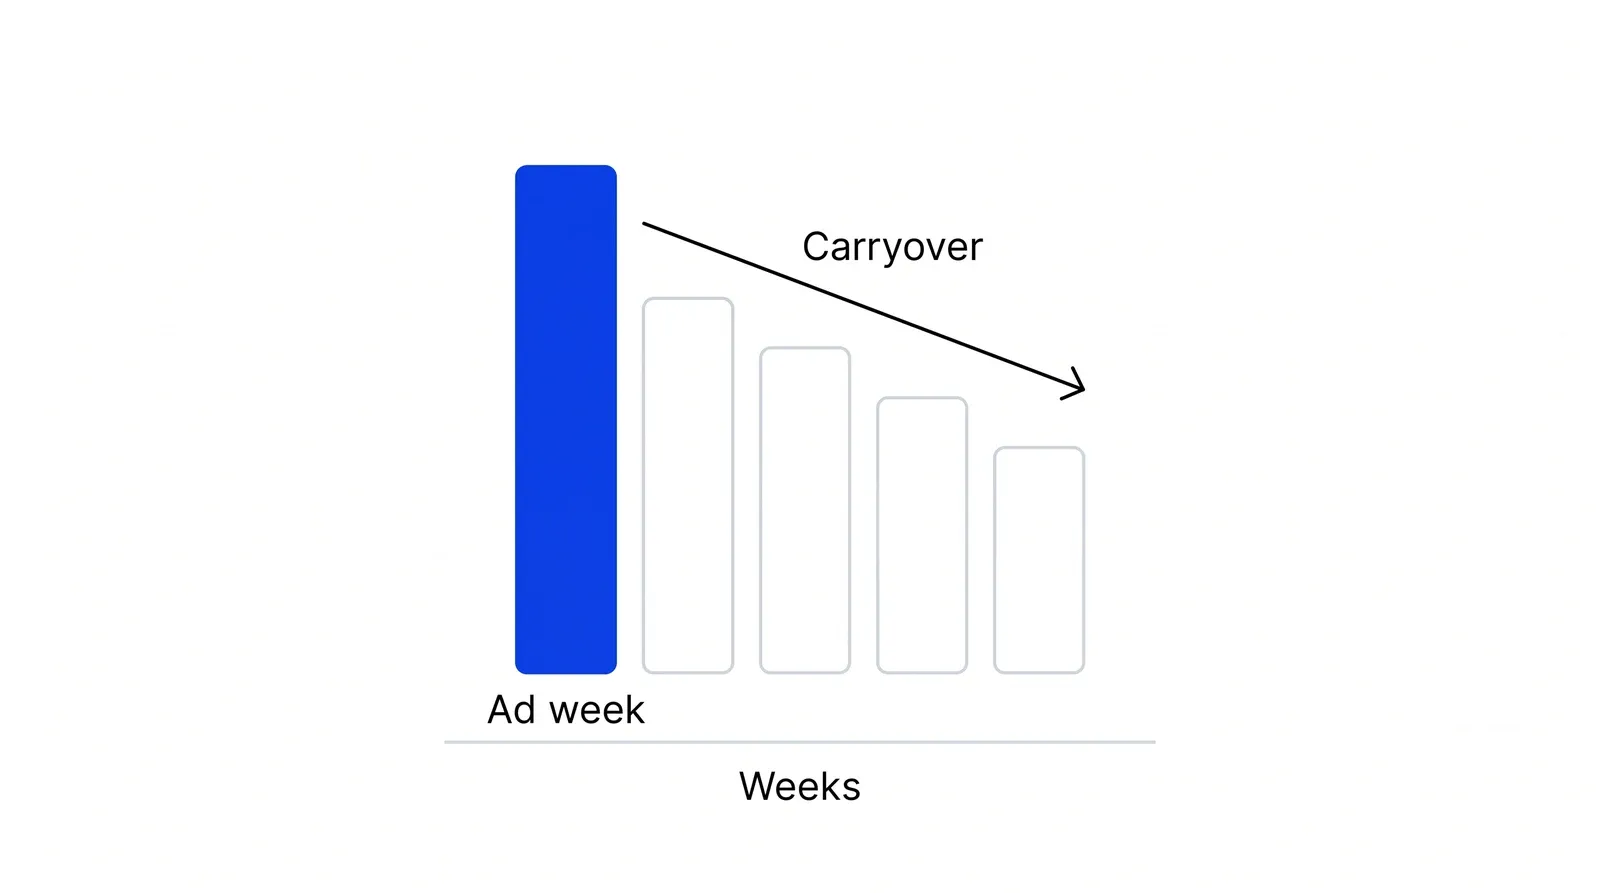
A worked example with made-up numbers: with a decay rate of 0.5, spending 100 in week one counts as 100 that week, 50 the next, 25 the week after, and so on. A channel with slow decay, such as TV, gets credit for sales weeks later. A channel with fast decay, such as search ads, gets credit almost at once. The term adstock is associated with the British advertising researcher Simon Broadbent, who also wrote on adstock modelling for the long term with Tim Fry in 1995.
Saturation: each extra unit buys less
Saturation means that each additional unit of spend in a channel brings back less than the previous one. The first thousand spent on search ads reaches people already looking for you. The tenth thousand bids on weaker queries at higher prices.
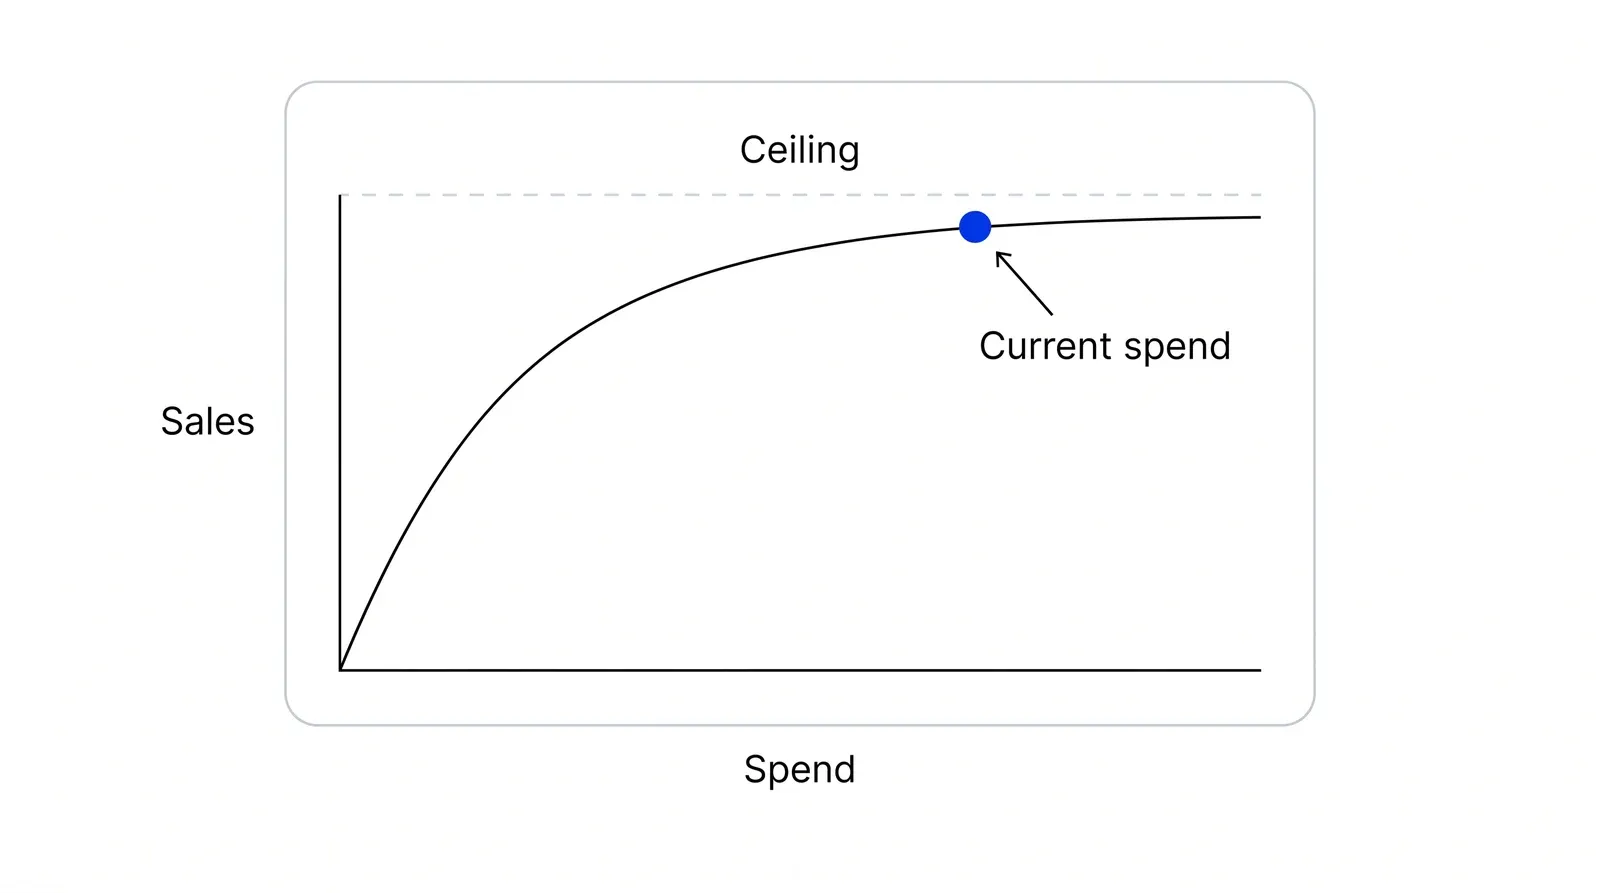
Meridian and Robyn both model this with a Hill curve, a formula that rises and then flattens. In Meridian one parameter marks “the half saturation point,” the spend at which a channel reaches half its maximum effect. Budget decisions should come from the slope of this curve at your current spend. A channel can have a good average return and still be a poor place for the next unit of money.
The problem is common. Shapiro, Hitsch and Tuchman studied 288 brands and found negative marginal returns on TV advertising for more than 80% of them.
MMM, multi-touch attribution and incrementality tests
These three methods answer different questions, and teams that use only one tend to be misled by it. Multi-touch attribution (MTA) splits credit for each tracked conversion across the ads a person touched. Incrementality tests compare a group that saw the ads with a group that did not. MMM explains totals over time.
| Multi-touch attribution | Incrementality test | Marketing mix modeling | |
|---|---|---|---|
| Data | User-level clicks and views | A test group and a control group | Weekly totals per channel |
| Sees offline media | No | Yes, with geo tests | Yes |
| Causal | No, correlational | Yes | Partly, depends on data and calibration |
| Answers | Which ads were on the path | Did this channel add sales | How to split the whole budget |
| Main weakness | Tracking gaps, platform bias | One channel at a time, costly | Needs years of data, correlated channels |
Attribution has two blind spots. Google Ads data-driven attribution shares credit across Google ad interactions, so other platforms are outside its view. And since iOS 14.5, Apple requires user permission before an app tracks people across other companies’ apps and sites, including for ad measurement.
Observational methods also miss in general. Gordon and colleagues compared 15 large Facebook experiments with observational estimates and found the observational methods often failed to match the experimental results. Experiments are the most reliable but hard to run well: Lewis and Rao found the median confidence interval on return in 25 large field experiments was over 100 percentage points wide.
The practical answer is to combine them. Run experiments such as geo experiments, in which regions are randomly assigned to see ads or not, and feed their results into the MMM. All three open-source tools support this calibration.
Open-source MMM tools
Three free tools cover most needs, and they agree on the core ideas while differing in method and language.
| Tool | Maker | Language | Method | Licence |
|---|---|---|---|---|
| Meridian | Python | Bayesian, geo-level, reach and frequency | Apache 2.0 | |
| Robyn | Meta Marketing Science | R, Python beta | Ridge regression, automated tuning | MIT |
| PyMC-Marketing | PyMC Labs | Python | Bayesian, lift-test calibration | Open source |
Google opened Meridian to all advertisers in January 2025 and has stopped supporting its earlier tool, LightweightMMM. Robyn calls itself experimental. PyMC-Marketing comes from the core developers of the PyMC statistics library. Each needs an analyst who can judge whether the model’s output makes sense.
The MMM mindset for a small business
A small business rarely has the data for a full model. Meridian’s own guidance says two years of weekly national data is too little for a model with 26 parameters. The way of thinking still applies, and it costs nothing.
Think in weeks and totals. Expect effects to lag. Assume every channel flattens, and ask what the next unit of spend will buy. Distrust any report that adds up to more sales than you made. And when two channels always move together, change one on purpose so you can tell them apart; the PyMC-Marketing documentation shows a model unable to separate perfectly correlated channels until lift tests are added.
The steps below turn this into a routine that fits in a spreadsheet. In Pushers’ Growth Lab work, this weekly table sits next to a KPI tree, so a budget shift shows up in the metric it was meant to move.
How to apply Marketing mix modeling (MMM), step by step
- Build one weekly table. Put the outcome you care about (sales, first visits, funded accounts) in one column and spend per channel in the next columns, one row per week. Add price changes, promotions and holidays as extra columns. Result: a single table that every later step reads from.
- Compare platform claims with reality. Add up the conversions each ad platform reports for the same month and compare the total with the conversions you actually recorded. If the platforms together claim half again as many sales as your books show, each one is counting sales the others also count. Result: an over-claim ratio you keep in mind when reading any platform report.
- Look for lag and flattening. Plot each channel's spend next to the outcome, shifted by one to four weeks. Then sort weeks by spend and check whether the highest-spend weeks brought proportionally more results or only a little more. Result: a rough idea of which channels carry over and which already look saturated.
- Change spend on purpose. Pick the channel with the biggest budget and move its spend up or down by a clear amount for four weeks, or pause it in some regions while keeping it in others. Compare the change in the outcome with the weeks or regions you did not touch. Result: one incremental number you can trust more than any report.
- Decide whether you need a full model. A full MMM pays off when you run several channels at once, some of them offline, and have two or more years of weekly data or many regions. If so, pick Meridian, Robyn or PyMC-Marketing, and feed your test result in as a calibration point. Result: a yes or no, and a named owner if yes.
- Move budget at the margin, then repeat. Shift a slice of budget from the channel with the flattest return to the one with the steepest, and measure again next quarter. Result: a budget split that changes in small steps, each backed by a measurement.
Examples
A dental clinic without a model
Illustrative, no real clinic implied. A clinic spends 3k a month on search ads, 2k on social ads and 1k on leaflets, and gets about 120 new patients. Search and social together report 150 booked patients, more than the clinic actually saw, so the platforms overlap. The owner cuts social ads to zero in March and keeps everything else flat. New patients fall from 120 to 112, so social was adding roughly 8 patients for 2k, or 250 per patient. Search is then raised by 1k in April and new patients rise by 4, also 250 each. Neither channel is cheap at the margin, which tells the owner to test leaflets and referrals next.
A payments app with correlated channels
Illustrative. A fintech app raises paid search and paid social together every December and cuts both every summer. A regression cannot separate two channels whose spend always moves together; the PyMC-Marketing documentation shows exactly this case. The team runs a four-week geo test that pauses social in a third of regions while search stays flat, then enters the measured lift into the model. The model's split between the two channels now rests on an experiment instead of on guesswork.
What 288 brands show about saturation
Shapiro, Hitsch and Tuchman estimated TV advertising effects for 288 consumer brands in a 2021 Econometrica paper. They found negative marginal returns for more than four in five of the brands, meaning the last dollar spent brought back less than a dollar, and an overall positive return for only about one third. This is the saturation problem MMM is built to find: many advertisers spend past the point where the curve has flattened.
When to use it
Use MMM when you spend in several channels at once, including offline ones such as TV, radio, outdoor or leaflets that no click tracking can see, and when the question is how to split next year's budget. It also helps when user-level tracking has gaps, for example after Apple's App Tracking Transparency, because it needs only weekly totals.
When not to use it
Skip a full model when you have less than a year of weekly data, run only one or two channels, or spend so little that week-to-week noise swamps any marketing effect. In those cases controlled spend changes and simple tests answer the budget question faster. Do not use MMM to pick keywords, ads or audiences; it works at channel level.
Common mistakes
- Trusting the model's split between two channels whose spend always rose and fell together, when the data cannot tell them apart without an experiment.
- Reading saturation curves far beyond the spend levels you have actually tried. Meridian's documentation warns that curves extrapolated past the observed range need extra caution.
- Leaving out price changes, promotions or stock-outs, so the model credits media with sales that a discount produced.
- Treating the model's output as a final answer instead of a hypothesis to test with one controlled spend change.
- Adding up platform-reported conversions and calling the total your marketing return.
FAQ
How does marketing mix modeling help with budget allocation?
MMM estimates a response curve for each channel: how much extra sales each additional unit of spend brings at current levels. Budget allocation then moves money from channels where the curve is flat to channels where it is still steep. Meridian, Robyn and PyMC-Marketing all include an optimiser that proposes such a split within limits you set.
What is the difference between MMM and multi-touch attribution?
Multi-touch attribution splits credit for each tracked conversion across the ads a person clicked or saw. MMM uses weekly totals and explains them statistically, with no user tracking. Attribution sees only tracked digital touchpoints, often inside one platform. MMM can include TV, outdoor, price and seasonality, but works only at channel level and needs more history.
How much data do you need for marketing mix modeling?
Google's Meridian documentation calls its guidance rough and says two years of weekly national data with 26 parameters is too little to estimate reliably. PyMC-Marketing suggests two to three years of weekly or daily data. Regional data helps a lot, because each region adds observations. Fewer channels and controls also make thin data go further.
Is Google Meridian free to use?
Yes. Meridian is open source under the Apache 2.0 licence and Google made it available to all marketers in January 2025. It runs in Python and Google recommends a GPU. Running it still costs analyst time, and Google lists certified partners who implement it for advertisers that lack in-house data science.
Can a small business use marketing mix modeling?
A small business usually lacks the data for a reliable full model, but it can use the same logic. Keep a weekly table of spend and results, check whether platform reports add up to more than your real sales, and change one channel's spend on purpose for a few weeks to see what really moves.
Sources
- Google, Meridian marketing mix model, developer documentation
- Google, Meridian, About the project
- Google, Meridian, Media saturation and lagging
- Google, Meridian, Amount of data needed
- Google, Meridian source code repository on GitHub
- Google, Meridian is now available to everyone, January 2025
- Google, LightweightMMM repository on GitHub (archived)
- Meta Marketing Science, Robyn documentation
- Meta Marketing Science, Robyn features: adstock, saturation, ridge regression and calibration
- Meta, Robyn source code repository on GitHub
- PyMC Labs, PyMC-Marketing documentation
- PyMC-Marketing, Introduction to media mix modeling
- PyMC-Marketing, Lift test calibration
- Yuxue Jin, Yueqing Wang, Yunting Sun, David Chan, Jim Koehler, Bayesian Methods for Media Mix Modeling with Carryover and Shape Effects, Google, 2017
- David Chan, Mike Perry, Challenges and Opportunities in Media Mix Modeling, Google, 2017
- Jon Vaver, Jim Koehler, Measuring Ad Effectiveness Using Geo Experiments, Google, 2011
- Brett R. Gordon, Florian Zettelmeyer, Neha Bhargava, Dan Chapsky, A Comparison of Approaches to Advertising Measurement: Evidence from Big Field Experiments at Facebook, Marketing Science 38(2), 2019
- Gordon, Zettelmeyer, Bhargava, Chapsky, author version of the Facebook field experiments paper, Kellogg School of Management
- Randall A. Lewis, Justin M. Rao, The Unfavorable Economics of Measuring the Returns to Advertising, Quarterly Journal of Economics 130(4), 2015
- Raj Sethuraman, Gerard J. Tellis, Richard A. Briesch, How Well Does Advertising Work? Generalizations from Meta-Analysis of Brand Advertising Elasticities, Journal of Marketing Research 48(3), 2011
- Bradley T. Shapiro, Günter J. Hitsch, Anna E. Tuchman, TV Advertising Effectiveness and Profitability: Generalizable Results From 288 Brands, Econometrica 89(4), 2021
- Tim Fry, Simon Broadbent, Adstock modelling for the long term, Journal of the Market Research Society, 1995 (WARC)
- Meta Open Source, GeoLift documentation
- Google Ads Help, About data-driven attribution
- Apple Developer, User privacy and data use (App Tracking Transparency)
Last updated Oct 9, 2026


Marketing agency or growth system: when a company outgrows its agency
An agency is the right call while the founder still runs most of the company. Once the business starts copying itself into new locations or markets, it needs a system that sets goals, tests hypotheses and owns the result.

Why healthcare marketing agencies stall: the short, mid and long wins model we use with clinics
Most agencies own the click and nobody owns the front desk. How we structure clinic work in three horizons, the research behind each one, and one year of results.

The compliance layer under fintech marketing operations
A fintech marketing agency can build campaigns. It cannot own the compliance review, the KYC drop-off or the multi-market licensing rules that decide whether a lead ever becomes a customer.