Magic number
The magic number divides the annualized revenue a company added this quarter by what it spent on sales and marketing last quarter, to show how much growth each sales dollar buys.
The SaaS magic number is a sales-efficiency ratio: the change in quarterly recurring revenue, multiplied by four, divided by the previous quarter's sales and marketing spend. A result near 0.7 to 0.75 is the usual rule-of-thumb floor for healthy efficiency. Investors and finance leads use it to decide whether more go-to-market spend is likely to pay off.
- Origin
- Rory O'Driscoll, Scale Venture Partners (Scale's account); Josh James, Omniture, says he co-invented it; Lars Leckie, Hummer Winblad, published the formula, 2005 (Scale's account of the Omniture analysis); first public formula March 2008
- Level
- 301 · Advanced
- Fits
- Scale-up
- Time to apply
- An hour for a first reading if quarterly revenue and S&M spend are already in the books
- What you need
- recurring revenue (or ARR) for the last two quarters · sales and marketing expense for the quarter before the latest one, fully loaded · a decision on which revenue basis you will use and report every time
The SaaS magic number is a ratio that shows how much new annual revenue a company gets for each dollar it spent on sales and marketing (S&M) the quarter before. A value of 1.0 means a dollar of spend bought about a dollar of annual revenue. It is a screening tool for growth spending, used by investors, boards and finance leads in subscription businesses.
Who coined it? The sources disagree
Scale Venture Partners credits its own Rory O’Driscoll. In Scale’s history of the metric, the story is set in 2005: while evaluating Omniture, O’Driscoll saw more than $2 of first-year revenue for every $1 of go-to-market spend and called it magic. A 2005 news report confirms he was then a managing director at BA Venture Partners and would join Omniture’s board, so he was close to the numbers.
Omniture’s chief executive, Josh James, tells a different version. In a SaaStr talk he says he got to invent the magic number with one of his investors, and that it was how the company was run. He does not name the investor.
The formula reached the public in March 2008, when Lars Leckie of Hummer Winblad wrote it up in a guest post. The post cites James’s talk about Omniture and says nothing about who originated the metric. Scale’s account does not mention James or Leckie. We found no primary source that settles the credit, so treat the origin as shared: an Omniture-era idea between the company and its investors, spread by Leckie and later taken up by Scale.
The formula and its variants
The standard formula is (this quarter’s recurring revenue minus last quarter’s) times four, divided by last quarter’s S&M expense. Leckie’s 2008 version uses quarterly recurring revenue. Scale’s public explanation of the metric uses annualized GAAP revenue so that listed companies can be compared.
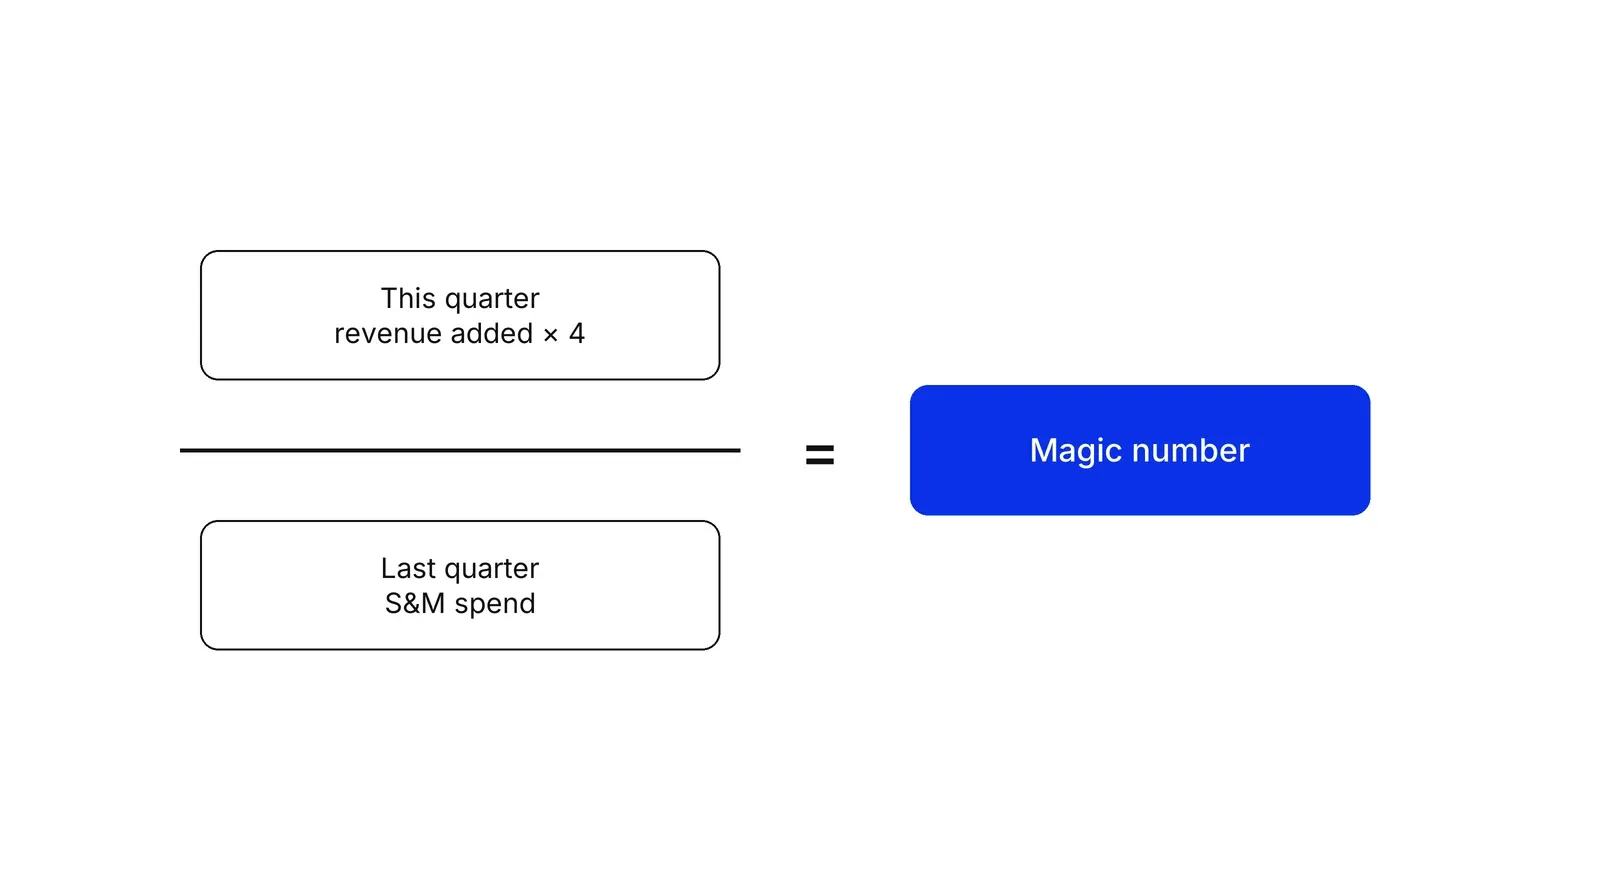
The lag exists because spending usually runs ahead of the revenue it produces. Published guides then differ in four ways:
| Variant | What changes | Source |
|---|---|---|
| Recurring revenue or GAAP revenue | GAAP revenue includes one-off income; recurring revenue does not | Wall Street Prep, CFI |
| ARR, no multiplier | ARR is already annual, so the times-four step is dropped | Jirav |
| Net new ARR | Subtracts churned and contracted revenue, so retention is inside the figure | CFI |
| Gross-margin adjusted | Multiplies the revenue change by gross margin, advised when margin is low | Fiscal Lion |
CFI also notes that some analysts put customer acquisition cost in the denominator instead of S&M spend. Before comparing your number with any benchmark, check all four choices.
What counts as a good number?
Rules of thumb put the line at about 0.75, and no standard body sets it. Leckie wrote that below 0.75 you should step back and look at the business, and above it you can invest in growth. Scale’s own baseline is 0.7, the long-run median of the private companies it tracks.
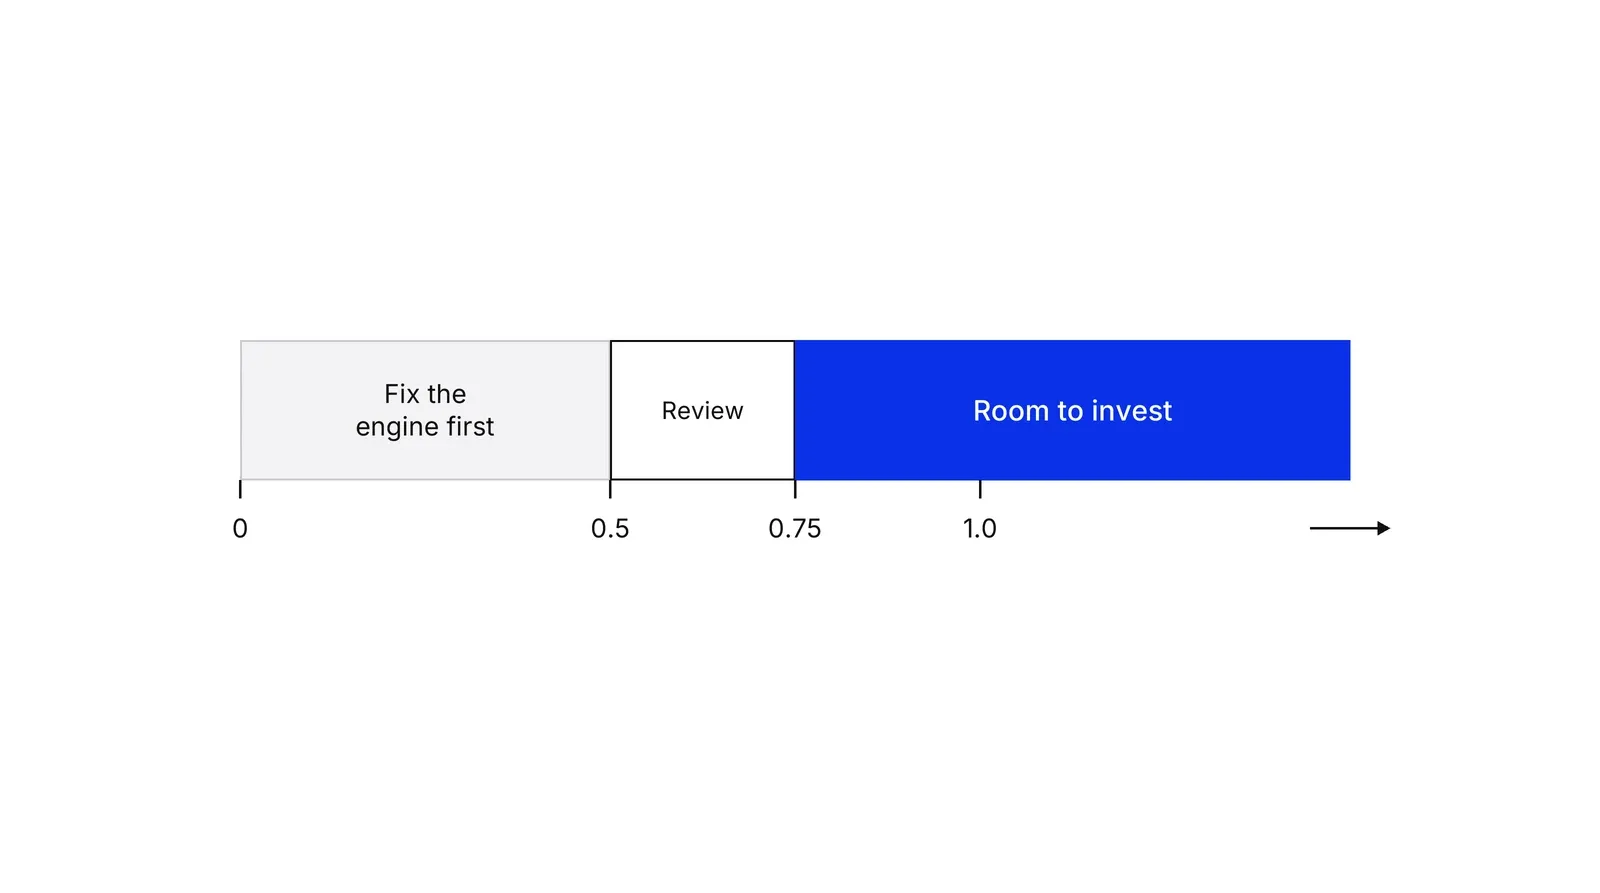
Other guides add finer bands. CFI reads below 0.5 as a reason to stop adding S&M spend and above 1.0 as robust. Wall Street Prep calls below 0.75 inefficient and above 1.0 very efficient.
Datasets give a different picture by stage. A SaaStr post on IVP data reports an average of 1.2 at about $15M ARR, falling to about 0.8 at $200M+, with the top quartile at 2.1. Tomasz Tunguz found most of roughly 20 public SaaS companies clustering around 0.8 in 2013. Both are small, dated samples, so use them as context and not as a target.
How it relates to payback and other efficiency metrics
If revenue added equals a dollar per dollar of spend, the spend returns in about a year, so months of payback are roughly 12 divided by the magic number. CFI states the inverse relationship and adds that CAC payback includes gross margin while the magic number does not. At a magic number of 1.0 and a 75% gross margin, the gross-profit payback is about 16 months, not 12. IVP’s reading of 0.75, as reported by SaaStr, matches a 16 to 18 month payback.
The magic number answers one question about acquisition spend across the whole company. The LTV to CAC ratio asks whether a customer is worth what they cost over their life. Unit economics shows where each customer’s money goes. The burn multiple, popularized by David Sacks, divides net burn by net new ARR, so it counts all spending and not just sales and marketing. Bessemer’s scaling guide puts the wider point simply: sales efficiency is capital efficiency.
Where it misleads
The ratio credits all new revenue to sales and marketing. Nnamdi Iregbulem’s 2021 analysis of 230 quarterly observations from 26 software companies notes that organic inbound, product-led growth and R&D also bring revenue, so the measure overstates the effect of spend. In his dataset the simple ratio averaged 2.1, while his estimate of the true effect over four quarters was about 0.6. The sample is small and the author says it is not representative, so read it as a warning about method.
CJ Gustafson’s critique adds that it bundles new sales, expansion and churn into one figure, so a good result can hide falling retention, and it ignores gross margin. IVP’s data also warns that free and viral acquisition can inflate the metric. Use net revenue retention beside it, and when the ratio is high, check capacity: a high reading can mean sales is short of people, and sales capacity planning tests that.
A Growth Lab plan starts from the efficiency of each channel before it sets a budget.
How to apply Magic number, step by step
- Pick the revenue basis. Choose recurring revenue or ARR if you track it, and subscription revenue if you do not. Leave out services, one-off fees and unpredictable usage charges. Result: one revenue line you will use every quarter.
- Take the change between two quarters. Subtract last quarter's revenue from this quarter's. If you use ARR instead of quarterly revenue, the difference is already annual. Result: the revenue the business added in the quarter.
- Annualize if you used quarterly revenue. Multiply the change by four so a quarter of new revenue is expressed as a yearly figure. Skip this step only when you started from ARR. Result: new revenue on the same annual scale as the spend it is compared with.
- Divide by last quarter's S&M spend. Use the full sales and marketing cost one quarter earlier: salaries, commissions, ads, tools and agency fees. The lag reflects the time deals take to close. Result: the magic number.
- Read it against a band and a trend. Compare the figure with the 0.5, 0.75 and 1.0 rules of thumb, then look at the last four quarters instead of one. Result: a direction (improving or sliding) rather than a single verdict.
- Check it against payback and retention. Convert the result to a rough payback, then test it with gross margin and net revenue retention. Result: a decision on whether to raise, hold or cut go-to-market spend.
Examples
A B2B software company (illustrative)
Applying the [CFI formula](https://corporatefinanceinstitute.com/resources/valuation/saas-magic-number/): quarterly recurring revenue rises from $2.0M to $2.3M. Last quarter's sales and marketing spend was $1.2M. Four times the quarter's gain, divided by that spend, gives a magic number of 1.0. Each dollar of spend added about a dollar of annual revenue.
A membership clinic group (illustrative)
Applying the [CFI formula](https://corporatefinanceinstitute.com/resources/valuation/saas-magic-number/): quarterly membership revenue grows from $1.20M to $1.38M, and the prior quarter's marketing and front-desk sales cost was $0.9M. Four times the gain, divided by that cost, gives 0.8. Because membership margin is lower than software margin, the clinic should check payback on gross profit too.
A payments company (illustrative)
Applying the [CFI formula](https://corporatefinanceinstitute.com/resources/valuation/saas-magic-number/): net revenue from merchant processing grows from $500k to $560k in a quarter, against $400k of sales and marketing cost the quarter before. The ratio is 0.6. Transaction revenue moves with merchant volume, so one slow month can pull the figure down without any change in sales performance.
When to use it
Use it as a quick quarterly check on a company that sells subscriptions or other recurring revenue and has at least a year of history. It is useful for a board or investor conversation about whether to add sales and marketing budget, and for spotting a slide in efficiency early.
When not to use it
Skip it for one-off or project revenue, for companies with very lumpy enterprise deals where one quarter is noise, and for businesses where much revenue arrives without sales spend (viral or product-led growth). It also says nothing about margin, retention or cash, so it cannot be the only gauge.
Common mistakes
- Comparing your figure with a benchmark built on another formula. GAAP revenue times four and ARR without the multiplier give different numbers for the same company.
- Using the current quarter's spend as the denominator. The standard version lags spend by a quarter, and removing the lag makes a fast-growing company look worse.
- Reading one quarter. Enterprise deal timing and seasonality can swing a single result by a large margin, so use a four-quarter view.
- Ignoring gross margin and churn. A company with thin margins or heavy churn can post a healthy ratio and still lose money on each customer.
- Treating 0.75 as a law. It is a rule of thumb from investors, and the right level depends on funding, segment and stage.
FAQ
What is a good SaaS magic number?
Most sources treat 0.75 as the line above which spending on growth is justified. Scale Venture Partners uses about 0.7 as a healthy baseline. Many guides call above 1.0 strong and below 0.5 a warning. These are rules of thumb, and the right level depends on funding and market.
How do you calculate the SaaS magic number?
Subtract last quarter's recurring revenue from this quarter's, multiply by four, and divide by last quarter's sales and marketing spend. If you use ARR instead, the multiplication by four is dropped because ARR is already annual. State which basis you used, since the two give different results.
Who invented the magic number?
Sources disagree. Scale Venture Partners says Rory O'Driscoll named it while analyzing Omniture. Josh James, Omniture's CEO, said in a talk that he helped invent it with one of his investors. Lars Leckie of Hummer Winblad was first to publish the formula and credited James's talk.
What is the difference between magic number and CAC payback?
The magic number measures how much annual revenue each sales and marketing dollar adds across the company. CAC payback measures how many months a customer's gross profit takes to repay their acquisition cost. The two are linked by an inverse, but payback includes gross margin and the magic number usually does not.
Should the magic number use ARR or GAAP revenue?
ARR or recurring revenue is preferred when you have it, because it excludes one-off income. Public-company analysts often use GAAP or subscription revenue because ARR is not disclosed. Scale's own public explanation uses annualized GAAP revenue. Whichever you pick, keep it the same every quarter.
Sources
- Scale Venture Partners, SaaS Metrics: A History of the Magic Number (Dale Chang, 2020)
- Scale Venture Partners, The Magic Number
- Scale Venture Partners, Magic Number calculator for SaaS (2015)
- Scale Venture Partners, From 0 to $1M: the magic number
- Lars Leckie (Hummer Winblad), Magic Number for SaaS Companies, guest post on Will Price's blog (4 March 2008)
- SaaStr, Josh James, Domo and Omniture, video transcript
- Deseret News, Omniture raises $65M in 3 rounds (14 July 2005)
- Corporate Finance Institute, The SaaS Magic Number: a guide to calculation and analysis
- Wall Street Prep, SaaS magic number
- Jirav, What is the SaaS magic number?
- Orb, The magic number in SaaS
- Lighter Capital, The SaaS magic number explained
- Fiscal Lion, SaaS magic number
- SaaStr (Jason Lemkin), IVP: the average SaaS magic number is 1.2
- Tomasz Tunguz, Sales efficiency and the magic number (2013)
- Nnamdi Iregbulem, There's nothing magical about the SaaS magic number (2021)
- CJ Gustafson, Mostly Metrics, Is the magic number a bad party trick? (2023)
- Corporate Finance Institute, Burn multiple and capital efficiency in SaaS
- Bessemer Venture Partners, Scaling to $100 million
- SaaStr (Jason Lemkin), Good benchmarks for sales productivity in SaaS
- David Skok, For Entrepreneurs, SaaS Metrics 2.0
Last updated Oct 9, 2026


Marketing agency or growth system: when a company outgrows its agency
An agency is the right call while the founder still runs most of the company. Once the business starts copying itself into new locations or markets, it needs a system that sets goals, tests hypotheses and owns the result.

Why healthcare marketing agencies stall: the short, mid and long wins model we use with clinics
Most agencies own the click and nobody owns the front desk. How we structure clinic work in three horizons, the research behind each one, and one year of results.

How to calculate channel payback and unit economics
A CAC number that only marketing believes will not survive a finance review. This guide calculates channel payback so both teams work from the same model.