Leading vs lagging indicators
Leading and lagging indicators are two kinds of measures: the first move before a result and help you steer, the second report the result after it has happened.
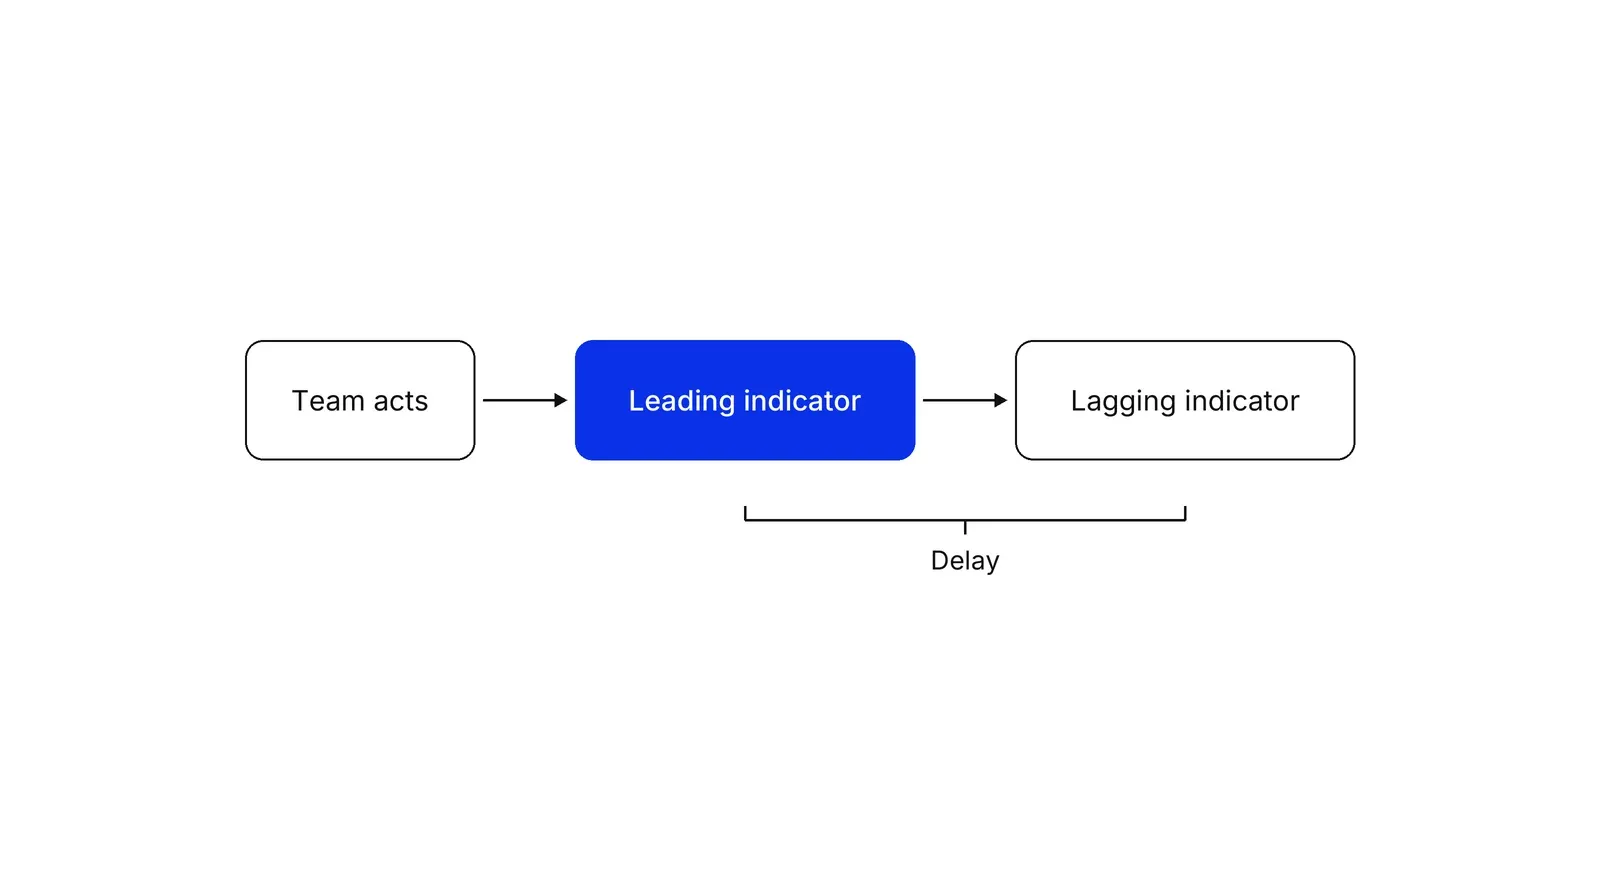
A leading indicator is a measure that moves before the result you care about, such as sales demos booked this month ahead of next quarter's revenue. A lagging indicator reports a result after it has happened, such as revenue or churn. The idea comes from business-cycle economics in the 1930s, and managers now use leading measures to steer work and lagging ones to check it paid off.
- Origin
- Wesley C. Mitchell and Arthur F. Burns (economics); Kaplan and Norton, McChesney, Covey and Huling (management), 1938; 1992; 2012
- Level
- 201 · Tool
- Fits
- Small and mid-size, Scale-up, Enterprise
- Time to apply
- one 60-minute session per goal, then a monthly check of whether the leading measure still predicts
- What you need
- one result you already track and care about, with at least 12 months of history · the activity and customer data that come before that result, in a spreadsheet or analytics tool · someone who can pull the same figures every week
A leading indicator is a measure that changes before the result you care about, and a lagging indicator is a measure that reports the result after it has happened. Revenue, profit and churn are lagging: by the time they move, the work that caused them is months behind you. Demos booked, trials started and patients who return within a week are candidates for leading: they move first and give you time to act.
The pair comes from economics, was adopted by management writers in the 1990s and is now standard vocabulary in sales, product and operations teams.
Where does the idea come from?
It comes from research on business cycles. In 1938 the National Bureau of Economic Research published Statistical Indicators of Cyclical Revivals by Wesley Mitchell and Arthur Burns, which the Bureau of Economic Analysis describes as the first formal list of cyclical indicators. NBER issued revised lists in 1950, 1961 and 1967. By 1961 the Census Bureau’s Business Cycle Developments grouped more than fifty series as leading, roughly coincident or lagging, depending on their timing against the cycle.
The best-known descendant is the Conference Board Leading Economic Index. It combines ten series, among them building permits, new unemployment insurance claims and the ISM new orders index, and the Board says it anticipates turning points by about seven months. Alongside it sit a coincident index and a lagging index.
Economists have a clean example of a lagging verdict. The NBER dating committee works retrospectively and waits until it is confident before naming a peak. It named the December 2007 peak on December 1, 2008, a year after the event.
How did it reach management?
Kaplan and Norton carried the logic into companies. Their 1992 Harvard Business Review article argued that what you measure is what you get and that financial measures alone mislead. Their 1996 paper says a scorecard should hold outcome measures and the performance drivers behind them. Kaplan later wrote that the scorecard pairs operational metrics as leading indicators with financial metrics as lagging outcomes. The full structure is in the balanced scorecard.
What do the management versions add?
They add a requirement that economists did not need: the team must be able to move the measure. FranklinCovey’s 4 Disciplines of Execution calls a lead measure one that predicts the lag measure and is influenced directly by the team. That is a narrower category than a leading indicator, because building permits lead the economy but no company controls them. Working Backwards, the site built around Amazon’s operating routines, prefers the term controllable input metrics to leading indicators for the same reason. The method is covered in 4 Disciplines of Execution.
| Term | Moves before the result | Team can move it | Typical example |
|---|---|---|---|
| Leading indicator | Yes | Not always | Building permits; trial sign-ups |
| Lead measure (4DX) | Yes | Yes | Weekly outreach calls made |
| Controllable input metric | Yes | Yes | Items added to the catalog |
| Lagging indicator | No | Only indirectly | Revenue; churn |
Do leading indicators really predict?
Often partly, and sometimes not. A leading indicator is a hypothesis about the future, and the evidence from economics is mixed. Koenig and Emery found in 1994 that the Commerce Department’s composite leading index failed to give reliable advance warning of turning points in real time. The BEA’s review of the 2007 recession says leading series indicate the direction of a cycle, not its magnitude. One single series fared better: Estrella and Mishkin found the yield curve outperformed other indicators at predicting recessions two to six quarters ahead.
The business record is just as split. Anderson, Fornell and Lehmann found that customer satisfaction raised profitability in Swedish data. Reichheld’s Net Promoter claim did not hold up when Keiningham and colleagues tried to replicate it with data from 21 firms. A 2016 MIT Sloan Management Review piece notes that customer satisfaction is often a weak leading indicator of financial results. The lesson is to test every pairing against your own data, as Ittner and Larcker argued when they described nonfinancial measures as an early view of progress.
How do leading measures go wrong?
They go wrong when people are paid or praised for hitting them. Steven Kerr’s classic 1975 paper describes reward systems that pay off for one behavior while hoping for another. Donald Campbell stated the same risk for social indicators: the more one is used for decisions, the more open it is to manipulation. If a team is judged on demos booked, it can book demos nobody needs.
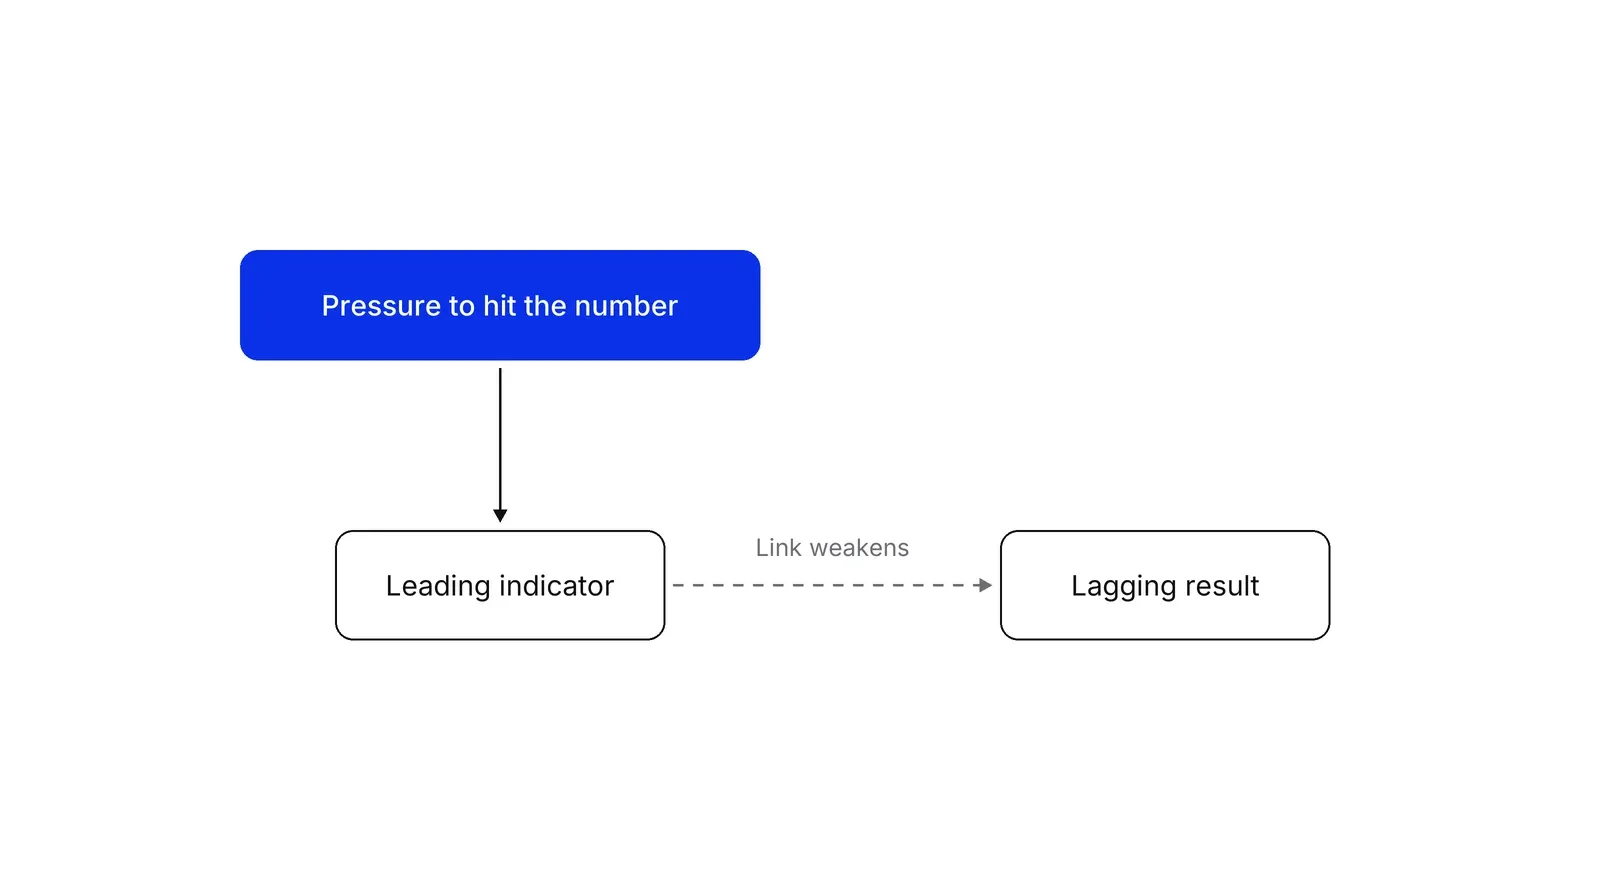
The defence is a lagging check. Keep the result on the same dashboard and look at both every month.
How do you choose a leading measure?
Pick one that passes three checks. It must have moved before the result in your own past data, with a gap in time that stays roughly stable. It must be something a named person can change this week. And it must be hard to fake without also producing the result. A measure that fails the third check, such as calls logged instead of conversations held, needs a lagging check next to it.
Where does this sit with other frameworks?
Start from the KPI tree, which shows the lagging goal at the top and the drivers beneath. The north star metric is a leading metric for revenue, and activation is a typical leading measure of retention. A customer health score bundles leading signals into one prediction of churn. A Growth Lab plan starts from the lagging goal and works backward to the few leading measures worth a weekly review: see the Growth Lab practice.
How to apply Leading vs lagging indicators, step by step
- Name the lagging result. Pick the one outcome the goal is judged on: revenue, retained patients, 90-day customer retention. Write it with a number and a date. Result: one lagging indicator that everyone agrees is the scoreboard.
- List what happens before it. Walk backwards from the result and write every event or activity that comes earlier, from first contact to the last action before the result is booked. Result: a list of 8 to 15 candidate leading measures.
- Test which candidates really lead. Line up each candidate against the result by period and check that it moves first and that the gap in time is stable. Compare cohorts that did the thing with cohorts that did not. Result: two to four candidates that moved before the result in past data.
- Keep the ones your team can move. A leading measure that nobody can influence, such as the weather or a rival's price, is a warning light. Keep the ones the team affects with its own actions. Result: one to three measures with a named owner each.
- Set the expected delay and a target. Write down how long a change in the leading measure should take to show up in the lagging one, and set a weekly target. Result: a sentence of the form: if we hit this each week, we expect that result in about this many weeks.
- Review weekly and re-test quarterly. Look at the leading measures every week and the lagging result every month or quarter. Each quarter, check whether the old link still holds. Result: either a confirmed pair or a measure you retire.
Examples
A dental clinic
Illustrative, no real clinic implied. A clinic with 400 patients a month tracks revenue, a lagging indicator it sees only after treatments are done and invoices paid. Its leading measures are first-visit bookings per week and the share of treatment plans accepted at the consultation. If 100 new patients book each week and 60% of them accept a plan, 60 plans start weekly, which tells the owner about next month's revenue before it arrives.
A payments product
Illustrative. A cross-border payments app judges itself on 90-day retention, which takes three months to read. The team tests whether users who send a first transfer within 7 days of sign-up stay longer than those who do not. If 50% of sign-ups send within a week and the team lifts that to 60%, the retention effect can be checked on that cohort 90 days later, while the weekly activation rate steers daily work.
The US economy in 2006 and 2007
The Conference Board's composite leading index started to decline in December 2006, a year before the December 2007 peak of the economy, according to the Bureau of Economic Analysis. The official dating body, the NBER Business Cycle Dating Committee, announced that peak on December 1, 2008, after it was sure a recession had happened. One lagging verdict arrived a year after the event, and a leading signal had come a year before it.
When to use it
Use it when the result you care about arrives too late to act on, such as annual retention, quarterly revenue or a hospital readmission rate. It is also useful when a team keeps debating whether last month's number was luck, since a leading measure shows the direction several weeks sooner.
When not to use it
Skip it when the result is fast enough to steer directly, such as daily sales of a product that sells on the day. Also skip it when you have too little history to test whether a candidate really leads. With under a year of data, you are guessing, and a guess dressed as an indicator gets managed as a fact.
Common mistakes
- Choosing a leading measure because it is easy to count, without checking that it moved before the result in past data.
- Treating a leading indicator as proof. It is a hypothesis about the future, and economists' own composite index has missed turning points in real time.
- Setting a target on the leading measure and rewarding people for hitting it, which invites hitting the number without producing the result behind it.
- Picking leading measures the team cannot influence, so the dashboard warns of trouble and nobody can act on it.
- Never re-testing the link. A pairing that held for two years can break when the product, the market or the customer mix changes.
FAQ
What is a leading indicator?
A leading indicator is a measure that tends to change before the result you want to predict. Building permits move before construction spending, and booked demos move before closed deals. It gives advance notice, not certainty, so it should be checked against past data before anyone relies on it.
What is the difference between leading and lagging indicators?
Leading indicators move before the outcome and let you act in time. Lagging indicators report the outcome after the fact, such as revenue, profit or churn. Economists also use coincident indicators that move with the economy. Managers need both: leading ones to steer, lagging ones to confirm the steering worked.
What are examples of leading indicators in sales?
Common ones are qualified meetings booked, proposals sent, pipeline created per week and the share of leads contacted within an hour. Closed revenue is the lagging indicator they feed. Which of these actually lead depends on your sales cycle, so test each against your own past revenue by period before trusting it.
Is Net Promoter Score a leading or lagging indicator?
It is sold as a leading indicator of growth, and the evidence is contested. Reichheld proposed it in 2003 as the number that predicts growth. Keiningham and colleagues failed to replicate its claimed superiority over other loyalty measures using data from 21 firms. Test it against your own retention before using it as a predictor.
How do you find good leading indicators?
Start from the lagging result and work backwards through everything that happens earlier. Test each candidate against past results for timing and stability, then keep those your team can influence. Review them quarterly, because the link between a leading measure and an outcome can weaken over time.
Sources
- Wesley C. Mitchell and Arthur F. Burns, Statistical Indicators of Cyclical Revivals, NBER, 1938
- Geoffrey H. Moore, Statistical Indicators of Cyclical Revivals and Recessions, NBER, 1950
- Carol E. Moylan, Cyclical Indicators for the United States, Bureau of Economic Analysis, 2010
- Saul H. Hymans, On the Use of Leading Indicators to Predict Cyclical Turning Points, Brookings Papers on Economic Activity, 1973
- The Conference Board, US Leading Indicators
- NBER, US Business Cycle Expansions and Contractions, dating procedure
- NBER Business Cycle Dating Committee, announcement of December 1, 2008
- James H. Stock and Mark W. Watson, New Indexes of Coincident and Leading Economic Indicators, NBER Macroeconomics Annual, 1989
- Evan F. Koenig and Kenneth M. Emery, Why the Composite Index of Leading Indicators Does Not Lead, Contemporary Economic Policy, 1994
- Arturo Estrella and Frederic S. Mishkin, The Yield Curve as a Predictor of U.S. Recessions, Federal Reserve Bank of New York Current Issues, June 1996
- Robert S. Kaplan and David P. Norton, The Balanced Scorecard: Measures that Drive Performance, Harvard Business Review, January 1992
- Robert S. Kaplan and David P. Norton, Linking the Balanced Scorecard to Strategy, California Management Review 39(1), 1996
- Robert S. Kaplan, Conceptual Foundations of the Balanced Scorecard, Harvard Business School Working Paper 10-074, 2010
- FranklinCovey, The 4 Disciplines of Execution, Discipline 2: Act on the Lead Measures
- FranklinCovey, The 4 Disciplines of Execution, book page (McChesney, Covey, Huling, 2012; second edition)
- Working Backwards LLC, Input metrics
- Christopher D. Ittner and David F. Larcker, Are Nonfinancial Measures Leading Indicators of Financial Performance? An Analysis of Customer Satisfaction, Journal of Accounting Research 36, 1998
- Christopher D. Ittner and David F. Larcker, Coming Up Short on Nonfinancial Performance Measurement, Harvard Business Review, November 2003
- Eugene W. Anderson, Claes Fornell and Donald R. Lehmann, Customer Satisfaction, Market Share, and Profitability: Findings from Sweden, Journal of Marketing 58(3), 1994
- Frederick F. Reichheld, The One Number You Need to Grow, Harvard Business Review, December 2003
- Timothy L. Keiningham, Bruce Cooil, Tor W. Andreassen and Lerzan Aksoy, A Longitudinal Examination of Net Promoter and Firm Revenue Growth, Journal of Marketing 71(3), 2007
- Vincent O'Connell and Don O'Sullivan, Are Nonfinancial Metrics Good Leading Indicators of Future Financial Performance?, MIT Sloan Management Review, 2016
- Steven Kerr, On the Folly of Rewarding A, While Hoping for B, Academy of Management Journal 18(4), 1975
- Donald T. Campbell, Assessing the Impact of Planned Social Change, Evaluation and Program Planning 2(1), 1979
Last updated Oct 9, 2026


Fractional COO or embedded operations team? How to choose at Series A
The two models solve different problems: how to tell which one your company needs, and what each costs in time and control.

What operational systems successful fintech startups use: lessons from ten companies
Starling, Monzo, Qonto, bunq, Lunar, Pleo, Tide, Ramp, Mercury and Column scaled on four operating systems. Regulators' findings show what breaks when one of them lags behind growth.

Marketing agency or growth system: when a company outgrows its agency
An agency is the right call while the founder still runs most of the company. Once the business starts copying itself into new locations or markets, it needs a system that sets goals, tests hypotheses and owns the result.