Customer value map
A customer value map plots every competitor in a market by the quality customers perceive against the price they pay, with a fair-value line showing which offers are a good deal and which are overpriced.
A customer value map is a chart that places each competitor in a market by relative quality, as customers rate it, against relative price. A fair-value line marks where price matches quality. Offers below the line give better value and tend to gain share; offers above it tend to lose share. Bradley Gale set out the method in his 1994 book Managing Customer Value.
- Origin
- Bradley T. Gale, with Robert Chapman Wood, 1994
- Level
- 301 · Advanced
- Fits
- Small and mid-size, Scale-up
- Time to apply
- two to four weeks for the customer survey, then one working session to draw and read the map
- What you need
- a list of the three to eight competitors customers actually compare you with · survey answers from customers of every competitor, not only your own · current prices for each competitor, on the same unit (per month, per transaction, per visit)
A customer value map is a chart that places every competitor in a market by two numbers: the quality customers perceive, relative to the market, and the price they pay, also relative to the market. A diagonal fair-value line runs through the middle. Offers below the line are good deals in the customer’s eyes. Offers above it are overpriced for what customers think they get.
Bradley T. Gale set out the method in Managing Customer Value, written with Robert Chapman Wood and published by Free Press in 1994. Publishers Weekly described the book as being about relative quality and value as perceived by customers. Product managers, pricing teams and B2B sales leaders use the map to answer one question: where do we stand against rivals on price and quality, as buyers see it?
Where the idea came from
The map grew out of the PIMS research programme, short for Profit Impact of Market Strategy. Gale was a co-author, with Robert Buzzell and Ralph Sultan, of the 1975 Harvard Business Review article that reported high-share businesses earn considerably more than smaller rivals. He later served as research director and then managing director of the Strategic Planning Institute, according to his speaker profile, and co-wrote The PIMS Principles with Buzzell in 1987.
PIMS measured quality relative to competitors, not in absolute terms. Phillips, Chang and Buzzell (1983) found that a high relative quality position did not rule out a low relative cost position. Jacobson and Aaker (1987), also working with PIMS data, found that a quality strategy can raise profitability. Gale’s step was to ask customers, across the whole market, how they rate quality, and then set that rating against price.
The two axes: relative quality and relative price
Relative quality is a customer-perceived score divided by the market average. You list the key buying factors, ask buyers how much each one weighs, have them rate every supplier on each factor, and add up the weighted scores. Gale and Donald Swire stress in their 2006 paper that the survey must cover customers of all key vendors, not only your own.
Relative price is the price customers pay divided by the average price, on the same unit. In a worked example from a Delft University spin-off, an organic vegetable scores 7.1 against 6.7 for the ordinary one, a quality ratio of 1.06, while costing 15% more, a price ratio of 1.15. The extra price is larger than the extra quality, so shoppers see the organic product as too expensive.
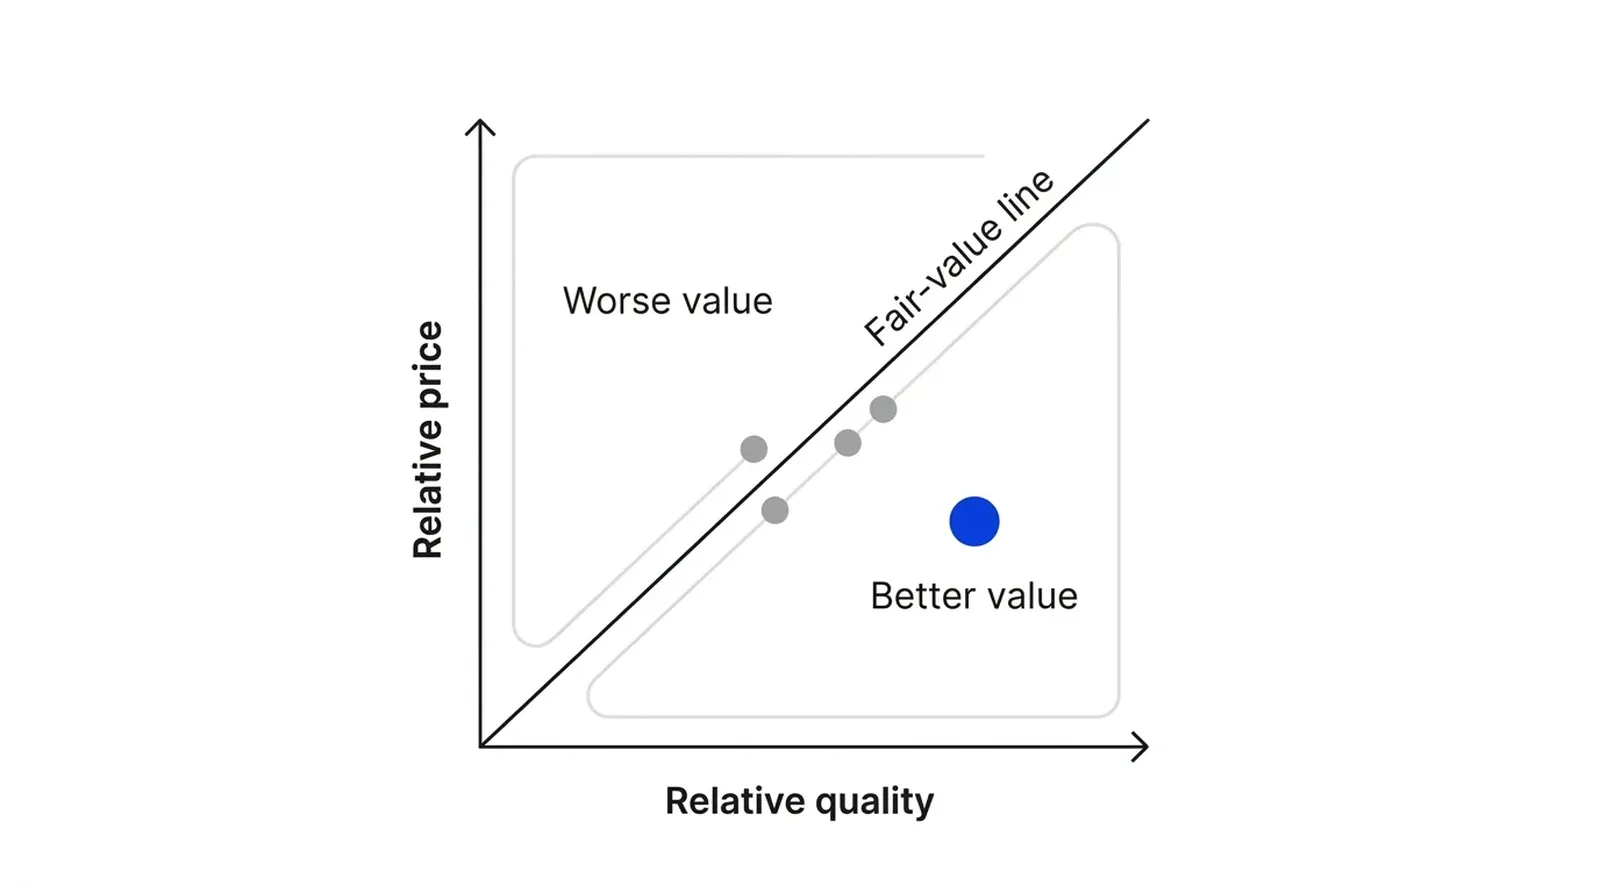
What does the fair-value line show?
The fair-value line marks every combination of price and quality that customers would call fair. Gale draws it through the market’s average price and average performance. Its slope is the price customers pay for one more point of quality. In Gale and Swire’s room air cleaner example, built on Consumer Reports data, the slope was $115 per point on a 1 to 10 scale.
A 1996 Quirk’s article by Alex Vayslep of Maritz Research defines the line as the points where a provider should neither gain nor lose market share. Leszinski and Marn at McKinsey describe the same logic in their 1997 piece Setting value, not price, where they call it the value equivalence line. A competitor below it is value-advantaged and should gain share; one above it is value-disadvantaged and should lose share.
How to get back below the line
A competitor above the line has two direct moves. It can lower the price until it meets the line, or raise the quality customers perceive until the current price looks fair. The Delft example adds a third, slower move: change which attributes customers weigh most, for instance by making health matter more than availability.
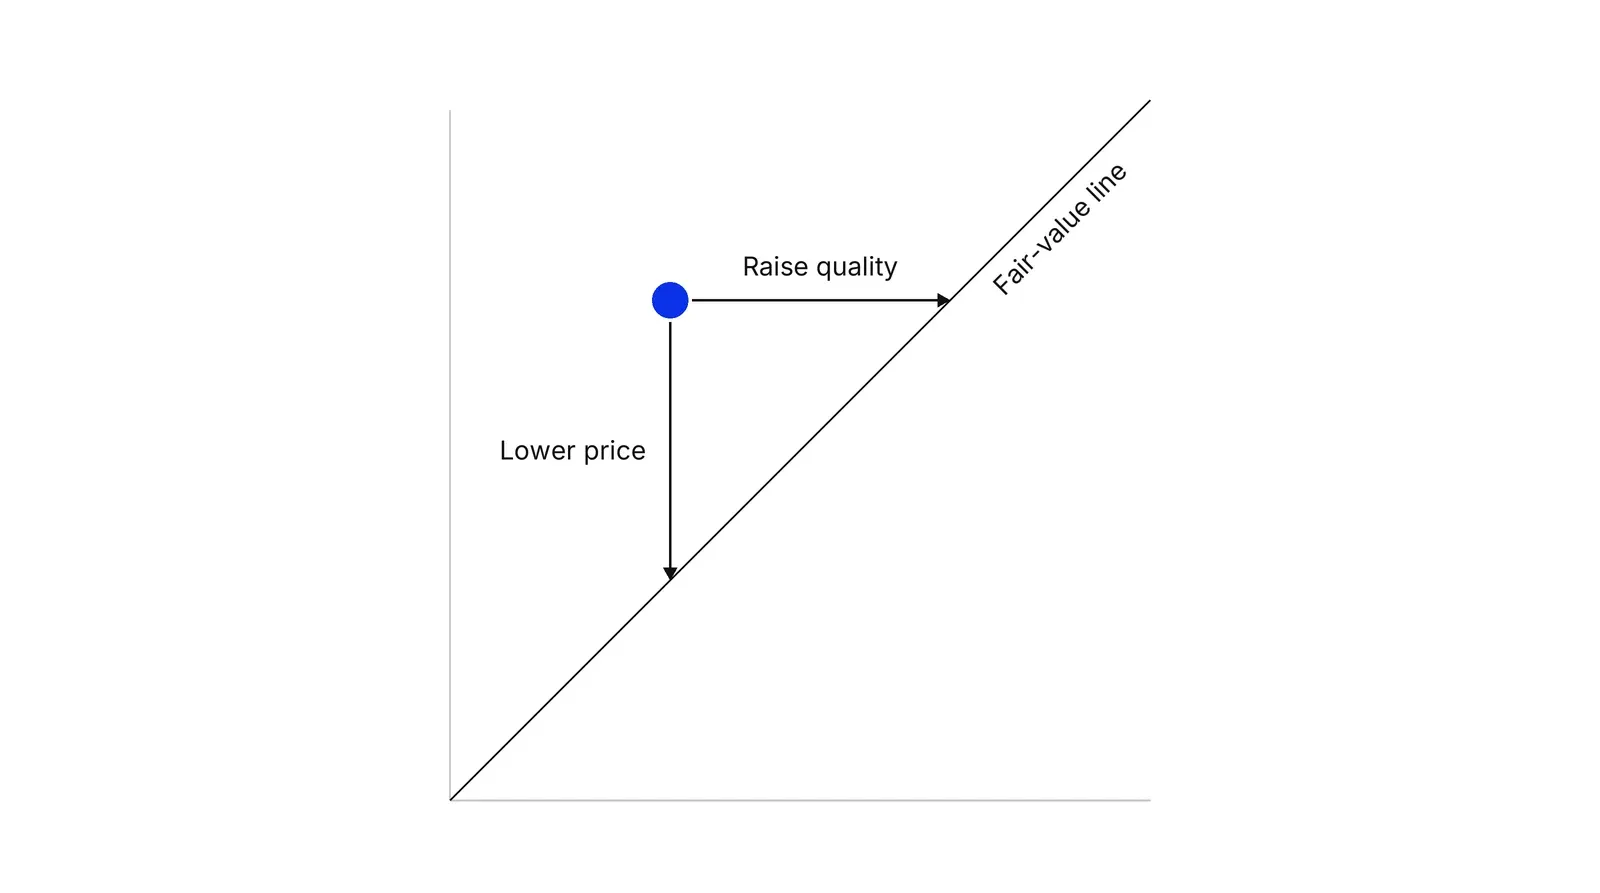
Raising perceived quality is usually the better move. McKinsey’s disguised case, Alpha Computer, believed it beat a rival on speed at a lower price. A survey of 60 buyers ranked processor speed fourth and storage access sixth, behind compatibility, reliability and support. Once Alpha fixed those, it raised its price 8%, gained share and more than doubled operating profit. Kordupleski, Rust and Zahorik (1993) make a similar point: quality programmes fail when they improve internal processes customers never notice.
Using the map to price a launch
The map also gives a price for a new product. Gale’s 2017 note on Lipitor places it at 7.7 on a performance index, ahead of Zocor at 6.6. With customers paying about $23 a month per point, Lipitor’s warranted value was $137 a month against a launch price of $84. Against Zocor alone, at $95, Lipitor was worth $26 more, or $121. The gap between worth and price is the customer’s surplus; Gale leaves open whether it was too generous.
The formula Gale and Swire give is simple: justified price equals the reference product’s price, plus the worth of your advantages, plus any cost savings in use.
How it compares with similar tools
| Tool | What it plots | Prices shown | Competitors shown |
|---|---|---|---|
| Customer value map | Relative quality against relative price | Yes | All main rivals |
| Brand positioning map | Perception on two chosen attributes | Sometimes | Yes |
| Strategy canvas | Scores on every competing factor | As one factor | Yes |
| Competitive analysis matrix | Weighted scores in a table | Optional | Yes |
| Value Proposition Canvas value map | Products, pain relievers, gain creators | No | No |
| Value stream map | Steps from order to delivery | No | No |
The competitive analysis matrix gives you the weighted scores; the value map adds price and turns them into a picture of who is a good deal. Once you know where you stand, the value proposition is where you put the advantage into words.
Where the map misleads
The fair-value line describes a market at rest. Leszinski and Marn open with a consumer goods company that matched a rival’s price on one large contract and set off a price war that wiped out most of the category’s profit. Moving below the line by price alone invites competitors to follow, and the whole line drops.
Customers are also not spread evenly along the line. McKinsey points to price-capped buyers, who will not pay above a fixed amount, and benefit-bracketed buyers, who reject anything outside a performance range. A position on the line can still have no volume. Hinterhuber (2008) notes that more than 80% of companies still price mainly on costs or competitor prices, so the survey work behind a value map is rarer than its simplicity suggests. In Pushers’ Growth Lab work, this is the map we want before any price test, because it says whether to change the price or the product.
How to apply Customer value map, step by step
- Define the market and the rivals. Name the segment and the offers a customer weighs before buying. A clinic chain selling knee surgery to self-pay patients competes with different providers than one selling to insurers. Result: one segment and a short list of competitors.
- Find the buying factors and their weights. Ask customers which attributes decide their choice and how much each one counts, so the weights add up to 100. Include service and relationship factors, because buyers often rank them above technical specs. Result: a list of key buying factors with weights.
- Score every competitor on every factor. Have customers of all the main competitors rate each supplier on a 1 to 10 scale. Multiply each score by its weight and add up. Result: one overall quality score per competitor.
- Turn scores and prices into ratios. Divide each competitor's quality score by the market average, and its price by the average price. A ratio of 1.10 on quality means customers rate it 10% above average. Result: two numbers per competitor, relative quality and relative price.
- Plot the map and draw the fair-value line. Put relative quality on the horizontal axis and relative price on the vertical one. Draw the fair-value line through the average point, with a slope that shows how much more customers pay for each extra point of quality. Result: a map where every competitor sits on, above or below the line.
- Pick a move and check it against share. If you sit above the line, choose between cutting price and raising the quality customers perceive. Compare positions with the last year of market share data, then repeat the survey once a year. Result: one priced decision and a date to remeasure.
Examples
Lipitor's launch price
Gale used a value map, at 1997 prices, to analyse the launch of Lipitor, the fifth statin on the market. In his 2017 note, Lipitor scored 7.7 on an overall performance index built from cholesterol and triglyceride effects, against 6.6 for Zocor and 4.0 for Lescol. The fair-value line implied customers paid about $23 a month per extra point, so Lipitor's warranted value was $137 a month. It launched at $84, leaving customers a $53 surplus. Gale asks whether Pfizer and Parke-Davis left money on the table.
A minicomputer maker that misread its position
McKinsey's Ralf Leszinski and Michael Marn describe a supplier, disguised as Alpha Computer, that thought it was cheaper and faster than a rival yet kept losing share. A survey of 60 buyers ranked processor speed fourth and storage access sixth, behind compatibility, reliability and technical support. Redrawn with customer weights, the map put Alpha above the line. After fixing those attributes, Alpha raised its price 8% and still gained share, and its operating profit more than doubled.
A payment gateway for small merchants
Illustrative, no real company implied. Three gateways charge 1.8%, 2.0% and 2.2% per transaction; the average fee is 2.0% and the average quality score is 7.0. Suppose merchants pay 0.2 percentage points more for each extra point of quality. A gateway scoring 7.5 has a fair fee of 2.1%. If it charges 2.3%, it sits above the line and should expect churn. It can cut the fee to 2.1%, or lift its score to 8.5, where 2.3% becomes fair.
When to use it
Use it before setting a launch price, when share is slipping and nobody agrees whether price or product is the cause, or when sales says the product is too expensive and product says it is the best on the market. It works best in mature categories where customers compare a known set of rivals and where you can survey customers of competitors as well as your own.
When not to use it
Skip it for a new category with no real alternatives to compare against, since there is no market average to draw a line through. It also misleads when you cannot reach rivals' customers and fill the scores from internal opinion. For a quick qualitative look at how brands are perceived, a perceptual map is cheaper.
Common mistakes
- Scoring quality from your own team's view of the product. The Alpha Computer case shows internal and customer weights can point in opposite directions.
- Surveying only your own customers. They chose you already, so their ratings overstate your quality relative to the market.
- Treating a position below the line as free share. A visible price cut can trigger matching cuts and drag the whole line down.
- Plotting list prices when buyers pay something else. Use the price customers actually pay, including discounts and total cost of use.
- Drawing the map once and filing it. Positions shift as rivals launch and reprice, so the survey needs a yearly repeat.
FAQ
What is a customer value map?
It is a chart that places each competitor by the quality customers perceive, relative to the market, against its relative price. A diagonal fair-value line shows where price matches quality. Bradley Gale described it in Managing Customer Value in 1994 as a way to see which offers customers regard as good deals.
What is the fair-value line on a value map?
It is the line along which price rises exactly in step with perceived quality. Gale draws it through the average price and average quality of the market. Its slope shows how much customers pay for each extra quality point. Offers below the line are better value; offers above it are overpriced.
How is a customer value map different from a value stream map?
They share a word and nothing else. A customer value map compares competitors on perceived quality and price. A value stream map, from lean manufacturing, diagrams every step of material and information flow from order to delivery to find waste inside one company's process.
Is the customer value map the same as the value map in the Value Proposition Canvas?
No. The Value Proposition Canvas value map lists your products, the pains they relieve and the gains they create for one customer profile. It has no prices and no competitors. Gale's customer value map plots several competitors on quality and price to compare value across the market.
How do you measure relative quality for a value map?
Ask customers of every competitor which attributes drive their choice and how much each matters. Have them score each supplier on those attributes, weight the scores and add them up. Divide each supplier's total by the market average to get its relative quality.
Sources
- Bradley T. Gale with Robert Chapman Wood, Managing Customer Value: Creating Quality and Service That Customers Can See, Free Press, 1994, Internet Archive record
- Publishers Weekly, review of Managing Customer Value, February 1994
- Bradley T. Gale and Donald J. Swire, Value-Based Marketing and Pricing, Customer Value, Inc., 2006
- Bradley T. Gale, Delivering Value to Customers at a Profit, Customer Value, Inc., 2017
- Customer Value, Inc., Value Strategy Toolkit and fair-value reference line
- Henry Stewart Talks, Dr. Bradley T. Gale, speaker profile
- Robert D. Buzzell, Bradley T. Gale, Ralph G. M. Sultan, Market Share: A Key to Profitability, Harvard Business Review, January 1975
- Robert D. Buzzell, Bradley T. Gale, The PIMS Principles: Linking Strategy to Performance, Free Press, 1987, Internet Archive record
- Lynn W. Phillips, Dae R. Chang, Robert D. Buzzell, Product Quality, Cost Position and Business Performance, Journal of Marketing 47(2), 1983
- Robert Jacobson, David A. Aaker, The Strategic Role of Product Quality, Journal of Marketing 51(4), 1987
- Valarie A. Zeithaml, Consumer Perceptions of Price, Quality, and Value: A Means-End Model and Synthesis of Evidence, Journal of Marketing 52(3), 1988
- Ray Kordupleski, Roland T. Rust, Anthony J. Zahorik, Why Improving Quality Doesn't Improve Quality (or Whatever Happened to Marketing?), California Management Review 35(3), 1993
- Robert B. Woodruff, Customer Value: The Next Source for Competitive Advantage, Journal of the Academy of Marketing Science 25(2), 1997
- Alex Vayslep, Customer Value Measurement, Quirk's Marketing Research Review, October 1996
- Ralf Leszinski, Michael V. Marn, Setting Value, Not Price, McKinsey Quarterly, February 1997
- Richard A. D'Aveni, Mapping Your Competitive Position, Harvard Business Review, November 2007
- James C. Anderson, James A. Narus, Business Marketing: Understand What Customers Value, Harvard Business Review, November-December 1998
- James C. Anderson, James A. Narus, Wouter van Rossum, Customer Value Propositions in Business Markets, Harvard Business Review, March 2006
- Andreas Hinterhuber, Customer Value-Based Pricing Strategies: Why Companies Resist, Journal of Business Strategy 29(4), 2008
- Sustainability Impact Metrics (Delft University of Technology spin-off), Gale: Managing Customer Value
- Strategyzer, The Value Proposition Canvas
- Lean Enterprise Institute, Value-Stream Mapping
Last updated Oct 9, 2026


Marketing agency or growth system: when a company outgrows its agency
An agency is the right call while the founder still runs most of the company. Once the business starts copying itself into new locations or markets, it needs a system that sets goals, tests hypotheses and owns the result.

Why healthcare marketing agencies stall: the short, mid and long wins model we use with clinics
Most agencies own the click and nobody owns the front desk. How we structure clinic work in three horizons, the research behind each one, and one year of results.

Why channel tests stall after month three
Most paid channel tests do not end with a decision. They end when the budget runs out, the attribution model changes, or everyone quietly stops looking at the dashboard.