ROAS and DRR
ROAS is revenue per unit of ad spend and DRR is ad spend as a share of revenue: the same ratio turned upside down, used to check whether advertising pays for itself.
ROAS (return on ad spend) is the revenue an ad campaign brings in divided by what it cost, so $5 of sales on $1 of spend is a ROAS of 5, or 500%. DRR (доля рекламных расходов, the Russian ad cost ratio) is the same numbers the other way round: spend divided by revenue, times 100. A ROAS of 5 equals a DRR of 20%.
- Origin
- Performance advertising practice; no single originator found, n/a
- Level
- 201 · Tool
- Fits
- Startup, Small and mid-size, Scale-up
- Time to apply
- 30 minutes to compute break-even ROAS for one product; one to two conversion cycles to test a target
- What you need
- ad spend and attributed revenue for the same period, from your ad platform or analytics · gross margin per order after variable costs: goods, delivery, payment fees · the refund and return rate, so revenue is counted after returns
ROAS is the revenue an advertising campaign brings in for each unit of money spent on it. DRR, short for доля рекламных расходов (share of advertising costs), is the Russian-market version of the same check, written the other way round: ad spend as a percentage of revenue. Both answer one question, how much sales came from the advertising, and neither says whether the business made money.
We found no single originator for either metric. ROAS and DRR come from performance advertising practice and now sit inside the reporting of the ad platforms themselves. That matters for one reason: each platform defines the term in its own help pages, so the first job is to read which revenue goes into the ratio.
ROAS and DRR are one ratio, flipped
ROAS divides revenue by ad spend, and DRR divides ad spend by revenue and multiplies by 100. Google’s help gives the example $5 of sales on $1 of spend is a target ROAS of 500%. Meta’s minimum ROAS is total purchase value over total spend, written as a plain multiple. Yandex’s explainer gives DRR as spend divided by revenue, times 100.
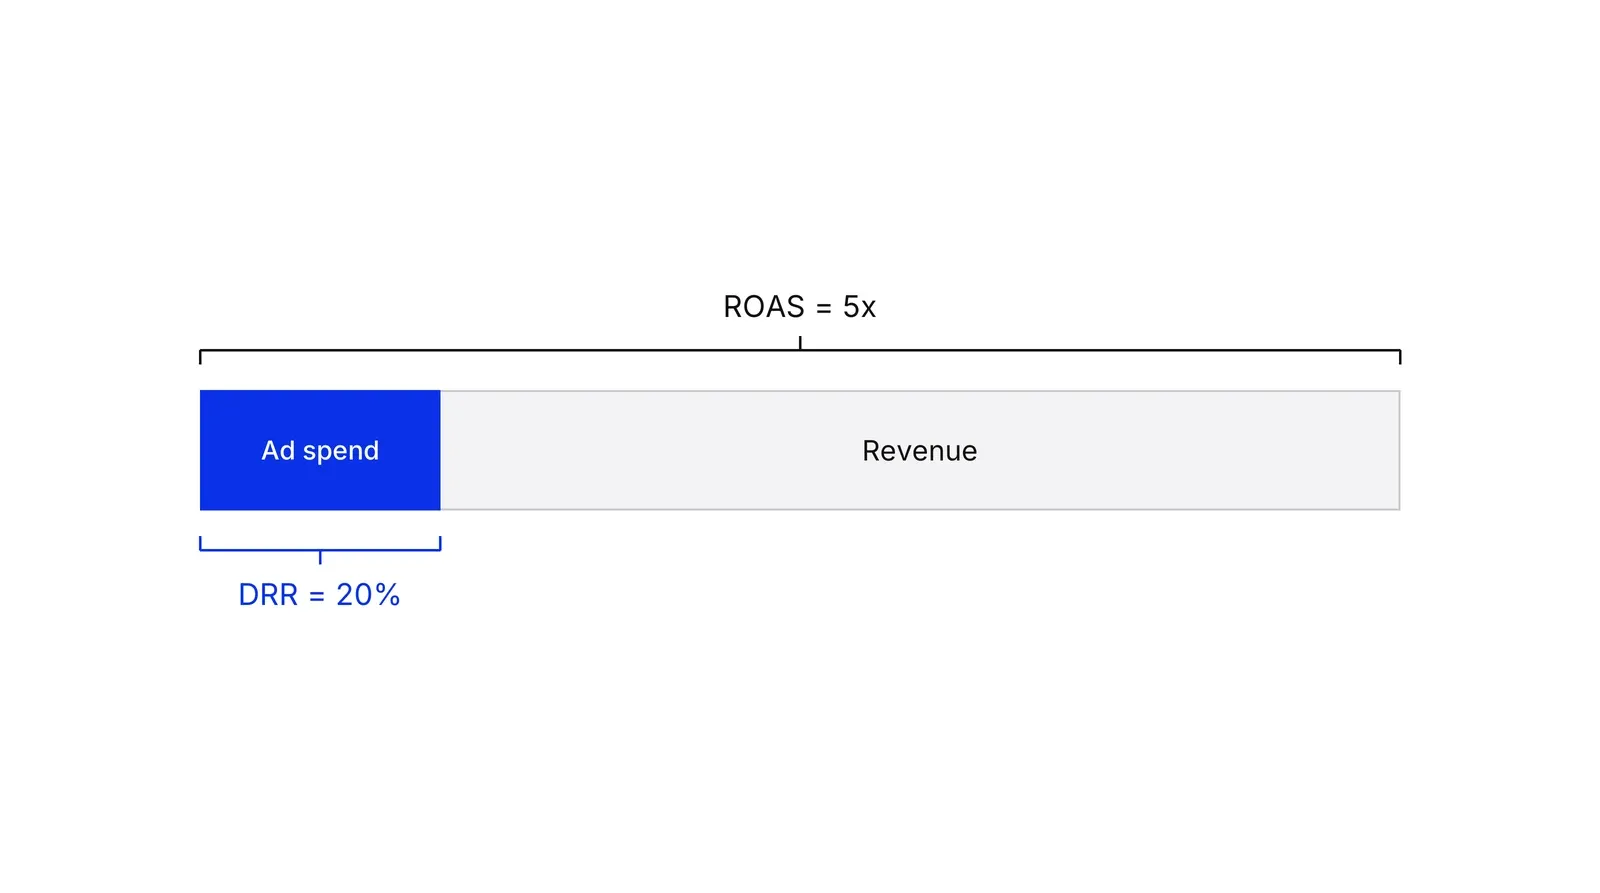
The conversion is a single division. ROAS 5 is DRR 20%, ROAS 4 is DRR 25%, ROAS 2.5 is DRR 40%. Higher ROAS is better, lower DRR is better. A DRR of 100% means revenue only covered the ad cost, and anything above it means the campaign spent more than it earned.
| ROAS | DRR | |
|---|---|---|
| Formula | revenue / ad spend | ad spend / revenue x 100% |
| Reads as | multiple (5) or percent (500%) | percent (20%) |
| Better when | higher | lower |
| Typical home | Google Ads, Meta, Amazon, Microsoft | Yandex Direct, Russian marketplaces |
In Yandex Direct, the revenue behind DRR depends on settings. The statistics help says revenue counts only goals you selected and that pass revenue, and its worked example gives a DRR by conversion value of 1,409 / 11,689 = 12%. Two reports with the same name can therefore use different revenue.
Break-even ROAS: start from margin
Break-even ROAS is 1 divided by gross margin as a decimal. A 40% margin gives 1 / 0.40 = 2.5, which means $2.50 of attributed sales for each $1 of ads, the formula Amazon Ads publishes. In DRR terms the break-even is simply the margin: a 40% margin tolerates a DRR of up to 40%.
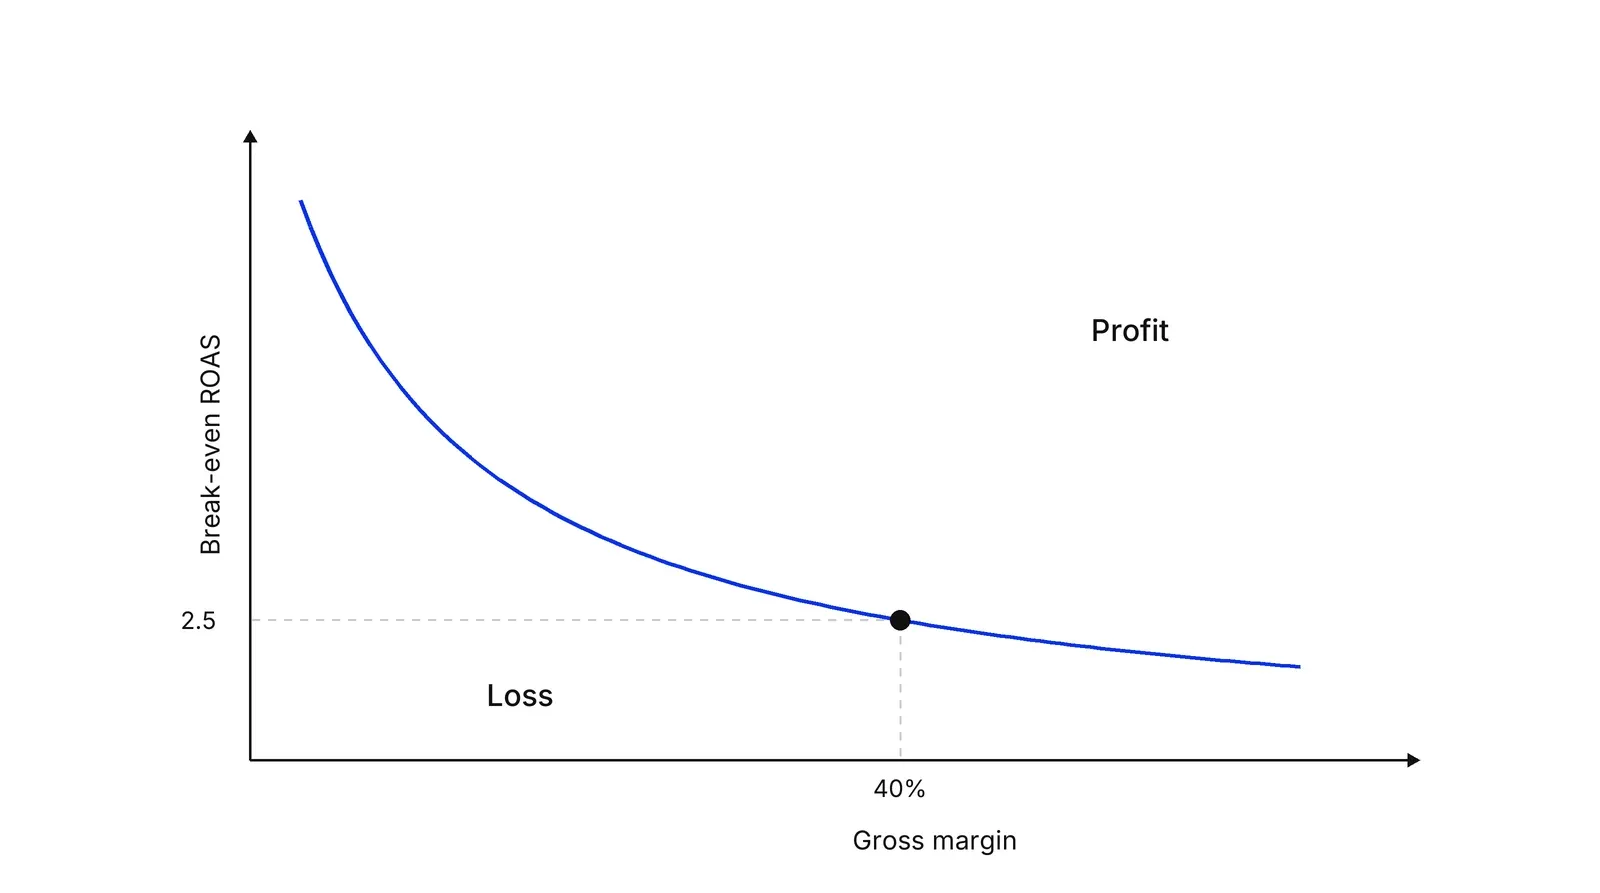
The margin must be the right one. Use revenue minus variable costs: goods, delivery, payment fees, contractor pay. Yandex’s Maximum profit guidance defines margin this way and warns that entering revenue instead of margin distorts the strategy. That is the contribution margin logic. Fixed costs and the ad budget stay out of it.
Break-even is only the floor. At exactly 2.5 the campaign pays for itself on the first sale and funds nothing else. The working target sits above it, and a higher target for repeat-purchase businesses can sit below it if lifetime value pays the difference.
ROAS, ROMI and incremental ROAS
ROAS counts attributed revenue. ROMI, return on marketing investment, is a profit measure, and incremental ROAS counts only revenue the ads caused. They answer different questions.
| Metric | Numerator | Denominator | What it tells you |
|---|---|---|---|
| ROAS | attributed revenue | ad spend | how much sales the platform credits to ads |
| ROMI | incremental margin minus marketing cost | marketing cost | return after the cost, in margin terms |
| Incremental ROAS | revenue caused by the ads, from a test | ad spend | return the ads really added |
ROMI has no single standard. David Stewart’s 2005 paper for the Advertising Research Foundation cites Powell’s definition, the revenue or margin a program generates divided by its cost, and argues it should be financial. Others subtract the spend first. Yandex’s explainer notes that ROMI covers marketing costs beyond ad budgets.
Incremental ROAS comes from an experiment. Google’s Conversion Lift reports it for geography-based studies by comparing exposed and unexposed groups. Our incrementality testing page covers how those tests run.
What platform ROAS does not tell you
Reported ROAS overstates what the ads caused whenever buyers would have bought anyway. Blake, Nosko and Tadelis switched off eBay search ads in field experiments and found brand-keyword ads had no measurable short-term benefit. Frequent buyers made up most of the spend, and average returns on non-brand keywords were negative.
The gap is not limited to search. Gordon and colleagues compared 15 Facebook experiments with observational methods and found the observational estimates often failed to match the randomized results. The reverse also happens: Lewis and Rao examined 25 field experiments and found the median confidence interval on return on investment was over 100 percentage points wide, so a single test can be too noisy to settle a decision.
For budget decisions across channels, a marketing mix model goes one step further. Google’s Meridian reports marginal ROI, the response to a 1% spend increase, which is the number that says whether the next ruble earns as much as the average one. Platform ROAS is an average, and averages hide saturation.
Setting a target in the ad platforms
Every major platform lets you bid to a ROAS or DRR target, and every one asks for volume first. Google’s Target ROAS needs at least 15 conversions in 30 days on Search and Shopping, and its help advises basing the target on historical ROAS. Microsoft’s strategy takes a 30-day average ROAS target. In Yandex Direct the target-DRR strategy suits sites with at least 10 conversions a week.
Since 17 August 2026 Google holds budget-limited Target ROAS campaigns closer to the set target instead of letting performance swing with budget. Yandex’s Maximum profit strategy skips the manual target and picks the cost level from the margin you enter. The bid mechanics, and how to feed CRM values into them, are on our value-based bidding page. A Growth Lab plan starts from the break-even line, so the target is set against margin before any bid is changed: see Growth Lab.
How to apply ROAS and DRR, step by step
- Fix the revenue definition. Decide which revenue goes into the ratio: orders or paid orders, before or after refunds, with or without tax. Use the same definition in every report. Result: one revenue figure that finance and marketing both accept.
- Compute ROAS and DRR from the same two numbers. Divide revenue by ad spend for ROAS. Divide ad spend by revenue and multiply by 100 for DRR. Result: both ratios for each campaign, so a Google report in percent and a Yandex Direct report in DRR can be compared.
- Turn margin into a break-even line. Take gross margin after variable costs and divide 1 by it. A 40% margin gives a break-even ROAS of 2.5, equal to a break-even DRR of 40%. Result: a floor below which a campaign loses money on the first sale.
- Set targets above the floor. Set the working target above break-even, using the last weeks of real results. Leave room for fixed costs and profit. Result: a target ROAS or target DRR that the bid strategy can reach without starving delivery.
- Check the number against an experiment. For the largest campaigns, run a holdout or geo test and compare incremental revenue with the platform figure. Result: a correction factor between reported ROAS and the return the ads actually cause.
Examples
An online shop with a 40% margin
Illustrative. A shop earns a 40% gross margin after goods, delivery and payment fees. Break-even ROAS is 1 / 0.40 = 2.5, so every $1 of ads must bring $2.50 of sales. A campaign at ROAS 3 clears the floor: each $100 of ads brings $300 of sales and $120 of margin, $20 above the ad cost. A campaign at ROAS 2 brings $80 of margin for $100 of ads and loses $20.
A dental clinic reading a DRR report
Illustrative. A clinic spends 100 rubles on search ads for every 500 rubles of paid treatment those leads bring: a DRR of 20% and a ROAS of 5. If treatment leaves a 35% margin after consumables and doctor pay, ads take 20 points of it and 15 points remain. A DRR of 40% would lose money on each first visit unless repeat visits pay it back.
A payments provider counting leads, not orders
Illustrative. A provider cannot see revenue at the click, only signed accounts weeks later. It imports signed accounts with their projected first-year margin back into the ad platform as conversion value, then reads ROAS on that margin value. The ratio now means margin per unit of spend, so break-even is 1.0 instead of 1 divided by a margin percentage.
When to use it
Use it whenever paid channels generate orders with a known revenue value and a known margin, and you need one number to compare campaigns, channels or marketplaces. It is the standard input for Target ROAS bidding and for target-DRR strategies in Yandex Direct.
When not to use it
Skip it as the only measure for brand and awareness spend, long sales cycles where revenue arrives months after the click, and channels where most conversions would have happened anyway. There an incrementality test or a marketing mix model answers the question better.
Common mistakes
- Treating platform ROAS as profit. It is attributed revenue over spend. It ignores margin, returns and sales that would have happened without the ad.
- Setting the target from the board's wish instead of recent results. Google notes that a higher target tends to raise conversion value and lower volume, so an unrealistic target starves delivery.
- Using net or blended margin for break-even. Use gross margin after variable costs, and leave fixed overhead out, or the floor is set too high.
- Comparing ROAS across channels with different attribution windows or revenue definitions, then moving budget on the gap.
- Judging a campaign on days that still wait for delayed conversions. Google advises excluding the recent conversion delay period when evaluating ROAS.
FAQ
What is the difference between ROAS and DRR?
They are inverse ratios of the same numbers. ROAS is revenue divided by ad spend, usually written as a multiple or a percentage. DRR is ad spend divided by revenue, times 100. A ROAS of 4 is a DRR of 25%. Higher ROAS is better, and lower DRR is better.
How do you calculate break-even ROAS?
Divide 1 by gross margin written as a decimal. A 40% margin gives 1 / 0.40 = 2.5, so each $1 of ads needs $2.50 of sales to avoid a loss. Amazon Ads publishes the same formula. Use margin after variable costs, not net profit.
How do you calculate DRR?
DRR equals ad spend divided by revenue from advertising, multiplied by 100. Spending 10 rubles to earn 50 gives 20%. Yandex Direct states the same formula and also shows DRR by conversion value in its statistics, so check which revenue your report uses.
What is a good ROAS?
There is no universal figure. A ROAS is good when it clears your break-even ROAS, which depends on margin: 2.5 at a 40% margin, 5 at 20%. Amazon Ads says the same, that a good ROAS is one that is profitable for the business.
What is the difference between ROAS and ROMI?
ROAS divides revenue by ad spend. ROMI usually subtracts the spend and works on margin: incremental margin minus marketing cost, divided by marketing cost. Sources define ROMI differently, so write down the formula you use. ROMI can be negative, while ROAS is never below zero.
Sources
- Google Ads Help, About Target ROAS bidding
- Google Ads Help, About Maximize conversion value bidding
- Google Ads Help, Changes to target based bid strategies (August 2026)
- Google Ads Help, About Smart Bidding
- Google Ads Help, About conversion value rules
- Google Ads Help, About data-driven attribution
- Google Ads Help, About Conversion Lift
- Google Meridian, ROI priors and calibration
- Google Meridian, ROI, mROI, and Contribution parameterizations
- Meta Marketing API, Bid strategy
- Meta Marketing Science, Robyn features: calibration with experiments
- Microsoft Advertising API, TargetRoasBiddingScheme
- Amazon Ads, Ads math guide
- Яндекс Директ, справка: Доход и ценность конверсий
- Яндекс Директ, справка: Максимум прибыли
- Яндекс Директ, справка: у кампании мало конверсий
- Яндекс Реклама, ДРР: что это такое и как работать с метрикой
- Яндекс Реклама, Оптимизация конверсий, кликов и целевая доля рекламных расходов
- Randall A. Lewis, Justin M. Rao, The Unfavorable Economics of Measuring the Returns to Advertising, Quarterly Journal of Economics 130(4), 2015
- Brett R. Gordon, Florian Zettelmeyer, Neha Bhargava, Dan Chapsky, A Comparison of Approaches to Advertising Measurement: Evidence from Big Field Experiments at Facebook, Marketing Science 38(2), 2019
- Thomas Blake, Chris Nosko, Steven Tadelis, Consumer Heterogeneity and Paid Search Effectiveness: A Large-Scale Field Experiment, Econometrica 83(1), 2015
- Garrett A. Johnson, Randall A. Lewis, Elmar I. Nubbemeyer, Ghost Ads: Improving the Economics of Measuring Online Ad Effectiveness, Journal of Marketing Research 54(6), 2017
- David W. Stewart, Measurement-based Accountability and Standards, ARF Annual Convention paper, 2005 (hosted by MASB)
Last updated Oct 9, 2026


How to calculate channel payback and unit economics
A CAC number that only marketing believes will not survive a finance review. This guide calculates channel payback so both teams work from the same model.

Fractional CFO vs finance operations: which gap do you actually have
A fractional CFO is a person. Finance operations is a system. Companies searching for one are often missing the other, or both.