Net revenue retention (NRR)
Net revenue retention measures how much recurring revenue a group of existing customers pays today compared with a year ago, after counting expansion, contraction and churn, and ignoring every new customer.
Net revenue retention (NRR) is the share of recurring revenue that a fixed group of customers still pays after a period, usually 12 months, including their upgrades, downgrades and cancellations but excluding new customers. Above 100%, the existing base grows by itself. Below 100%, it shrinks, and new sales must refill it.
- Origin
- SaaS industry practice; no single originator, SaaS practice, reported by public companies
- Level
- 301 · Advanced
- Fits
- Scale-up
- Time to apply
- An afternoon for the first calculation; then one reading per month
- What you need
- a billing table with customer ID, month and recurring revenue for at least 13 months · one written rule for what counts as recurring (usage fees, services, one-off charges) · one agreed definition of a customer, such as the paying account or the parent company
Net revenue retention (NRR) is the percentage of recurring revenue that a fixed group of customers still pays after a period, counting their upgrades, downgrades and cancellations and leaving out everyone who joined later. Take the customers you had twelve months ago, add up what they paid then and what they pay now, and divide. No single person invented it. It grew out of subscription software practice, where Stripe gives the same formula as ChartMogul and others, and public companies now report it in their annual filings under several names.
How is net revenue retention calculated?
NRR is the ending revenue of the starting customers divided by their starting revenue. ChartMogul writes it as starting MRR plus expansion and reactivation, minus contraction and churn, divided by starting MRR, and excludes new business.
NRR = (start + expansion - contraction - churn) / start
GRR = (start - contraction - churn) / start
Gross revenue retention (GRR) is the same calculation without expansion, so it cannot pass 100%. SaaS Capital’s formula takes December 2024 MRR from customers who were also customers in December 2023 and divides it by total MRR in December 2023.
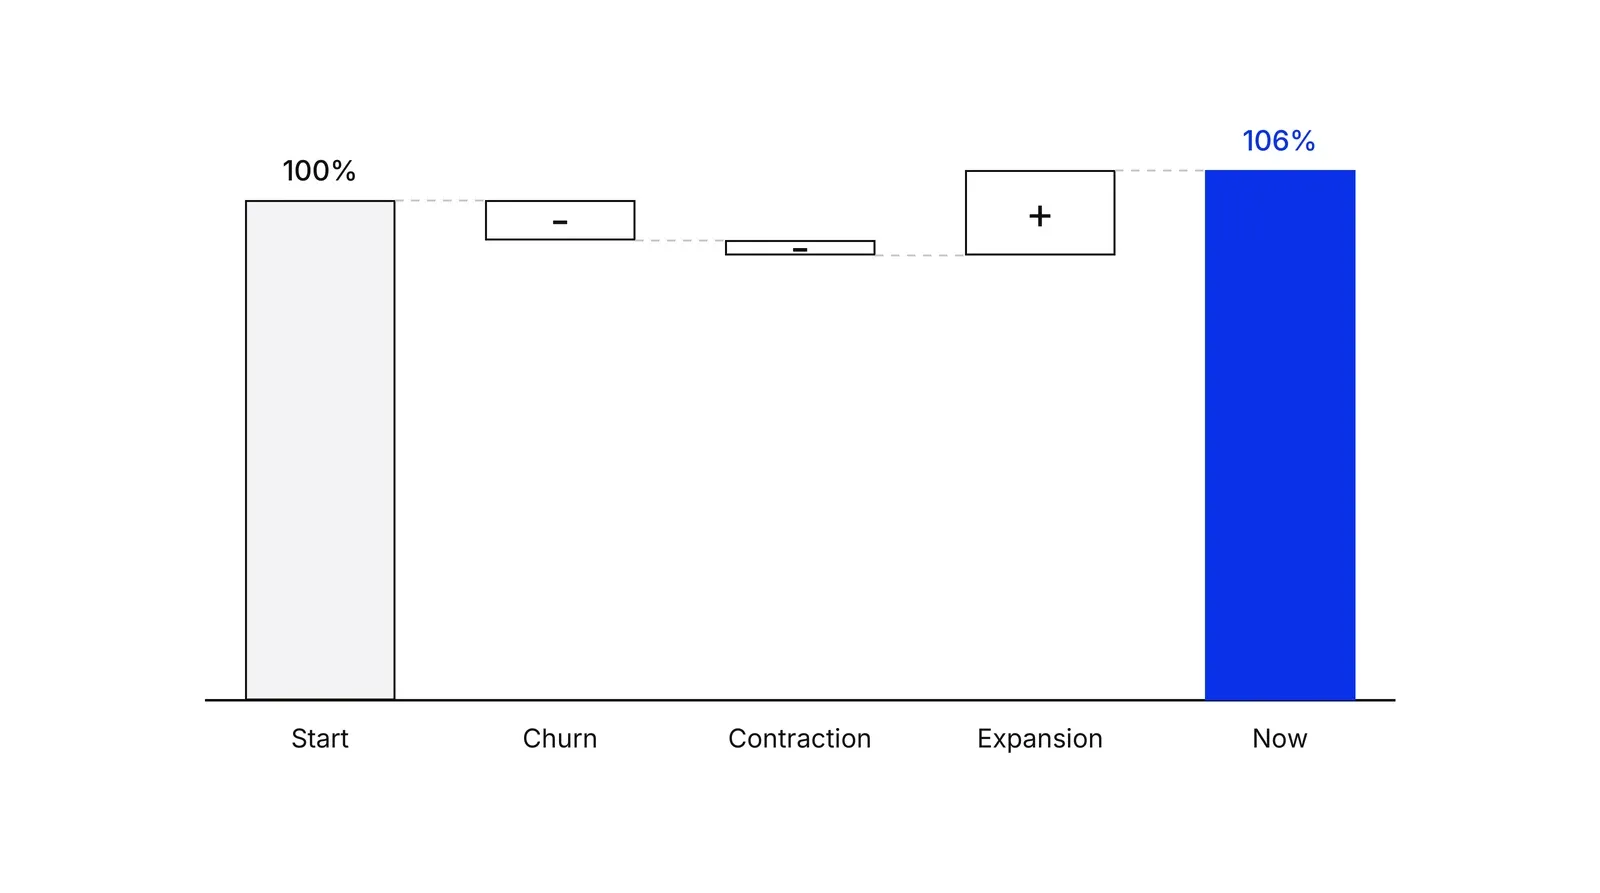
Worked example: same NRR, different business
Take two clinic-scheduling vendors (illustrative numbers). Each had the same monthly recurring revenue from its existing customers twelve months ago, shown in the table.
| Movement | Vendor A | Vendor B |
|---|---|---|
| Starting MRR | $500,000 | $500,000 |
| Churned | -$40,000 | -$10,000 |
| Contraction | -$15,000 | -$5,000 |
| Expansion | +$85,000 | +$45,000 |
| Ending MRR, same customers | $530,000 | $530,000 |
| NRR | 106% | 106% |
| GRR | 89% | 97% |
Both report 106%. Vendor A loses much more before any upsell and needs heavy expansion to cover it. Vendor B loses little and expands modestly. A downturn that freezes upgrades hurts A far more, which is why GRR belongs beside NRR. New customers do not appear in the table: signing more would raise total revenue and leave NRR where it is.
Why does NRR matter so much?
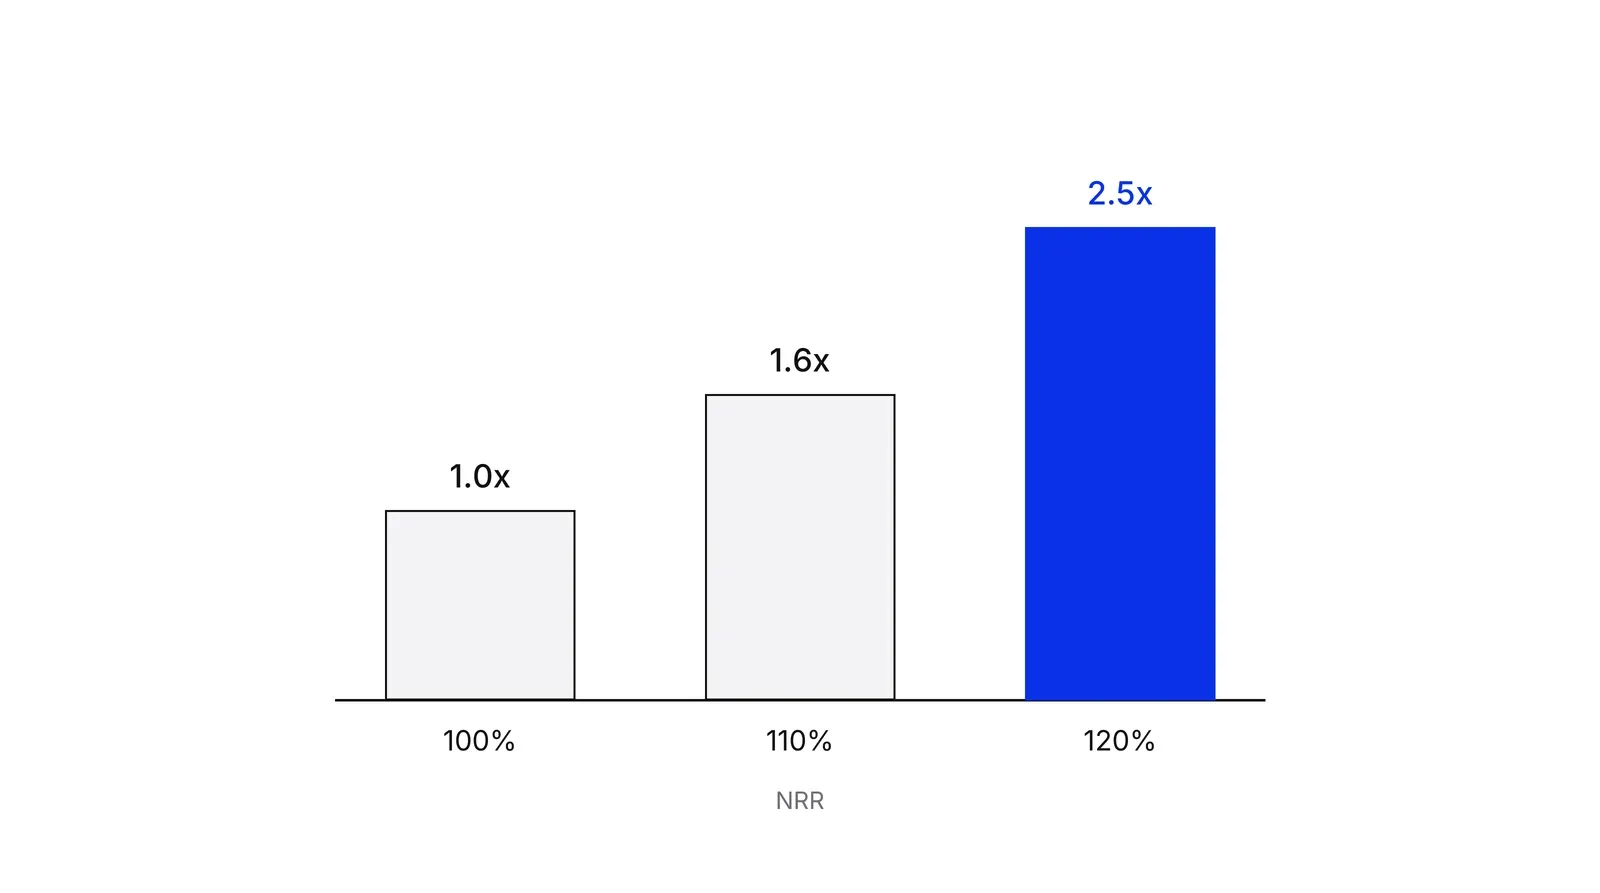
NRR compounds. If existing customers’ revenue grows 20% a year and nothing else happens, it multiplies by 1.2 each year, about 2.5 times in five years. Tomasz Tunguz uses the same logic to show how a gap of 20 points of NDR becomes a gap of several times in company size.
David Skok calls negative churn, where expansion outweighs losses, “the ultimate solution to the churn problem”. In his cohort example, 3% negative churn reaches $450k while 3% churn reaches $140k. Gupta, Lehmann and Stuart reach a related result in the Journal of Marketing Research: improving retention by 1% improves customer and firm value by 3% to 7%.
Retention has long been tied to value. Reichheld and Sasser argued in 1990, in a summary on Bain’s site, that retaining 5% more customers can lift a service company’s profits by almost 100%. The survey data agree on direction. In SaaS Capital’s 2025 brief, based on more than 1,000 private B2B SaaS companies, median growth rose with NRR from 15% (below 90%) to 21% (100% to 110%), 30% (110% to 120%) and 50% (above 130%). That is correlation. Fast-growing companies may also find expansion easier.
Why is every company’s NRR different?
Because NRR is not a standard accounting measure. The SEC’s 2020 guidance on metrics expects a clear definition of the metric and how it is calculated, plus disclosure if the method changes. The filings show how far the definitions drift.
| Company | Name | Calculation | Reported |
|---|---|---|---|
| Snowflake | Net revenue retention rate | Product revenue from the cohort in year two of a two-year window, divided by year one | 126% at Jan 31, 2025; 131% at Jan 31, 2024 |
| Datadog | Trailing 12-month dollar-based net retention rate | ARR from customers present 12 months earlier, weighted average of trailing 12 months | high-110%s at Dec 31, 2024; about 120% at Dec 31, 2025 |
| Twilio | Dollar-based net expansion rate | Quarterly revenue of the cohort versus the same quarter last year, averaged | 121% in 2022; 103% in 2023; 104% in 2024 |
| MongoDB | Net ARR expansion rate | ARR now from last year’s customers, divided by last year’s ARR from all customers | about 118% at Jan 31, 2025 |
Datadog’s 2025 10-K gives the later figure. Snowflake says it expects its rate to fall as long-term customers make up more of the base. Match the definition before comparing your NRR with any of these firms.
What do private companies actually report?
Lower numbers than the public leaders. SaaS Capital’s 2025 survey found a median NRR of 101% and median GRR of 91% across respondents. Its charts exclude companies under $1M in ARR. Retention rises with annual contract value, and at least a quarter of companies in every band below $250,000 had NRR under 100%. Companies with contracts above $250,000 had a median GRR of 95% (SaaS Capital). SaaS Capital’s web summary gives one band: contracts of $25,000 to $50,000 had a median NRR of 102%, with quartiles of 97% and 111%, and it advises benchmarking against companies with similar selling prices. The 2023 survey, with more than 1,500 respondents, reported a median NRR of 102% and GRR of 91%, so the typical private company has barely moved.
ChartMogul’s 2023 report used more than 2,100 SaaS businesses, with data mostly from 2022. Top-quartile NRR was 94% for companies with $1M to $3M ARR, 99% for $3M to $15M and over 105% for $15M to $30M (report). The datasets cover different populations, so read them as ranges, not targets.
What does NRR not tell you?
NRR does not say where the growth comes from. Large accounts can carry the average while small ones leave. Skok shows customer churn of 10% next to revenue churn of about 3.4%, because the lost customers were small. Growth accounting splits the whole base’s movement into new, retained and lost revenue, and in Hsu’s Amplitude post expansion and contraction only enter the revenue version. Cohort analysis shows whether recent signups behave like old ones, and Tribe Capital notes that negative net churn is a positive signal in any business.
The levers sit with different teams. Churn and contraction belong largely to customer success. Expansion depends on pricing, packaging and the lifecycle messages that prompt an upgrade. A Growth Lab plan starts from whichever of churn, contraction and expansion is largest in your own table.
How to apply Net revenue retention (NRR), step by step
- Fix the definition in writing. Decide the unit (MRR, ARR or recognized revenue), the window (12 months is standard), whether reactivated customers count, and whether usage fees count. Public companies differ on all four. Result: one paragraph that every report repeats.
- Freeze the starting cohort. List every customer with revenue in the starting month and sum their recurring revenue. Add nobody who arrives later. Result: a starting figure and a customer list that never changes during the calculation.
- Measure the same customers one window later. Sum what exactly those customers pay now. Customers who left count as zero, and they stay in the denominator. Result: an ending figure from the same list.
- Divide, then split the movement. NRR is ending revenue divided by starting revenue. Then break the change into churn, contraction and expansion, each as a percentage of the starting figure. Result: one headline rate and three movements that explain it.
- Compute gross revenue retention beside it. Run the same cohort but cap each customer at their starting revenue, so expansion cannot offset losses. Result: a second rate that cannot exceed 100% and shows how leaky the base is.
- Cut it by segment and by cohort. Repeat the calculation by contract size, plan or signup month. Result: a view of which segment expands, which leaks, and whether recent cohorts behave like older ones.
Examples
Snowflake: a usage-based company on a two-year window
Snowflake reports net revenue retention of 126% as of January 31, 2025 and 131% a year earlier. Its 10-K defines the cohort as customers using the platform in the first month of a two-year window and divides their product revenue in year two by year one. The company says it expects the rate to fall as long-time customers become a larger share of revenue.
Twilio: one company, three different years
Twilio's annual report shows a dollar-based net expansion rate of 121% for 2022, 103% for 2023 and 104% for 2024. It compares each quarter with the same quarter a year earlier and averages the quarters. The swing shows that for a usage-based product, NRR follows customers' own volumes and not only the vendor's account work.
Two vendors with the same 106%
Illustrative. Two clinic-scheduling vendors start the year with the same recurring revenue and both end it 6% higher from the same customers. Vendor A lost far more to churn and contraction and won it back with upsells. Vendor B lost little and expanded less. Same NRR, very different risk.
When to use it
Use it once a business has recurring revenue, at least a year of billing history and enough customers (a few dozen is a workable floor) that one account does not decide the rate. It is the first retention number an investor or board will ask for.
When not to use it
Skip it for one-off sales with no expected repeat, and for the first months of a product with fewer than a dozen customers, where one cancellation moves the rate by many points. In a business with large one-time contracts, read cohort curves and gross retention instead.
Common mistakes
- Comparing your NRR with a public company's without checking the definition. Snowflake uses a two-year window and product revenue, Datadog uses ARR with a weighted average, Twilio averages quarterly rates.
- Reporting NRR alone. A rate above 100% can hide large annual losses, so show gross revenue retention next to it.
- Letting new customers into the numerator, for example by counting revenue from sub-accounts opened after the start date as expansion.
- Reading one company-wide rate when two segments behave differently. A strong enterprise tier can mask a leaking small-business tier.
- Treating 100% as a target for every product. SaaS Capital's 2025 survey shows typical NRR varies with contract value.
FAQ
What is a good net revenue retention rate?
It depends on contract size. SaaS Capital's 2025 survey of private B2B SaaS companies found a median NRR of 101% and gross retention of 91%. Companies with NRR of 110% or more grew faster than the 24% sample median. Public infrastructure vendors report higher figures, as the table above shows.
What is the difference between NRR and gross revenue retention?
Gross revenue retention counts only losses: churn and contraction. It cannot exceed 100%. Net revenue retention adds expansion on top, so it can exceed 100%. The first measures how leaky the base is; the second measures whether expansion more than covers the leaks.
Can net revenue retention be over 100%?
Yes. When existing customers expand by more than the revenue lost to churn and contraction, NRR passes 100% and the base grows without new sales. Datadog reported about 120% at the end of 2025, and MongoDB reported about 118% at January 31, 2025.
Is NRR the same as net dollar retention?
The names refer to the same idea: revenue from the same customers now divided by their revenue a year ago. Companies label it differently. Datadog says dollar-based net retention, Twilio says dollar-based net expansion rate, MongoDB says net ARR expansion rate. Each defines its own calculation.
How is NRR different from customer retention?
Customer retention counts heads: how many customers are still there. NRR counts money. A company can keep most of its customers and still lose revenue if the leavers were its biggest accounts, or gain revenue if the stayers upgraded. Skok's own example shows 10% customer churn alongside 3.4% revenue churn.
Sources
- Snowflake Inc., Form 10-K for fiscal year ended January 31, 2025 (SEC)
- Snowflake Inc., Fourth quarter and full-year fiscal 2025 results, February 26, 2025 (SEC Exhibit 99.1)
- Datadog, Inc., Form 10-K for fiscal year ended December 31, 2024 (SEC)
- Datadog, Inc., Form 10-K for fiscal year ended December 31, 2025 (SEC)
- Twilio Inc., Form 10-K for fiscal year ended December 31, 2024 (SEC)
- MongoDB, Inc., Form 10-K for fiscal year ended January 31, 2025 (SEC)
- U.S. Securities and Exchange Commission, Commission Guidance on MD&A: Key Performance Indicators and Metrics, Release 33-10751, 2020
- SaaS Capital, Research Brief 32: 2025 B2B SaaS Retention Benchmarks
- SaaS Capital, 2025 SaaS Retention Benchmarks for Private B2B Companies
- SaaS Capital, What is a good retention rate for a private SaaS company?
- ChartMogul, SaaS Retention Report, 2023
- ChartMogul Help Center, Chart: Net MRR Retention
- David Skok, SaaS Metrics 2.0, For Entrepreneurs
- Sunil Gupta, Donald Lehmann and Jennifer Ames Stuart, Valuing Customers, Journal of Marketing Research, 2004
- Tomasz Tunguz, How much is 20% more NDR worth to your SaaS startup?
- SaaS Capital, Research Brief 28: 2023 B2B SaaS Retention Benchmarks
- Stripe, Net revenue retention: what it is and why it matters for SaaS businesses
- Bain & Company, Zero defections: quality comes to services (Harvard Business Review)
- Tribe Capital, A quantitative approach to product market fit, 2019
- Jonathan Hsu, How to analyze the health of your app's product-market fit through growth accounting, Amplitude
Last updated Oct 9, 2026


Marketing agency or growth system: when a company outgrows its agency
An agency is the right call while the founder still runs most of the company. Once the business starts copying itself into new locations or markets, it needs a system that sets goals, tests hypotheses and owns the result.

Why healthcare marketing agencies stall: the short, mid and long wins model we use with clinics
Most agencies own the click and nobody owns the front desk. How we structure clinic work in three horizons, the research behind each one, and one year of results.

Why channel tests stall after month three
Most paid channel tests do not end with a decision. They end when the budget runs out, the attribution model changes, or everyone quietly stops looking at the dashboard.