KPI vs OKR
KPIs track the health of work that keeps running, OKRs set the few changes a team will push for this quarter, and a KPI that needs to move sharply can be promoted into a key result.
KPIs and OKRs do different jobs. A KPI is a number tracked continuously to show whether ongoing work is healthy. An OKR is an objective with a few measurable key results, usually set for a quarter, to change something. A KPI can become a key result when it needs to move sharply, then return to the dashboard once it holds.
- Origin
- Peter Drucker (management by objectives); Andy Grove at Intel (OKRs); John Doerr (OKRs at Google); Kaplan and Norton (the scorecard that spread performance measures), 1954; 1992; 1999
- Level
- 201 · Tool
- Fits
- Small and mid-size, Scale-up, Enterprise
- Time to apply
- 60 minutes to sort an existing dashboard, then one quarter to run the first cycle
- What you need
- the list of numbers your team reports today · one person who can say which of them must change this quarter · a baseline and a date for each number you want to move
A KPI is a number you track continuously to see whether ongoing work is healthy. An OKR is a short list of goals for a fixed period, usually a quarter, each made of an objective and a few measurable key results, and it exists to change something. WhatMatters.com, the site built around John Doerr’s book Measure What Matters, puts the split in one line: OKRs are “measures for change, whereas KPIs are measures of health”. Doerr presented the method at TED2018 as a way to set ambitious goals and track how they are carried out. Most confusion between the two comes from using one tool for the other’s job.
KPI vs OKR at a glance
The quickest test is a question: do you want this number to stay where it is, or to move? Stay means KPI. Move means key result.
| KPI | OKR | |
|---|---|---|
| Job | Show how a process or team is doing right now | Name what must change and by how much |
| Time frame | Continuous | A set period, typically a quarter |
| Fits | Business as usual | Not business as usual |
| Target | Often a range or a floor that triggers a conversation | A key result is met or missed at the end of the cycle |
| Size | A standing set of metrics | Usually 3 to 5 key results per objective |
| Scoring | Inside the range or outside | Graded; Google treats 0.6 to 0.7 as the sweet spot for ambitious goals |
The cycle, the key-result count and the “met or missed” test come from WhatMatters.com, which also says routine work such as payroll needs steady execution, not an OKR. Google’s re:Work guide sets out the grading scale.
Where each one comes from
OKRs have a documented line of descent. Peter Drucker introduced management by objectives in his 1954 book The Practice of Management, as Robert Kaplan notes in a Harvard Business School working paper. Andy Grove adapted it at Intel, first calling it iMBO. Doerr, who learned it from Grove, presented it to Google’s founders in 1999, according to WhatMatters.com. David Wilsey of the Balanced Scorecard Institute argues that this makes OKRs a refined MBO and not a new invention, and the sources do not settle the point.
KPIs have no single author and, strictly, no agreed definition. Kaplan and Norton’s 1992 Harvard Business Review article argued that what a company measures shapes what managers do, and its scorecard added customer, internal process and learning measures to the financial ones. The scorecard was meant to complement financial measures, not replace them, as the authors say in their 1996 follow-up. The label “KPI” spread from there. Ittner and Larcker later reported in HBR that companies track nonfinancial measures to see progress before financial results show it. David Parmenter, author of the Wiley handbook Key Performance Indicators, wrote in a 2013 article for ICAEW that organizations had been using the term for every measure without anyone defining it.
Parmenter’s own definition is strict. He splits measures into four types: key result indicators, result indicators, performance indicators and KPIs. By his rule a KPI is non-financial, measured daily or weekly, owned by a team and acted on by the chief executive, so net profit and monthly revenue are not KPIs (his IBM paper lists seven tests). Most business teams use the word more loosely. We use it loosely here too, and note where the stricter reading changes the advice.
How a KPI becomes a key result
A KPI becomes a key result when you decide it must change by a meaningful amount within one cycle. WhatMatters.com says KPIs and OKRs complement each other: a KPI you want to change significantly can be elevated into an OKR, and once it stabilizes it can go back to being monitored. Its own example is customer-service response time, which slipped while complaints rose, and so moved into a key result.
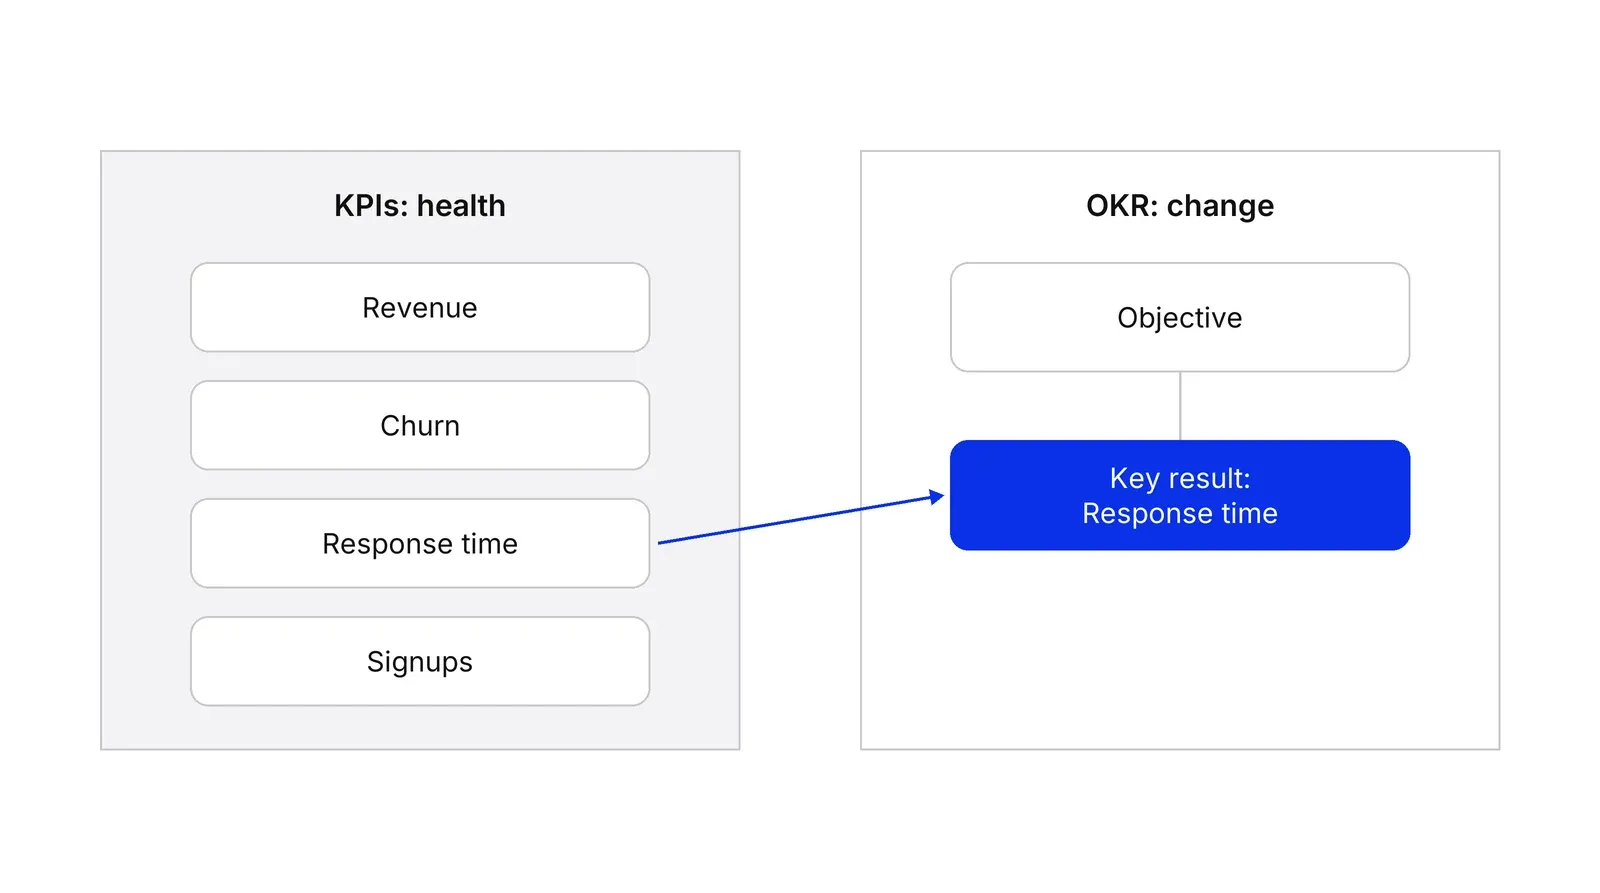
What turns the metric into a key result is three additions: a baseline, a target and a date. “Response time” is a KPI. “Cut median first reply from 8 hours to 4 hours by the end of the quarter” is a key result, and it sits under an objective that says why: patients get an answer the same day. The objective should describe a result, not an action. A task such as “implement a new help desk” does not belong there, and WhatMatters.com suggests asking what would get better if it were achieved.
A strict KPI reading adds a caution. If a key result is a monthly figure, you will learn whether it moved only after the month is over. Pick a measure that the team can see weekly, so the cycle has room for corrections.
Hold or move: why the scoring differs
A KPI is judged by whether it stays inside its range. A key result is judged by how far it travelled toward a target.
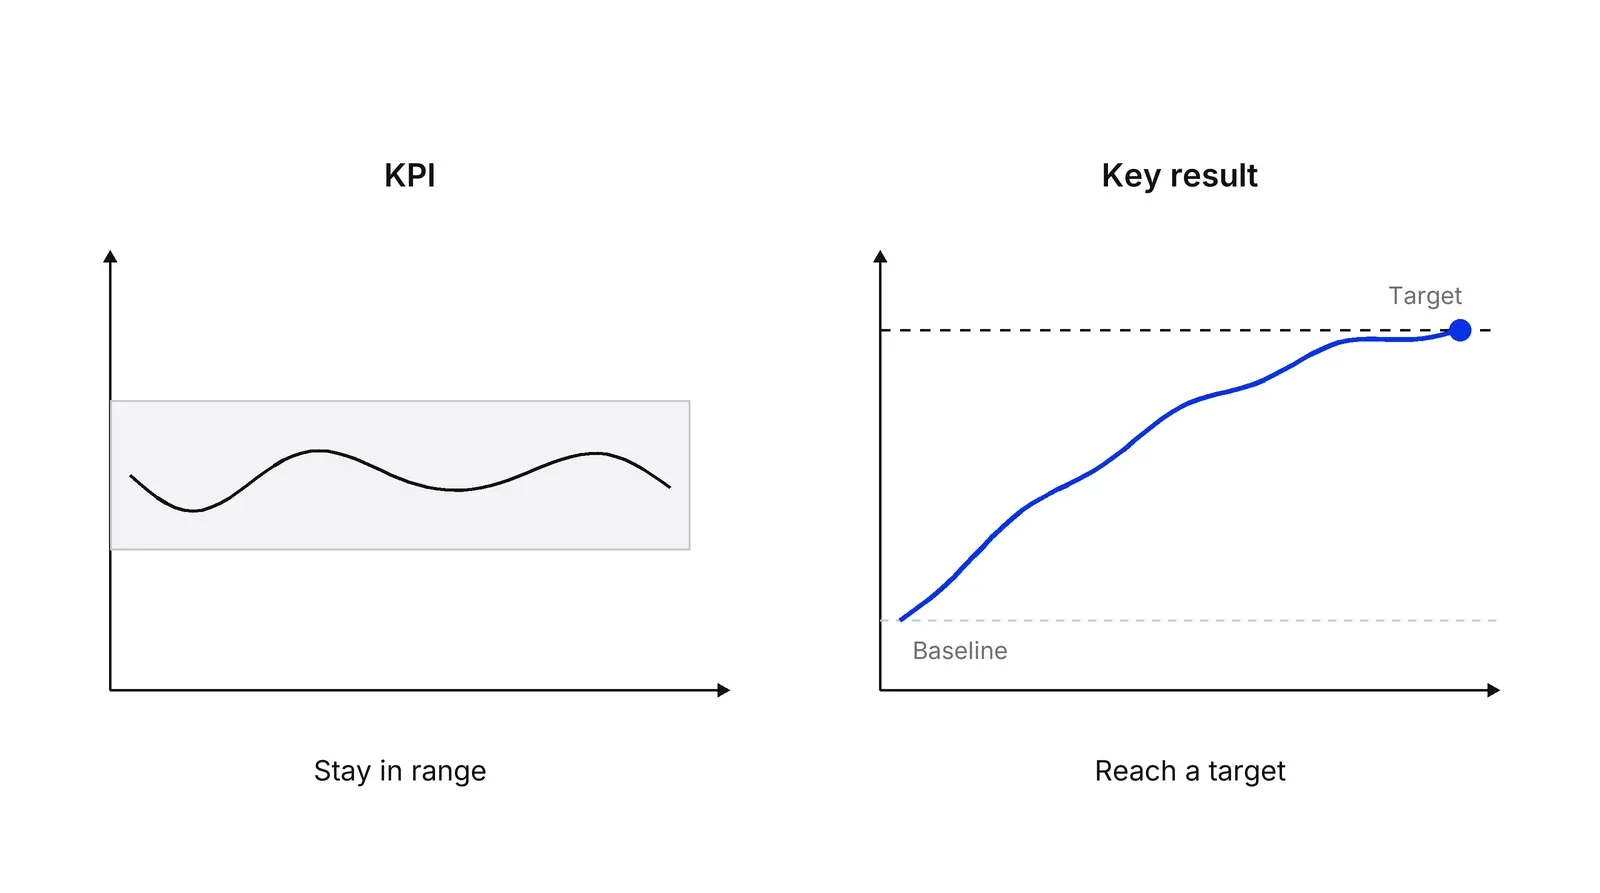
This is why key results carry numbers and stretch. Locke and Latham’s review of about 35 years of goal-setting research found that specific, difficult goals consistently led to higher performance than urging people to do their best (American Psychologist, 2002). Google grades each key result from 0.0 to 1.0, and its guide says consistently hitting every objective suggests the goals were not ambitious enough. WhatMatters.com separates committed OKRs, which should reach 1.0, from aspirational ones, where 0.7 to 1.0 counts as green. It also warns that a run of 100% scores points to sandbagging. A KPI that always “scores” full marks is fine. It is working as a dashboard light.
How they fit with the rest of the toolkit
A KPI tree shows which metrics drive the top number, so it is the natural place to find the one worth promoting. A north star metric is usually the KPI the whole company watches, and key results often push on its inputs. Whether a measure leads or lags decides how early it warns you, as leading and lagging indicators explains. Kaplan and Norton’s scorecard already combined both ideas, and their strategy map later drew the route between the objectives: each perspective in its original design carries objectives, measures, targets and initiatives, as Kaplan describes in the working paper above. The balanced scorecard and strategy maps page covers that system.
Where both go wrong
Both tools turn into targets, and targets get gamed. Parmenter warned in the 2013 article that every measure has a dark side, and that tying KPIs to pay turns them into political indicators that people manipulate for a larger bonus. Goodhart’s law describes the general case, and its popular wording comes from Marilyn Strathern’s 1997 paper on audit in British universities. Michael Harris and Bill Tayler describe a related trap in Harvard Business Review: people replace the strategy in their heads with the metric that stands for it.
Goals themselves carry risk. Ordóñez, Schweitzer, Galinsky and Bazerman argued in a working paper in 2009 that the benefits of goal setting are overstated and listed side effects: narrow focus, unethical behavior, distorted risk preferences, damage to culture and reduced intrinsic motivation. Locke and Latham’s review reaches a more favorable verdict, so the research does not agree on the net effect. The practical response is shared: keep the list short, and keep scoring away from pay. Google’s guide says OKRs are not synonymous with performance evaluation.
A Growth Lab plan starts from the KPI tree and picks the one or two numbers worth promoting to key results.
How to apply KPI vs OKR, step by step
- List every number you already track. Write down each metric on the current dashboard or weekly report, with its current value. Do not add new ones yet. Result: one page with all the KPIs the team already watches.
- Mark what should hold steady. For each metric, ask whether you want it to stay where it is. Revenue per active customer, refund rate and uptime usually fit. Give each a range or a floor that triggers a conversation. Result: a short set of KPIs with alarm levels.
- Pick the one or two that must change. Choose the metrics where staying put is no longer acceptable: response time that slipped, a conversion rate far below plan. Each becomes the seed of an objective written as a result, such as getting patients an answer the same day. Result: one or two objectives that name an outcome, not a task.
- Write key results with a baseline, a target and a date. Turn each chosen KPI into a key result: from 8 hours to 4 hours by the end of the quarter. Add two or three more if the objective needs them. Result: key results that are plainly met or missed on the last day.
- Grade at the end of the cycle and sort the numbers. Score each key result, then decide where it goes. A metric that now holds returns to the dashboard as a KPI with a range. One that still lags can stay as a key result for another cycle. Result: a dashboard and an OKR list that both match what you want to do next.
Examples
A private clinic with slow replies
Illustrative. The dashboard shows median time to first reply to an online enquiry at 8 hours, and complaints about slow answers are rising. That number moves from KPI to key result under the objective 'Patients get an answer the same day': cut median first reply from 8 hours to 4 hours by the end of the quarter. Booking volume, no-show rate and refund rate stay on the dashboard as KPIs. If the reply time holds at 4 hours for a full quarter, it goes back to the dashboard with a ceiling.
A payments operations team
Illustrative. Share of payouts settled the same day is a KPI, steady at 92%, with an alarm at 90%. Leadership wants a faster product for merchants, so next quarter it becomes a key result: raise same-day settlement from 92% to 97%. A second key result covers support tickets about late payouts. Fraud-review backlog stays a plain KPI with a ceiling, because nobody wants it to change in this cycle, only to stay under control.
A SaaS product team after a signup spike
Illustrative. Weekly activated accounts is the team's north star number, and it is healthy. Day-7 retention is the weak spot, sitting at 18%. The quarter's objective is 'New users come back in their first week', with one key result: lift day-7 retention from 18% to 24%. Activation keeps its place on the dashboard, so a gain in retention is not paid for with a drop in activation.
When to use it
Use the split when a team has a long dashboard and a list of goals that look the same, or when every quarter's goals are the same numbers with a bigger target. It helps in a company with enough moving parts that leaders must choose which few things get attention now.
When not to use it
Skip the quarterly OKR layer for a team of a few people who already agree on the one thing that matters this month. A weekly priority list is enough. Skip a KPI dashboard for work that is a one-off project with a fixed end date; track milestones instead.
Common mistakes
- Putting every KPI into the OKR list. Routine work such as payroll needs steady execution and a KPI, not an objective.
- Writing key results as tasks, such as 'launch a new landing page'. A key result is a measurable outcome with a baseline and a target; the launch is one possible way to reach it.
- Scoring 100% every quarter. A key result that always lands at full marks was either set too low or was a KPI in disguise.
- Tying KPIs or key results straight to bonuses. People then choose safe targets, protect the number and stop reporting bad news.
- Calling a monthly financial figure a KPI and stopping there. Net profit tells you how the year went, not what to do on Tuesday; add the measures that people can act on daily or weekly.
FAQ
What is the difference between KPI and OKR?
A KPI is a standing measure of how part of the business is doing, watched continuously. An OKR is a set of goals for a fixed period, usually a quarter: an objective plus a few key results that are met or missed. KPIs monitor health; OKRs push for change, and they work as a pair.
Can a KPI be a key result?
Yes. WhatMatters.com, the site built around John Doerr's book, says a KPI you want to change significantly can be elevated into a key result, and that it can go back to being a monitored KPI once it stabilizes. Add a baseline, a target and a date, and make sure it serves an objective.
Are OKRs just KPIs with a different name?
No, though some writers say the two are over-sold as opposites. The Balanced Scorecard Institute argues OKRs descend from management by objectives and that many KPI-versus-OKR comparisons reflect what the author sells. The practical split holds either way: some numbers you keep steady, others you set out to move.
Should you use both KPIs and OKRs?
Most teams that run OKRs keep a KPI dashboard too. The dashboard shows what is drifting; the OKR list picks the few things the team will change now. OKRs do not replace KPIs. They help change and improve them, which is why one set feeds the other each quarter.
Should OKRs be linked to bonuses?
Google's public OKR guide says OKRs are not synonymous with performance evaluation and treats a grade of 0.6 to 0.7 as the sweet spot. If a missed key result costs someone pay, they have reason to choose easy ones. Keeping scoring separate from compensation reduces that pressure.
Sources
- WhatMatters.com, What is an OKR? Definition and examples
- WhatMatters.com, OKRs vs KPIs
- WhatMatters.com, Dear Andy: Converting operations KPIs to OKRs
- WhatMatters.com, The difference between KPIs and OKRs
- WhatMatters.com, Grading OKRs
- WhatMatters.com, OKRs history: Andy Grove and Intel
- John Doerr, Measure What Matters, Portfolio, 2018 (publisher page)
- John Doerr, Why the secret to success is setting the right goals, TED2018
- Google re:Work, Set goals with OKRs
- David Wilsey, No, Andy Grove Didn't Invent OKRs, Balanced Scorecard Institute
- Robert S. Kaplan, David P. Norton, The Balanced Scorecard: Measures That Drive Performance, Harvard Business Review, January-February 1992
- Robert S. Kaplan, David P. Norton, Using the Balanced Scorecard as a Strategic Management System, Harvard Business Review, 1996 (reprint 2007)
- Robert S. Kaplan, Conceptual Foundations of the Balanced Scorecard, Harvard Business School Working Paper 10-074, 2010
- Robert S. Kaplan, David P. Norton, Having Trouble with Your Strategy? Then Map It, Harvard Business Review, September-October 2000
- Wiley, David Parmenter, Key Performance Indicators: Developing, Implementing, and Using Winning KPIs, 4th edition, 2019
- David Parmenter, Abolishing the myths, Finance & Management (ICAEW), July-August 2013
- David Parmenter, The New Thinking on KPIs, IBM Software, 2015
- Christopher D. Ittner, David F. Larcker, Coming Up Short on Nonfinancial Performance Measurement, Harvard Business Review, November 2003
- Edwin A. Locke, Gary P. Latham, Building a Practically Useful Theory of Goal Setting and Task Motivation, American Psychologist 57(9), 2002
- Lisa D. Ordóñez, Maurice E. Schweitzer, Adam D. Galinsky, Max H. Bazerman, Goals Gone Wild, Harvard Business School Working Paper 09-083, 2009
- Michael Harris, Bill Tayler, Don't Let Metrics Undermine Your Business, Harvard Business Review, September-October 2019
- Marilyn Strathern, 'Improving ratings': audit in the British University system, European Review 5(3), 1997
Last updated Oct 9, 2026


Marketing agency or growth system: when a company outgrows its agency
An agency is the right call while the founder still runs most of the company. Once the business starts copying itself into new locations or markets, it needs a system that sets goals, tests hypotheses and owns the result.

Why healthcare marketing agencies stall: the short, mid and long wins model we use with clinics
Most agencies own the click and nobody owns the front desk. How we structure clinic work in three horizons, the research behind each one, and one year of results.

Why channel tests stall after month three
Most paid channel tests do not end with a decision. They end when the budget runs out, the attribution model changes, or everyone quietly stops looking at the dashboard.