Balanced scorecard and strategy maps
The balanced scorecard is a management system that tracks a strategy through four linked sets of objectives and measures: financial, customer, internal processes, and learning and growth, drawn first as a strategy map.
The balanced scorecard is a strategy management system introduced by Robert Kaplan and David Norton in Harvard Business Review in 1992. It sets objectives and measures in four perspectives: financial, customer, internal processes, and learning and growth. A strategy map, added in 2000, draws those objectives as a cause-and-effect chain, so a team can see how better skills and processes are supposed to turn into customer and financial results.
- Origin
- Robert S. Kaplan and David P. Norton, 1992; strategy maps 2000
- Level
- 401 · Expert
- Fits
- Scale-up, Enterprise
- Time to apply
- two to three half-day workshops for a first map and scorecard, then a monthly review
- What you need
- a written strategy: target customers and why they should choose you · the leadership team in the room, led by the CEO or business-unit head · the measures you already report, to see what data exists · one owner for each objective
The balanced scorecard is a management system that describes a strategy as a set of objectives and measures in four perspectives: financial, customer, internal processes, and learning and growth. Robert Kaplan, a Harvard Business School accounting professor, and David Norton, a consultant, introduced it in a 1992 Harvard Business Review article. Their argument was that profit and return on investment report what already happened, and say little about the customer relationships, processes and skills that produce next year’s profit.
The idea changed a lot over the next 16 years. What began as a better report became a way to describe a strategy, with the strategy map as its picture, and then a full cycle for running one. The table below traces that path. Kaplan suggests some critics had read only the 1992 article or the first half of the first book.
| Year | Publication | What it added |
|---|---|---|
| 1992 | HBR article | Four perspectives of measures |
| 1993 | HBR, “Putting the Balanced Scorecard to Work” | Company cases, measures tied to strategy |
| 1996 | HBR article and first book | Scorecard as a strategic management system |
| 2000 | HBR, “Then Map It” | The strategy map |
| 2004 | Strategy Maps book | Book-length method for strategy maps |
| 2008 | HBR, “Mastering the Management System” | Closed loop linking strategy and operations |
Where did the balanced scorecard come from?
It came out of a 1990 research project run by the Nolan Norton Institute with several companies, according to Kaplan’s own history, Conceptual Foundations of the Balanced Scorecard. One guest speaker shaped it. Arthur Schneiderman, vice president of quality and productivity at Analog Devices, showed the group his company’s corporate scorecard. Every quality measure on it had improved dramatically, he said, yet the stock price had fallen by nearly 70% over three years.
Kaplan and Norton drew the lesson that operational gains mean little unless they connect to customers and money. So the credit is shared in practice. Kaplan and Norton named the method and spread it, while Schneiderman, whose strategy+business author note says he developed “one of the first corporate scorecards,” had built a working precursor. Some secondary sources date his scorecard to 1987; we found no primary source for that year.
The four perspectives
Each perspective answers one question about the strategy. The financial perspective asks what success looks like for owners. The customer perspective asks what targeted customers must experience. The internal process perspective asks which processes the company must excel at. The learning and growth perspective asks which people, systems and culture those processes need.
The word balanced refers to the mix. Financial measures lag: they confirm results months after the decisions that caused them. Customer, process and capability measures can lead: they move first. A board that sees only the lagging ones finds out about problems too late.
How does a strategy map work?
A strategy map is a one-page diagram of the strategy’s objectives in the four perspectives, linked by cause-and-effect arrows from the bottom up. Kaplan gives a simple chain: staff trained in quality tools cut process defects, fewer defects mean on-time delivery for customers, and satisfied customers buy more, which raises revenue and margins.
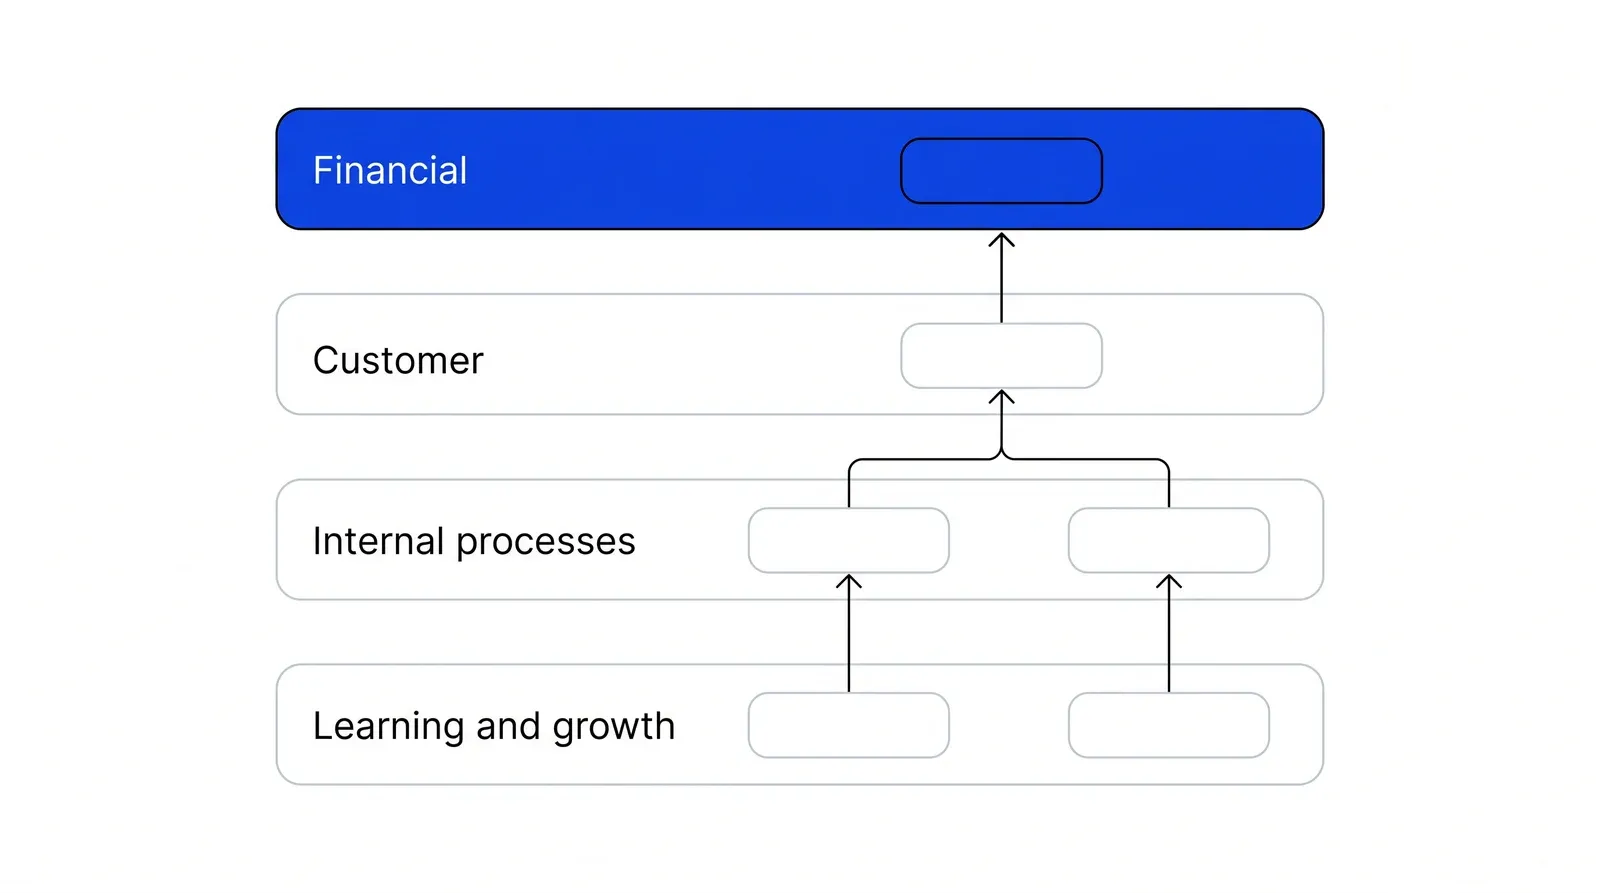
The generic template in Kaplan’s 2010 paper splits the financial layer into a productivity strategy and a growth strategy. The customer layer holds the value proposition: price, quality, availability, selection, functionality, service, relationship and brand. The process layer has four groups: operations management, customer management, innovation, and regulatory and social processes. The bottom layer is human, information and organization capital, which Kaplan and Norton set out to measure in their 2004 article on strategic readiness.
Nonprofits and public agencies flip the top. In Kaplan’s 2001 paper on nonprofits and the 2010 history, the mission goes at the top, and both donors and beneficiaries sit in the customer layer.
Objectives first, then measures
The most practical lesson in Kaplan’s history is about order. Early adopters tried to build a scorecard by sorting the metrics they already had into four boxes, or by copying the metrics of companies they admired. Kaplan writes that neither worked, because a low-cost retailer and a product innovator should not measure the same things. The fix was to write the objectives first and pick measures afterwards. One community bank wrote its customer objectives in the customer’s voice, such as “Understand me and give me the right information and advice,” and then counted customers profiled and customers with financial plans.
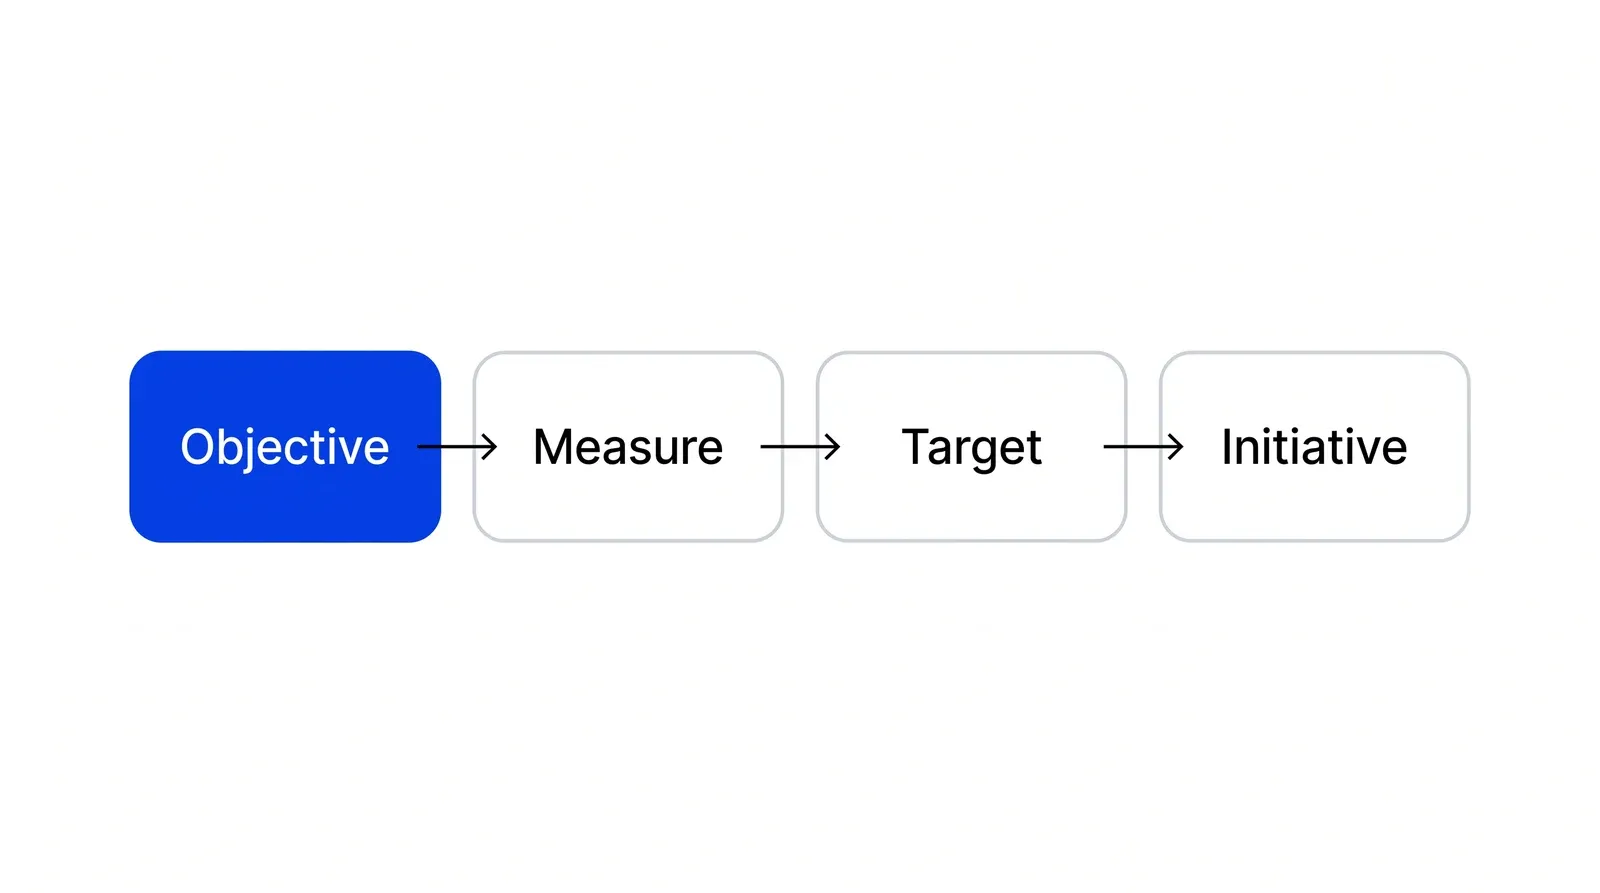
Each objective then gets a row: a measure, a target, and the initiatives that will close the gap, the structure the Balanced Scorecard Institute also teaches. If you need to break a top-level number into the metrics teams can move week to week, a KPI tree does that job and sits well under a scorecard.
What the critics and the evidence say
The causal arrows are the weakest part. Hanne Nørreklit’s 2000 paper in Management Accounting Research questioned whether the four perspectives are really linked by cause and effect. Kaplan concedes some of this: he calls the generic map a “dumbed-down” view of causality. Ittner and Larcker in HBR in 2003 found that many firms had never tested whether their nonfinancial measures predict financial results, and urged them to do so with their own data.
How people read scorecards is a second problem. In a judgment study, Lipe and Salterio (2000) found that superiors rating a unit’s performance used only the measures it shared with other units and ignored its unique ones. In an experiment, Banker, Chang and Pizzini (2004) found the strategy-linked measures counted more only when evaluators were told the strategy. Pay is a third problem. At one financial services firm studied by Ittner, Larcker and Meyer (2003), superiors weighted financial measures most, staff complained of favoritism, and the scorecard bonus was replaced with one based only on revenue.
On results, Tawse and Tabesh’s 2023 review in Business Horizons calls the evidence on firm performance mixed, and argues the scorecard works only when it is itself implemented well. Kaplan’s own explanation of failures is leadership: scorecards run by staff groups without the business head’s commitment.
How widely is it used?
Use has fallen from its peak, and claims vary. Bain’s Management Tools and Trends 2015 survey of 1,067 executives found 38% used the balanced scorecard in 2014. Its 2017 survey of 1,268 managers put usage at 29%, against an average of 30% across the 25 tools tracked. The Balanced Scorecard Institute states that more than half of major companies use it, without citing a source.
In Pushers’ Growth Lab work, the strategy map is the step that connects a growth plan to the measures the team will report each month.
How to apply Balanced scorecard and strategy maps, step by step
- Write the strategy in two sentences. State which customers you target and the value proposition you offer them: lowest price, best product, or the most complete solution. A scorecard cannot fix a missing strategy. Result: a short statement every executive signs off.
- Draw the map from the top down. Set one or two financial objectives, then ask what customers must experience to deliver them, which processes must excel to create that experience, and which skills, systems and culture those processes need. Result: a short set of objectives across four layers that fits on one page, linked by arrows.
- Test every arrow. For each link ask whether improving the lower objective would plausibly move the upper one, and how long it would take. Remove objectives that connect to nothing. Result: a map where each objective has a reason to be there.
- Pick one or two measures per objective. Choose a lead measure that moves early and a lag measure that confirms the result. Write the formula and data source for each. Result: a scorecard of measures that trace back to the map.
- Set targets and fund initiatives. Give each measure a target and a date, then list the projects that will close the gap. Stop projects that serve no objective. Result: a budget that matches the strategy.
- Run a monthly strategy review. Review the scorecard in a meeting separate from the operating review. Ask which links held and which did not, and change the map when the evidence says so. Result: a monthly record of which links held, so the map gets better over time.
Examples
Duke Children's Hospital
In 1996 Duke Children's Hospital was running an $11 million annual operating loss. Jon Meliones, its chief medical director, described in Harvard Business Review in 2000 how clinicians and administrators used a balanced scorecard to work on cost and care together. He reported that customer satisfaction ratings rose 18%, average length of stay fell 21%, readmissions fell from 7% to 3%, cost per patient dropped by nearly $5,000, and the hospital recorded a $4 million profit in 2000. These are the hospital's own figures.
Mobil US Marketing and Refining
Mobil's US marketing and refining division reorganized into 17 business units and 14 internal service companies and adopted the scorecard to tie each unit's measures and pay to one strategy aimed at premium customers, according to Kaplan's 1996 Harvard Business School case. Kaplan and Norton later wrote that the project started in 1994 and that the share of employees who understood the strategy rose from 20% in 1994 to over 80% by 1998. The authors were involved in the work, so treat it as their account.
A payments company drawing its first map
Illustrative, no real company implied. A payments company serving online merchants wants revenue growth from larger accounts. Its customer objective is fewer failed payments at checkout. The process objective under it is smarter retry and routing logic. The learning objective under that is two engineers trained in card-network rules. Measures follow: approval rate, retry recovery rate, engineers certified. If approval rises and large-account revenue does not, the arrow between them was wrong, and the map changes.
When to use it
Use it when a company has a strategy on paper but managers still run on budgets and monthly financials, when several business units need one way to show how their work serves the group strategy, or when a regulated business such as a bank or hospital must balance financial targets against quality, safety and compliance. It fits best at scale-up and enterprise stage, where there are enough people that strategy has to be communicated, not just discussed.
When not to use it
Skip it for an early-stage company still searching for product-market fit, where the strategy changes every few months and a quarterly OKR set or a single north-star metric is lighter. Skip it too if the CEO will not own it. Kaplan traced most failures to scorecards run by a staff team without the business head's leadership.
Common mistakes
- Sorting existing metrics into four boxes and calling it a scorecard. Kaplan wrote that this bottom-up approach rarely captures what drives future success; start with objectives.
- Copying the measures of an admired company with a different strategy. A low-cost player and a product innovator need different scorecards.
- Linking bonuses to a scorecard with loosely defined weights. In one financial services firm studied by Ittner, Larcker and Meyer, managers put most weight on financial measures, staff complained of favoritism, and the plan was dropped.
- Treating the arrows as proven. They are hypotheses about cause and effect and need testing against data.
- Tracking every measure available. Arthur Schneiderman argued that managers cannot actively watch that many, and that some companies did well with as few as three.
FAQ
What are the four perspectives of the balanced scorecard?
Financial (how the strategy creates value for owners), customer (what targeted customers experience and value), internal processes (what the company must do well to deliver that), and learning and growth (the people, information systems and culture behind those processes). Nonprofits and public bodies usually put their mission at the top instead of financial results.
What is the difference between a balanced scorecard and a strategy map?
A strategy map is a one-page diagram of strategic objectives across the four perspectives, connected by cause-and-effect arrows. The balanced scorecard is the table that sits beneath it: for each objective, one or two measures, a target and the initiatives that will close the gap. Kaplan writes that projects now build the map first.
Who created the balanced scorecard?
Robert Kaplan of Harvard Business School and consultant David Norton named it in a 1992 Harvard Business Review article, based on a 1990 multi-company research study. Arthur Schneiderman had built an earlier corporate scorecard at Analog Devices and presented it to that study group, so some accounts credit him with the first version.
What measures go into a balanced scorecard?
Measures follow from the objectives, so they differ by strategy. Typical ones are revenue growth and cost per unit (financial), retention and share of customer spending (customer), cycle time, defect or approval rate (processes), and staff skills coverage or system readiness (learning and growth). Pick them only after the objectives are written.
Is the balanced scorecard still used?
Yes, though less than at its peak. In Bain's Management Tools and Trends survey, 38% of executives reported using it in 2014 and 29% in the 2017 survey, when the average across 25 tools was 30%. Some practitioner sites claim more than half of large companies use it, without citing data.
Sources
- Robert S. Kaplan, David P. Norton, The Balanced Scorecard: Measures that Drive Performance, Harvard Business Review, January-February 1992
- Robert S. Kaplan, David P. Norton, Putting the Balanced Scorecard to Work, Harvard Business Review, September-October 1993
- Robert S. Kaplan, David P. Norton, Using the Balanced Scorecard as a Strategic Management System, Harvard Business Review, 1996 (HBR Classic reprint 2007)
- Robert S. Kaplan, David P. Norton, Having Trouble with Your Strategy? Then Map It, Harvard Business Review, September-October 2000
- Robert S. Kaplan, David P. Norton, Measuring the Strategic Readiness of Intangible Assets, Harvard Business Review, February 2004
- Robert S. Kaplan, David P. Norton, Mastering the Management System, Harvard Business Review, January 2008
- Robert S. Kaplan, Conceptual Foundations of the Balanced Scorecard, Harvard Business School Working Paper 10-074, 2010
- Harvard Business Review Press, The Balanced Scorecard: Translating Strategy into Action (Kaplan and Norton, 1996)
- African Union Library, catalogue record: Kaplan and Norton, Strategy Maps: Converting Intangible Assets into Tangible Outcomes, Harvard Business School Press, 2004
- Robert S. Kaplan, David P. Norton, Linking the Balanced Scorecard to Strategy, California Management Review 39(1), 1996
- Robert S. Kaplan, Strategic Performance Measurement and Management in Nonprofit Organizations, Nonprofit Management and Leadership 11(3), 2001
- Arthur M. Schneiderman, Time to Unbalance Your Scorecard, strategy+business, July 2001
- Jon Meliones, Saving Money, Saving Lives, Harvard Business Review, November-December 2000
- PubMed record and abstract: Meliones, Saving Money, Saving Lives, Harv Bus Rev 78(6), 2000
- Robert S. Kaplan, Mobil USM&R (A): Linking the Balanced Scorecard, Harvard Business School case 197-025, 1996
- Harvard Business School Working Knowledge, Kaplan and Norton, The Strategy-Focused Organization, October 2000
- Bain & Company, Darrell Rigby and Barbara Bilodeau, Management Tools & Trends 2015
- Bain & Company, Darrell Rigby and Barbara Bilodeau, Management Tools & Trends (2017 survey), 2018
- Balanced Scorecard Institute, Balanced Scorecard Basics
- Hanne Nørreklit, The Balance on the Balanced Scorecard: A Critical Analysis of Some of Its Assumptions, Management Accounting Research 11(1), 2000
- Marlys Gascho Lipe, Steven E. Salterio, The Balanced Scorecard: Judgmental Effects of Common and Unique Performance Measures, The Accounting Review 75(3), 2000
- Rajiv D. Banker, Hsihui Chang, Mina J. Pizzini, The Balanced Scorecard: Judgmental Effects of Performance Measures Linked to Strategy, The Accounting Review 79(1), 2004
- Christopher D. Ittner, David F. Larcker, Marshall W. Meyer, Subjectivity and the Weighting of Performance Measures: Evidence from a Balanced Scorecard, The Accounting Review 78(3), 2003
- Christopher D. Ittner, David F. Larcker, Coming Up Short on Nonfinancial Performance Measurement, Harvard Business Review, November 2003
- Alex Tawse, Pooya Tabesh, Thirty Years with the Balanced Scorecard: What We Have Learned, Business Horizons 66(1), 2023
Last updated Oct 9, 2026


Fractional COO or embedded operations team? How to choose at Series A
The two models solve different problems: how to tell which one your company needs, and what each costs in time and control.

What operational systems successful fintech startups use: lessons from ten companies
Starling, Monzo, Qonto, bunq, Lunar, Pleo, Tide, Ramp, Mercury and Column scaled on four operating systems. Regulators' findings show what breaks when one of them lags behind growth.

Marketing agency or growth system: when a company outgrows its agency
An agency is the right call while the founder still runs most of the company. Once the business starts copying itself into new locations or markets, it needs a system that sets goals, tests hypotheses and owns the result.