Customer-based corporate valuation
Customer-based corporate valuation forecasts how many customers a firm will win, keep and earn from, then runs that revenue through a standard discounted cash flow model to estimate what the whole company is worth.
Customer-based corporate valuation (CBCV) is a way to value a company from the bottom up: you model customer acquisition, retention and spending from the customer data the firm discloses, turn that into a revenue forecast, and discount the resulting cash flows. It shows what the customer base is worth and whether new customers earn back what they cost.
- Origin
- Sunil Gupta, Donald Lehmann and Jennifer Stuart (first version); Daniel McCarthy, Peter Fader and Bruce Hardie (modern models), 2004; 2017 and 2018
- Level
- 401 · Expert
- Fits
- Scale-up, Enterprise
- Time to apply
- A few days for a first pass on a subscription firm, longer for a retailer
- What you need
- the company's public filings, or its board and data-room figures: customers acquired, active customers, revenue per customer, by quarter · a standard discounted cash flow model with margin, capex, tax and discount rate assumptions · someone who can fit simple statistical models of retention, in a spreadsheet or in code
Customer-based corporate valuation (CBCV) is the practice of valuing a firm by forecasting what its current and future customers will do, then converting that forecast into cash flows and a share price. Daniel McCarthy and Peter Fader describe it as tying the value of the customer base to the overall financial valuation using publicly disclosed data. Their January 2020 Harvard Business Review article opens with the apparel retailer Revolve, whose June 2019 IPO priced it at $1.2 billion and whose shares then rose another 89% on the first day, to about 4.5 times trailing revenue.
Where does customer-based valuation come from?
The first complete version is Gupta, Lehmann and Stuart’s 2004 paper in the Journal of Marketing Research. They defined a customer’s value as the expected sum of discounted future earnings and showed, using public data for five firms, that valuing customers makes it feasible to value firms with negative earnings. They also reported that a 1% improvement in retention raises firm value by about 5%, against 1% for margin and 0.1% for acquisition cost.
Later work tightened the finance. Schulze, Skiera and Wiesel (2012) added debt and non-operating assets, and found that across more than 2,000 companies over ten years a 10% rise in customer equity amplified to a 15.5% rise in shareholder value. Bonacchi, Kolev and Lev (2015) found that a customer-value measure for subscription firms is associated with stock price beyond what accounting figures explain. McCarthy, Fader and Hardie (2017) and McCarthy and Fader (2018) rebuilt the customer models so that finance professionals could trust them. The two later authors went on to found Theta Equity Partners in 2018 to apply the method commercially, so what they say about its track record comes from a firm with something to sell.
Neighbouring work covers parts of the chain. Blattberg and Deighton introduced the customer equity test in Harvard Business Review in 1996, and Rust, Lemon and Zeithaml used customer equity to compare marketing options in 2004. Bauer and Hammerschmidt (2005) joined customer equity to a discounted cash flow formally, and Kumar and Shah (2009) tested the link to market capitalization with two Fortune 1000 firms. On the modelling side, the Pareto/NBD model of Schmittlein, Morrison and Colombo (1987) and the simpler BG/NBD of Fader, Hardie and Lee (2005) describe customers who leave without notice, and Jerath, Fader and Hardie (2016) adapt such models to aggregated data. Gupta and colleagues reviewed the field in 2006.
How does a customer forecast become a firm value?
The method swaps one line in a standard discounted cash flow model. Instead of growing revenue at an assumed rate, you forecast it from three behaviours: how many customers arrive, how many stay, and how much they spend. Everything below revenue is ordinary finance: margins, fixed costs, tax, capex, then the sum of discounted free cash flow and non-operating assets less net debt.
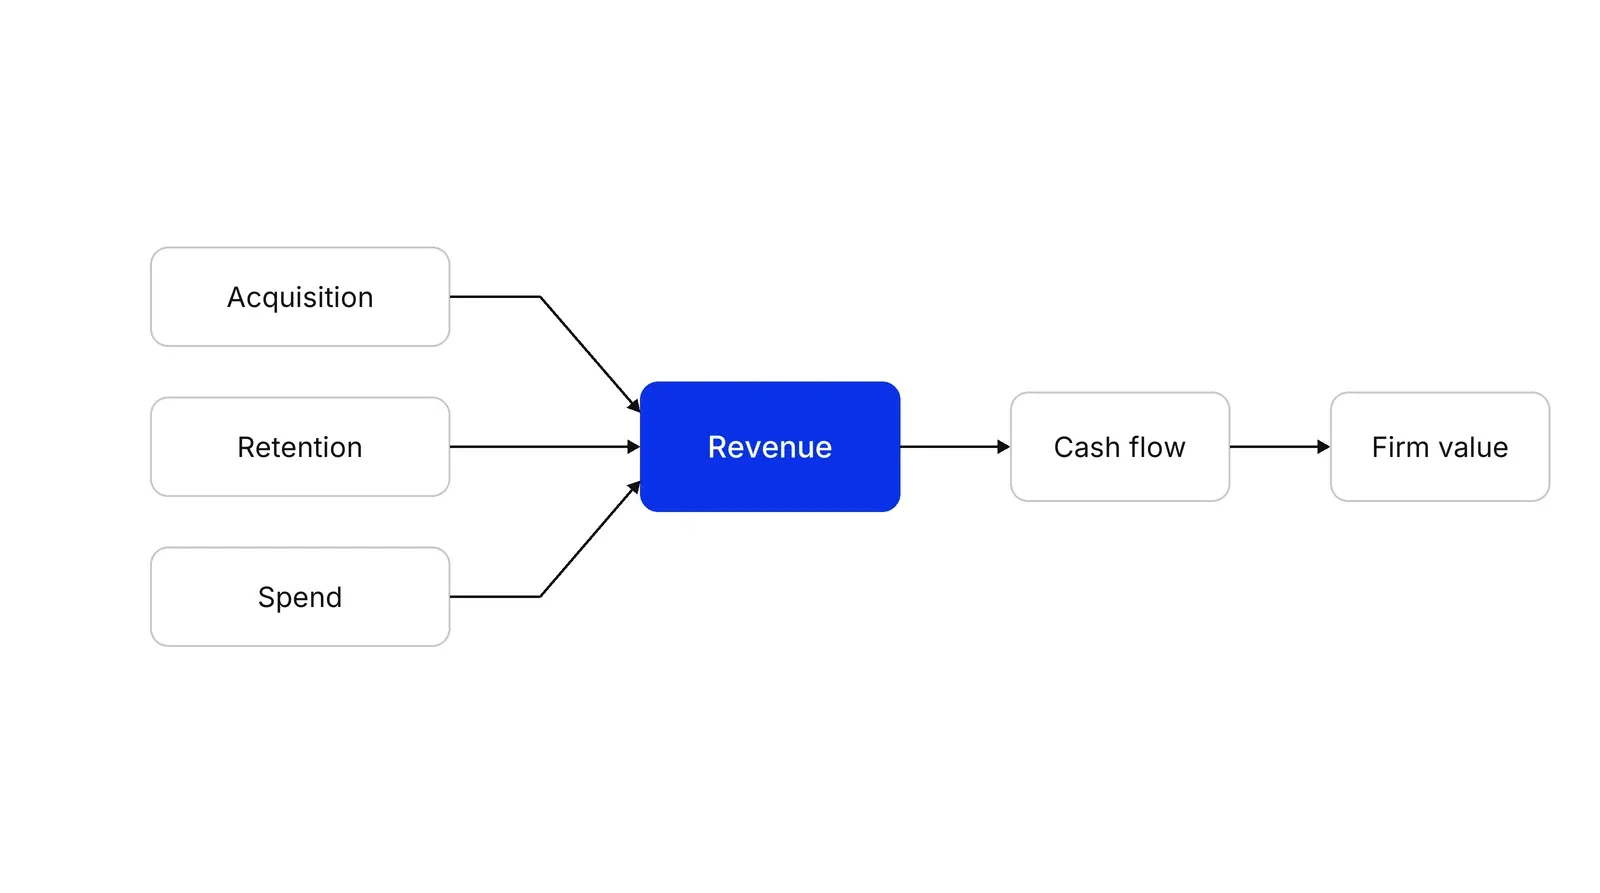
Customer equity is the remaining value of today’s customers plus the net present value of customers the firm has yet to win. For many firms it is most of the shareholder value, according to McCarthy and Fader. For how a retention curve by cohort is built and projected, see cohort-based LTV and cohort analysis; this page uses the same logic one level up.
Why does the type of business change the method?
Whether churn is visible decides the difficulty. McCarthy and Fader list three problems for firms that sell without contracts: churn is not observed, repeat buying and spend vary widely, and outsiders only see aggregated, repeated cross-sectional summaries.
| Contractual (subscription) | Noncontractual (retail, marketplace) | |
|---|---|---|
| Churn | Observed and often disclosed | Latent, customers just stop ordering |
| Usual disclosure | Subscribers added, lost, ARPU | Active customers, orders, revenue |
| Published example | Dish Network, Sirius XM | Overstock, Wayfair |
| Main risk | Ignoring differences between customers | Treating “active” as “alive” |
Fader and McCarthy said in 2016 that treating all customers as average understates firm value, as Fader and Hardie showed in 2010. The shortcut that fails is to reuse a subscription formula with a repeat rate as the retention rate. McCarthy and Fader report that eBay and Amazon, the two noncontractual firms in the 2004 study, were also its two worst fits. Definitions matter too: Overstock counts a customer as active after an order in the last three months, Wayfair twelve, Camping World twenty-four.
How well does it work?
On the authors’ own examples, close for three firms and far off for one. At the end of Q1 2015 the model valued Dish at $64.62 a share against $66.38, and Sirius XM at $4.24 against $3.90. At the end of Q1 2017 it valued Overstock at $16.88 against $15.50 and Wayfair at $10.24 against $64.16. The Dish and Sirius figures come from the open copy of the 2017 paper, the retail figures from the 2017 working paper behind the JMR article.
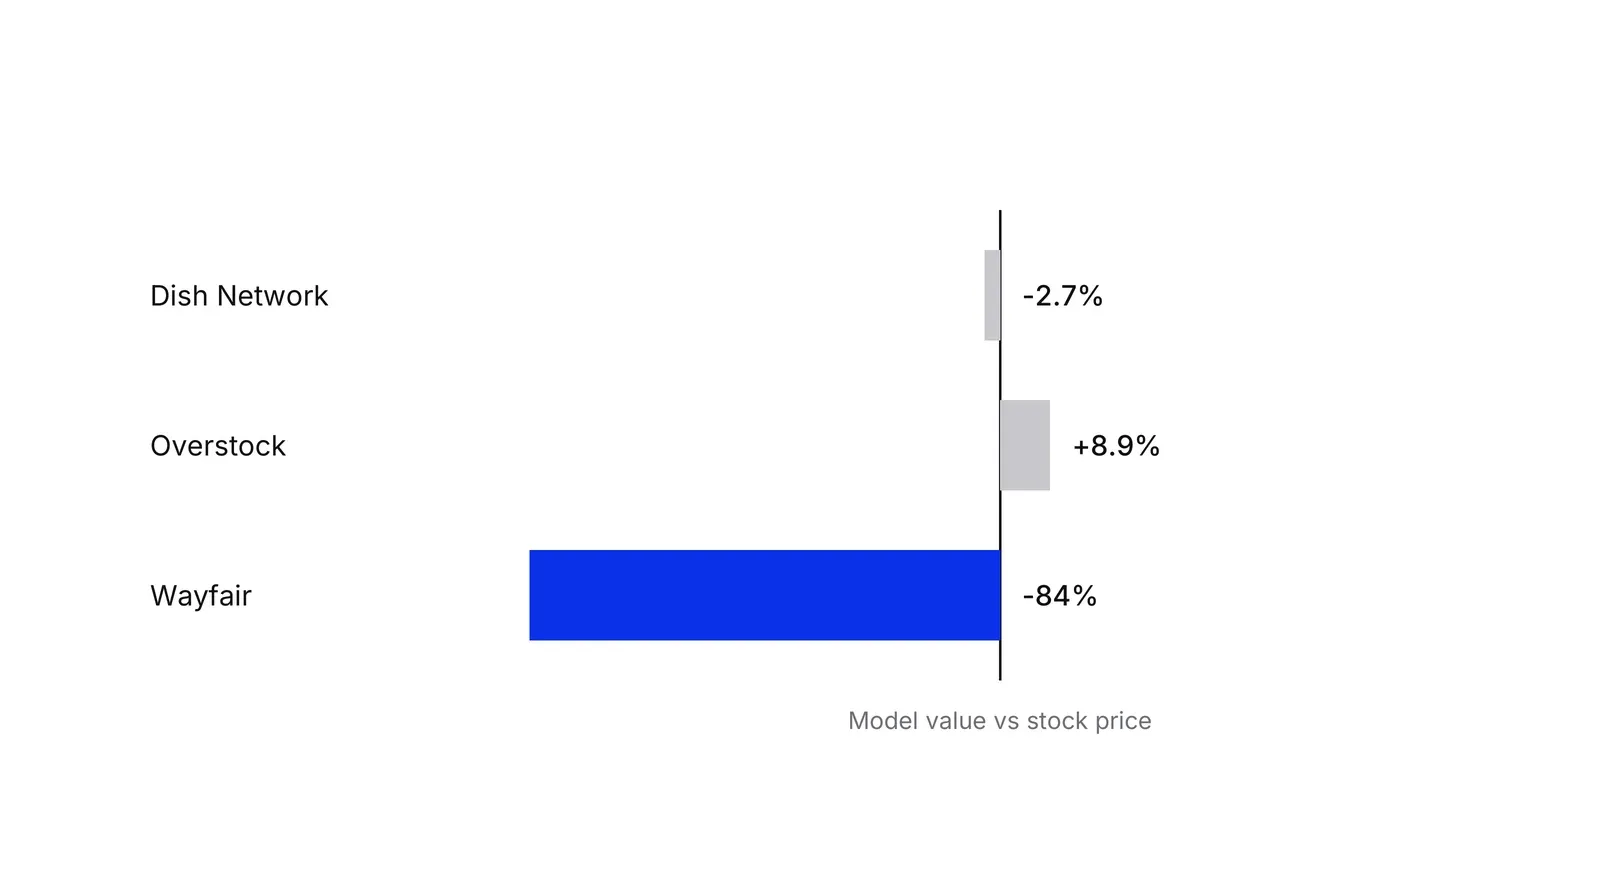
The Wayfair gap is the interesting one. The authors reported that even their most optimistic simulated scenario gave $57.03, still about 11% below the price, and that the stock was heavily shorted at the time. A model that disagrees with the market is not proof that the market is wrong. It does show what the price requires customers to do. In a Knowledge at Wharton podcast, Fader and McCarthy say they have missed on some firms too and that the misses show no systematic bias; we found no independent test of that record.
Disclosure helps both sides. Bayer, Tuli and Skiera coded 511 annual reports from telecom and airline firms and found that forward-looking customer disclosures were associated with lower investor uncertainty, and found no support for the claim that disclosure hurts future cash flows.
What does it say about unit economics?
It splits growth into what a new customer costs and what that customer is expected to earn. At Wayfair the 2017 working paper behind the JMR article puts acquisition cost near $69 against about $59 of expected later profit per customer, roughly a $10 loss; Overstock spent about $38 for about $47, roughly $9 earned. Apply the same test with your own numbers in unit economics and the LTV to CAC ratio.
The Dish analysis adds two points that an average hides. A newly acquired customer had an expected remaining life of 5.5 years, against 9.4 years for one acquired ten years earlier, which fits the idea that customers who have stayed a long time are more likely to keep staying. Where the same logic applies inside a company, net revenue retention is the closest operating metric.
Where does it break?
It is an outside view built for passive investors valuing a going concern. McCarthy and Fader say so: it uses no pricing or marketing-mix data and does not correct for endogeneity, so it cannot show which marketing action would raise value. McCarthy has also noted that companies often avoid disclosing data that makes them look bad. The authors assume disclosure is not strategic, and firms that stop reporting a metric when it turns bad would break that.
The 2017 Dish paper adds a practical point. Their sensitivity analysis found the valuation moved most when retention and spend were uncertain, so better disclosure of lost customers would help investors most. The authors also say the method could suit private companies in due diligence, where a few quarterly summaries arrive before the transaction log does. A Growth Lab plan starts from the same arithmetic of acquisition, retention and spend, applied inside the company.
How to apply Customer-based corporate valuation, step by step
- Decide whether churn is visible. A subscription firm knows when a customer leaves. A retailer or marketplace does not, because customers simply stop buying. The answer sets which retention model you need. Result: one line stating the firm is contractual or noncontractual.
- Collect the customer disclosures. List acquired, lost and active customers and revenue per customer for every quarter available, and write down how the company defines 'active'. Result: a quarterly table with definitions attached, so two firms are never compared on mismatched metrics.
- Fit acquisition, retention and spend. Fit a model for each driver so that the behaviour it implies reproduces the disclosed totals. Check it by holding back the last quarters and comparing forecasts with what happened. Result: three models that pass a holdout test.
- Project revenue far ahead. Run the models forward until later cash flows no longer matter; the published studies project 50 years. Result: a quarterly revenue forecast built from customers rather than from a growth rate.
- Run the standard cash flow model. Apply margins, fixed costs, capex, tax and the discount rate, then add non-operating assets and subtract net debt. Result: a value per share, not just a customer figure.
- Add a range and read the unit economics. Resample the forecast to get a valuation interval, then compare what a new customer costs with what that customer is expected to earn. Result: a value range and a verdict on whether growth is paying for itself.
Examples
Dish Network, a subscription firm
McCarthy, Fader and Hardie valued Dish from its quarterly disclosures at the end of Q1 2015 and got $64.62 a share against a market price of $66.38. They also estimated that a customer acquired that quarter was worth $1,426 in future pre-tax profit against an average acquisition cost of $854, with a 41% chance that the company loses money on a given new customer.
Overstock and Wayfair, two online retailers
McCarthy and Fader valued both at the end of Q1 2017. The model gave Overstock $16.88 against a $15.50 price and Wayfair $10.24 against $64.16. The unit economics explain part of the gap: Wayfair spent about $69 to acquire a customer who was worth about $59 afterwards, Overstock about $38 for one worth about $47.
A clinic membership chain (illustrative)
Take 10,000 members who each leave $40 a month after variable costs, with 2% leaving each month and a 1% monthly discount rate. Each member is worth about $1,347 today, so the existing base is worth about $13.5 million before fixed costs, future members and net debt. Real members do not all leave at 2%, so a proper model would fit retention by tenure.
When to use it
Use it when a company's value rests mostly on customers it has yet to monetize, such as a fast-growing subscription or e-commerce firm with thin or negative earnings, or when you assess an investment or acquisition and need to know whether acquired customers repay their cost. It suits board and investor discussions where a revenue multiple hides what drives the number.
When not to use it
Skip it when customer data is missing or defined too loosely to compare, when most value comes from assets other than customers, or for a quick screen where a revenue multiple is enough. It values a business as a going concern for a passive outside investor, so it does not tell management which marketing action to take.
Common mistakes
- Treating a noncontractual firm like a subscription firm. Gupta, Lehmann and Stuart used a retention proxy for eBay and Amazon, and those two were the worst fits in their sample.
- Using one average retention rate. Customers differ, and ignoring that understates value, as Fader and Hardie showed.
- Comparing firms that define 'active customer' differently. Overstock, Wayfair and Camping World count customers who ordered in the last 3, 12 and 24 months.
- Reading the point estimate as a price target. The authors report valuation intervals because the forecast is uncertain, and the simulated distribution for Wayfair put a 46% probability on a share value of zero.
- Forgetting debt and non-operating assets. Schulze, Skiera and Wiesel showed that skipping them biases how customer changes feed through to shareholder value.
FAQ
What is customer-based corporate valuation?
It is the process of valuing a firm by forecasting current and future customer behaviour, using customer data together with ordinary financial data. McCarthy and Fader define it that way. The forecast supplies the revenue line of a discounted cash flow model, so the result is a company value, not only a customer value.
How is it different from customer lifetime value?
Lifetime value prices one customer. Customer-based valuation adds up the remaining value of existing customers and the value of customers not yet acquired, then connects that total to the whole firm through its debt, non-operating assets and costs. Gupta and colleagues describe it as the step from customer value to firm value.
Can you value a company with no profits this way?
Yes, that was the original motivation. Gupta, Lehmann and Stuart showed that valuing customers makes it feasible to value high-growth firms with negative earnings, using Amazon, Ameritrade, eBay and E*Trade as test cases. The cash flows come from forecast customer margins rather than from current profit.
How accurate is customer-based valuation?
On the authors' own examples it landed close to the stock price for Dish, Sirius XM and Overstock, and far below it for Wayfair. Four firms is a small sample, chosen because they disclose enough customer data. Treat it as a structured second opinion and read the interval, not a forecast of the share price.
Do you need a subscription business to use it?
No. McCarthy and Fader's 2018 paper extends the method to noncontractual firms, where churn is not observed, by modelling latent attrition, repeat purchasing and spend per order from aggregated disclosures. It is harder to do well, and the results depend more on how the company defines its customer metrics.
Sources
- Daniel McCarthy, Peter Fader, Bruce Hardie, Valuing Subscription-Based Businesses Using Publicly Disclosed Customer Data, Journal of Marketing 81(1), 2017
- London Business School Research Online, repository record and open copy of McCarthy, Fader and Hardie (2017)
- Daniel McCarthy, Peter Fader, Customer-Based Corporate Valuation for Publicly Traded Noncontractual Firms, Journal of Marketing Research 55(5), 2018
- Sunil Gupta, Donald Lehmann, Jennifer Ames Stuart, Valuing Customers, Journal of Marketing Research 41(1), 2004
- Peter Fader, Daniel McCarthy, How to Value a Company by Analyzing Its Customers, Harvard Business Review, January-February 2020
- Christian Schulze, Bernd Skiera, Thorsten Wiesel, Linking Customer and Financial Metrics to Shareholder Value: The Leverage Effect in Customer-Based Valuation, Journal of Marketing 76(2), 2012
- Massimiliano Bonacchi, Kalin Kolev, Baruch Lev, Customer Franchise: A Hidden, Yet Crucial, Asset, Contemporary Accounting Research 32(3), 2015
- Hans Bauer, Maik Hammerschmidt, Customer-based corporate valuation: integrating the concepts of customer equity and shareholder value, Management Decision 43(3), 2005
- Emanuel Bayer, Kapil Tuli, Bernd Skiera, Do Disclosures of Customer Metrics Lower Investors' and Analysts' Uncertainty but Hurt Firm Performance?, Journal of Marketing Research 54(2), 2017
- V. Kumar, Denish Shah, Expanding the Role of Marketing: From Customer Equity to Market Capitalization, Journal of Marketing 73(6), 2009
- Roland Rust, Katherine Lemon, Valarie Zeithaml, Return on Marketing: Using Customer Equity to Focus Marketing Strategy, Journal of Marketing 68(1), 2004
- Robert Blattberg, John Deighton, Manage Marketing by the Customer Equity Test, Harvard Business Review, July-August 1996
- Sunil Gupta and others, Modeling Customer Lifetime Value, Journal of Service Research 9(2), 2006
- Peter Fader, Bruce Hardie, Customer-Base Valuation in a Contractual Setting: The Perils of Ignoring Heterogeneity, Marketing Science 29(1), 2010
- David Schmittlein, Donald Morrison, Richard Colombo, Counting Your Customers: Who Are They and What Will They Do Next?, Management Science 33(1), 1987
- Peter Fader, Bruce Hardie, Ka Lok Lee, Counting Your Customers the Easy Way: An Alternative to the Pareto/NBD Model, Marketing Science 24(2), 2005
- Kinshuk Jerath, Peter Fader, Bruce Hardie, Customer-base analysis using repeated cross-sectional summary (RCSS) data, European Journal of Operational Research 249(1), 2016
- Knowledge at Wharton, Why Your Business Is Only as Valuable as Your Customers, January 2016
- Knowledge at Wharton, Finding the Value in IPOs: Why Customer Behavior Holds the Key (podcast)
- Emory University Goizueta Effect, In Corporate Valuation, Customers Are King (Daniel McCarthy)
- Theta Equity Partners, About us
Last updated Oct 9, 2026


How to calculate channel payback and unit economics
A CAC number that only marketing believes will not survive a finance review. This guide calculates channel payback so both teams work from the same model.

Fractional CFO vs finance operations: which gap do you actually have
A fractional CFO is a person. Finance operations is a system. Companies searching for one are often missing the other, or both.