Customer health score
A customer health score combines usage, support, engagement and sentiment signals into one number or color per account, so a customer success team can see who needs attention before a renewal is at risk.
A customer health score is a single number or color per customer account, built from weighted signals such as product usage, support activity, engagement and sentiment, that shows how likely the account is to renew. Teams use it to decide which accounts need action this week. A score is only worth trusting after a backtest shows it separated past churners from past renewers.
- Origin
- No single author; developed in customer success practice and software, with Gainsight and ChurnZero among the vendors, No agreed date
- Level
- 301 · Advanced
- Fits
- Small and mid-size, Scale-up
- Time to apply
- Two to three weeks for a first score and a first backtest, if you have a year of account history
- What you need
- a list of customer accounts with their renewal or churn outcome for the last 12 months or more · product usage, support and engagement data saved by date, not just today's values · a customer success lead who will act on a red account within a week
A customer health score is a single number or color for each customer account, calculated from signals such as product usage, support activity, engagement and sentiment, that shows how likely the account is to renew. Customer success teams use it to decide which accounts need a call this week. Nobody owns the idea. It grew up inside customer success practice and the software built for it, and Gainsight and ChurnZero are two of its vendors. Their pages describe how their own tools work. None of them is evidence that a score predicts churn, and that gap is the subject of this page.
What goes into a score
Inputs fall into two kinds: what customers do and what they say. Gainsight’s scorecard guide names six areas to combine: product usage against the customer’s entitlements, feature adoption, sentiment, engagement such as cadence-call attendance, relationships such as an active executive sponsor, and customer value. ChurnZero’s list adds journey progression, support history such as ticket volume and SLA misses, and loyalty measures including tenure, NPS, CSAT and CES.
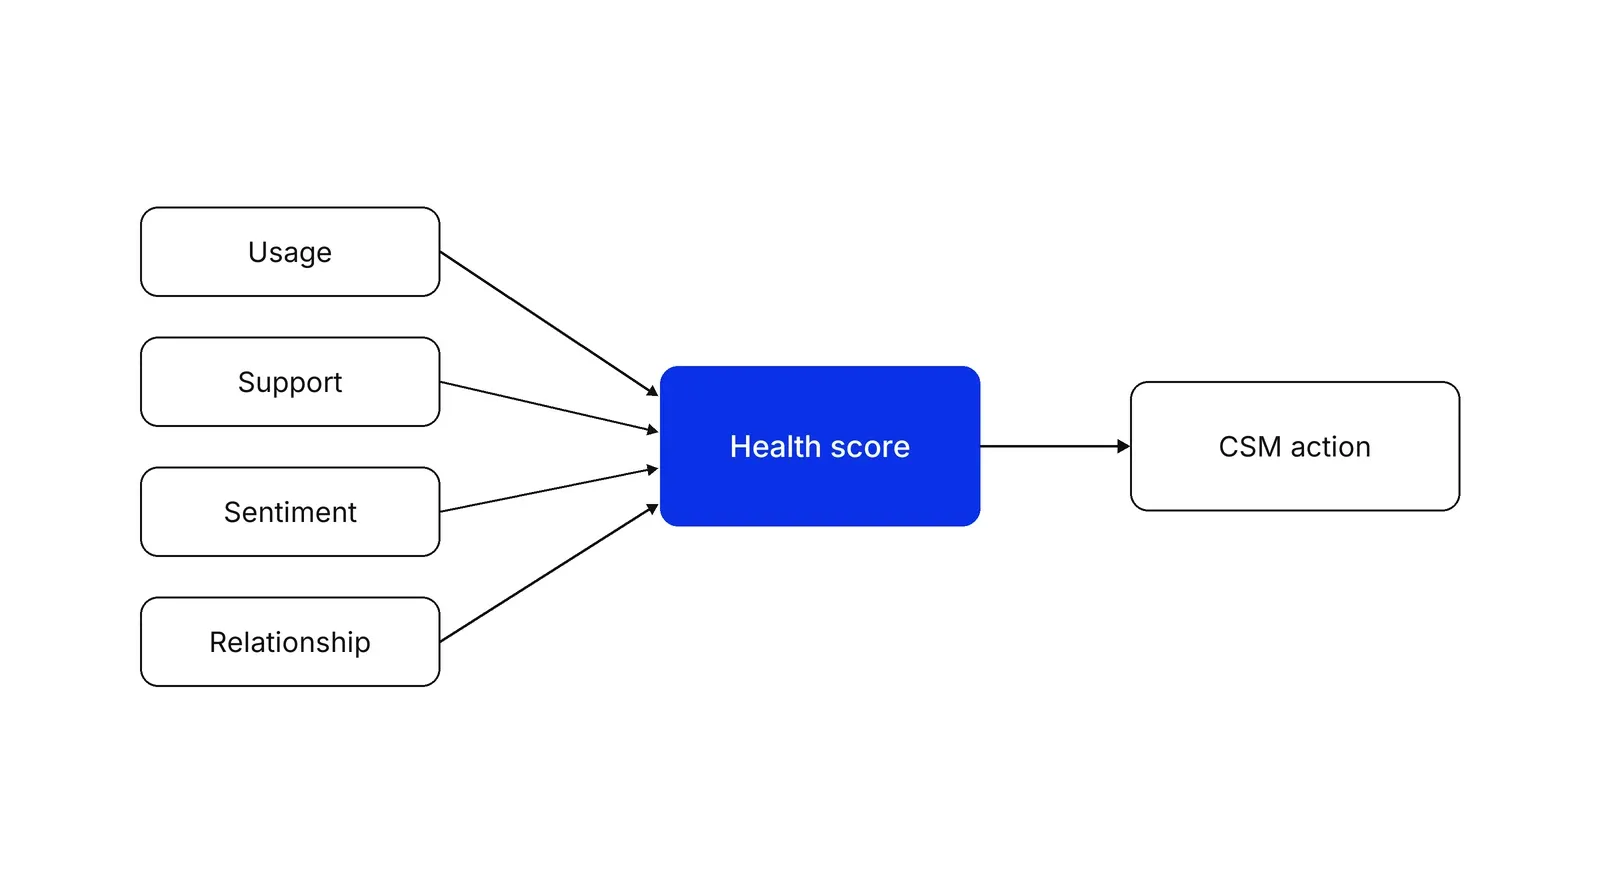
Researchers draw a similar line. Sunil Gupta and Valarie Zeithaml’s review of customer metrics separates perceptual metrics such as satisfaction from behavioral ones such as retention and lifetime value. Do not assume the survey inputs deserve the top weights. A study by Keiningham and colleagues tried to replicate the claim that Net Promoter beats other loyalty measures as a predictor of growth and could not, so treat NPS and CSAT and CES as candidate inputs to test, not givens.
How the number is built
A score is a weighted sum. In Gainsight’s scorecards each dimension is a measure, measures can be grouped, and the scorecard’s score is set from them. Scores can be numbers, letters or colors. Admins configure weights, and a Gainsight community guide adds overrides, so a critical risk, such as a departed sponsor, pulls the overall score down whatever the other measures say.
One formula rarely fits everyone. ChurnZero recommends separate scores by customer size, lifecycle stage, industry and region. The lifecycle split matters most in the first months, where progress through an onboarding framework is a better signal than steady-state usage.
The weights are usually a human guess. Robyn Dawes argued in 1979 that simple models with equal or rough weights often predict nearly as well as carefully fitted ones. So start simple and let the backtest, not the weights, carry the argument.
Health score or churn model?
The two overlap, and people mix them up.
| Health score | Churn prediction model | NPS or CSAT | |
|---|---|---|---|
| What it is | A composite of chosen signals | A statistical model of who left | One survey measure |
| Weights come from | People’s judgment | Fit to past outcomes | None |
| Read by | Customer success staff | Analysts, often feeding a tool | Anyone |
| Output | Number or color per account | Probability per account | A score per respondent |
Churn models have a research record. Neslin and colleagues ran a prediction tournament in which academics and practitioners built models on public data, and found that differences between methods could change the profit of a churn campaign by hundreds of thousands of dollars. Lemmens and Croux showed that bagging and boosting improved churn prediction at a US wireless carrier. A health score borrows that discipline when it is tested the same way.
Does it predict churn? Backtest it
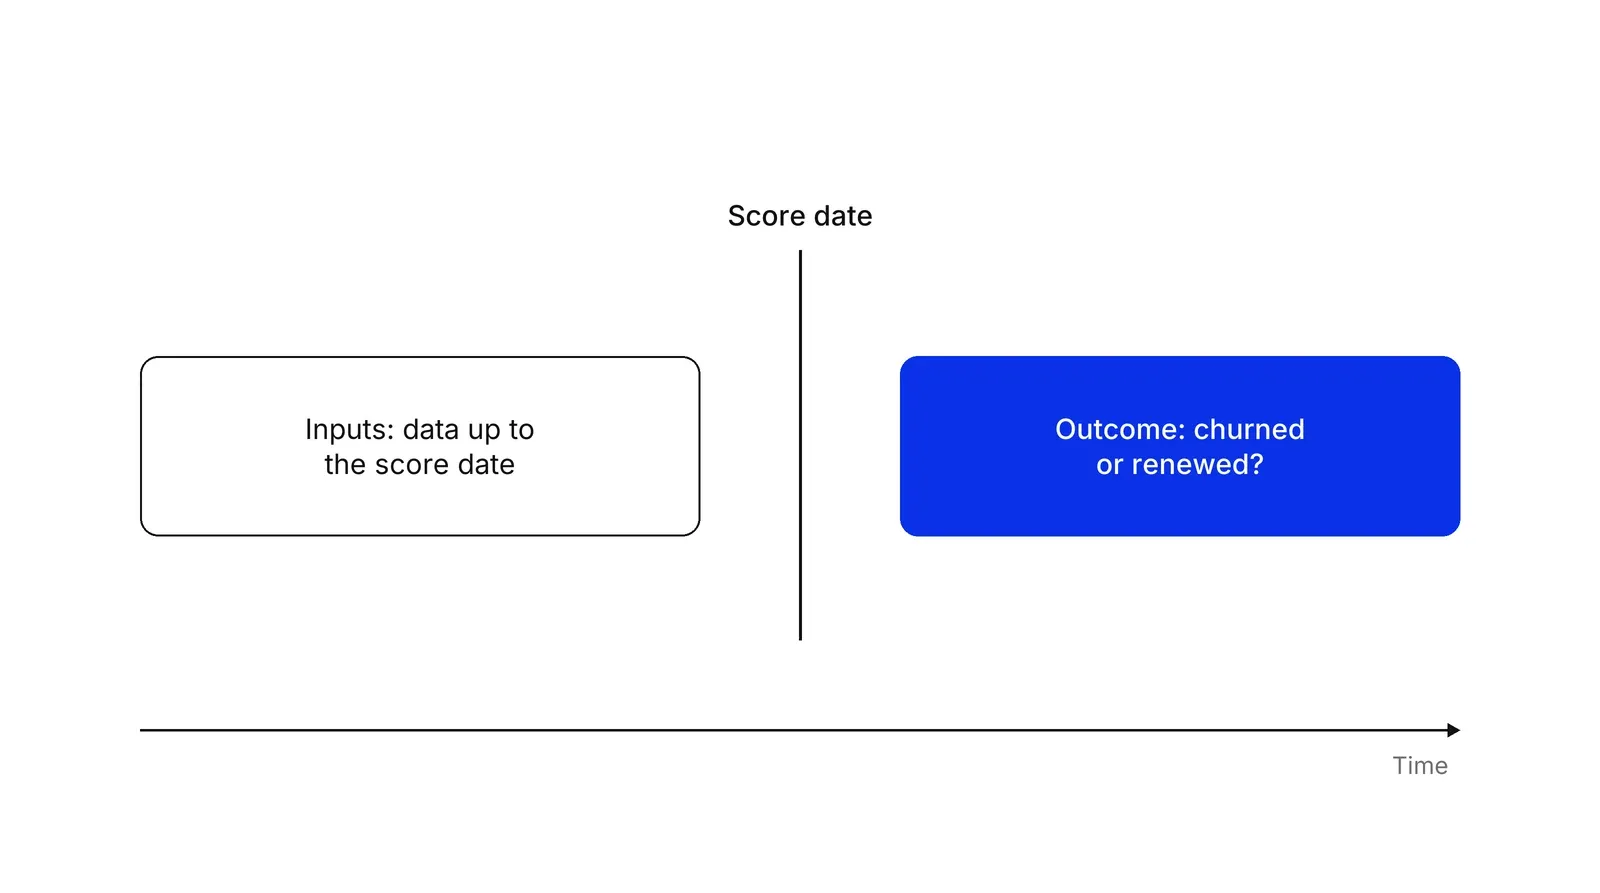
A backtest asks what the score said about each account on a past date, then checks what happened next. Gainsight’s guide says to establish benchmarks and to revisit the scorecard after repeated churn surprises, and ChurnZero’s pages talk about predicting churn, but neither describes this test.
Freeze the inputs on the date
Compute the score from data that existed on that date, not from today’s records. Kaufman, Rosset, Perlich and Stitelman call the alternative leakage: information about the target that should not have been available. Using a “last login” field overwritten after the account churned is the classic case.
Read the results by band
Group accounts by their band on the score date and compare churn rates. The illustrative figures below use the first example.
| Band | Accounts | Churned in 6 months | Churn rate | Share of all churners |
|---|---|---|---|---|
| Healthy | 600 | 16 | 2.7% | 20% |
| Watch | 250 | 24 | 9.6% | 30% |
| At risk | 150 | 40 | 26.7% | 50% |
The churn rate should rise from band to band. Check three more things. First, warning time: how many days before cancellation the account turned red, which must exceed the time a CSM needs to respond. Second, ranking: the area under the ROC curve is, in the words of Hanley and McNeil, the probability that a random churner is ranked as riskier than a random non-churner, so 0.5 is a coin flip. Because churners are rare, also look at precision and recall, which Saito and Rehmsmeier argue are more informative on imbalanced data. Third, calibration: of accounts a model labels 80% likely to churn, about 80% should do so, which scikit-learn’s calibration guide explains and the Brier score summarizes.
Test on a later period
If you tune weights on one period, score the next. scikit-learn’s cross-validation guide warns that shuffled splits put near-in-time rows in both training and test sets, which inflates results; its TimeSeriesSplit trains only on earlier data. Neslin and colleagues found churn models lost very little accuracy on data compiled three months after the training data, so a quarterly retest is a reasonable rhythm.
Mind the sample size
B2B churners are few. For regression fits, Peduzzi and colleagues found problems below ten events per variable, so 30 churned accounts can support about three fitted inputs. With fewer, keep hand weights and report the band table with its uncertainty. Accounts still active are not failures: survival analysis, whose standard regression is Cox’s 1972 model, treats them as censored and keeps their time at risk.
Judge misses by money as well as counts. Verbeke and colleagues titled their churn paper a profit-driven approach for that reason. Losing one large account can outweigh ten small ones.
Risk is not the same as savable
A high risk score says an account may leave. It does not say a call will keep it. Eva Ascarza’s field experiments found customers at highest churn risk are not necessarily the best targets for retention programs. So test the action too, with a holdout group that gets no outreach. Cohort analysis separates a score’s effect from the baseline retention of each signup cohort, and Fader and Hardie’s retention projection shows how to forecast that baseline. A Growth Lab plan starts from a backtested score and one named action per band.
How to apply Customer health score, step by step
- Define the outcome. Decide what the score should predict, for example 'cancels or does not renew within 90 days'. Decide which accounts count and who counts as churned: a downgrade to a free plan, a lapsed contract, a closed account. Result: one sentence that every later check is measured against.
- Choose a few inputs. List candidate signals in two groups: what the customer does (usage against what they bought, feature adoption, logins, open support tickets) and what they say (survey answers, a CSM's rating). Keep five to eight, a rule of thumb rather than a researched figure. Result: a short input list, each with a data source.
- Set weights and bands. Start with equal or rough weights and three bands such as healthy, watch and at risk. Build a separate version for a segment when its customers behave differently, for example onboarding accounts and long-term accounts. Result: a formula a colleague can recompute by hand.
- Rebuild the score for past dates. Using only data that existed on each date, compute the score for every account as it would have looked on, say, the first day of each of the last four quarters. Result: a table of account, date and score with no information from the future.
- Backtest against what happened. For each snapshot, check whether the account churned inside the outcome window. Compare churn rates by band, the share of all churners caught in the at-risk band, how many days of warning the score gave, and how well it ranks churners above renewers. Result: a one-page verdict on whether the score predicts anything.
- Fix, attach actions and retest. Drop inputs that add nothing, adjust weights or bands, and write one action per band with an owner. Then retest on a later period the formula has not seen. Result: a score tied to actions, with a quarterly check on whether it still works.
Examples
A B2B software company with a thousand accounts
Illustrative arithmetic. On 1 January the company scores its accounts: 600 healthy, 250 watch, 150 at risk. By 30 June, 80 have churned: 16 healthy, 24 watch and 40 at risk. The at-risk band is a small slice of the base yet holds half of the churners, and the band rates rise in order, so the score ranks accounts usefully.
A payments platform for merchants
Illustrative. A fintech team scores merchants on monthly processed volume against the trailing three months, failed-payment share, integration depth and support tickets. The backtest shows that a volume drop turns red a median of six weeks before cancellation, while the support-ticket input moves churn rates no more than chance. The team drops tickets and gives the volume trend more weight.
A clinic network's membership program
Illustrative. A healthcare provider sells annual patient memberships and scores each one on visits booked, missed appointments, app logins and survey answers. The first backtest finds that members who have not booked within 60 days of joining churn at several times the rate of those who have, so the team adds an onboarding milestone to the score rather than waiting for a low survey answer.
When to use it
Use it when you have recurring customers, enough accounts that a person cannot watch each one, and usage data collected by date. It earns its keep in subscription software, payment platforms, memberships and managed services, where an account that looks quiet today may cancel at renewal.
When not to use it
Skip it with a few dozen accounts and one person who knows every customer; a spreadsheet of notes does the job. Skip it when there is no churn history to test against, because an untested score is a guess in a dashboard. For one-off purchases, use RFM analysis or a survey instead.
Common mistakes
- Treating the weights as settled because they look sensible. Weights are judgment until a backtest shows the score ranks past churners above past renewers.
- Backtesting with today's data. If you recompute old scores from current records, information from after the date leaks in and the score looks better than it is.
- Using one formula for every customer. A customer in month two and one in month twenty need different inputs, so build separate versions per segment or stage.
- Adding every available metric. Gainsight's own guide warns that data can add noise, and each extra input needs a reason you can test.
- Never recording what the score said. Without saved snapshots there is nothing to backtest next quarter.
FAQ
What is a good customer health score?
A good score is one whose bands match outcomes: the at-risk band churns at a much higher rate than the healthy band, and it flags accounts early enough to act. The number itself, 70 or 85, means nothing until you backtest it. Define good by the churn rates your own bands produce.
How do you calculate a customer health score?
Score each input on a common scale, multiply by its weight and add the results into one number. Gainsight scorecards work this way: each dimension is a measure, measures roll up into groups, and the scorecard score follows from them. Then map ranges to colors such as red, yellow and green.
How do you know if a health score is accurate?
Backtest it. Rebuild the score as it stood on past dates, then compare it with who actually churned in the following months. Check churn rate by band, the share of churners in the at-risk band, warning time and how well the score ranks churners above renewers, such as with AUC.
What is the difference between a health score and churn prediction?
A health score is usually built by people choosing inputs and weights, then read by customer success staff. A churn prediction model fits its weights to past outcomes with statistics. The two overlap: a model can suggest the weights for a health score, and backtesting applies to both.
How many inputs should a health score have?
There is no researched number. Five to eight is a common working range. Fewer inputs are easier to explain and test, and Gainsight warns that unselective data creates noise. Keep an input only if the backtest shows it changes who is flagged or how early.
Sources
- Gainsight (vendor), Essential considerations for your first customer scorecard
- Gainsight (vendor), Scorecards overview, support documentation
- Gainsight Community (vendor), How to use health score to reduce risk
- ChurnZero (vendor), Customer health scores
- ChurnZero (vendor), Customer health score dashboard
- ChurnZero (vendor), The customer health score handbook
- Scott A. Neslin, Sunil Gupta, Wagner Kamakura, Junxiang Lu, Charlotte Mason, Defection detection: measuring and understanding the predictive accuracy of customer churn models, Journal of Marketing Research 43(2), 2006
- Aurélie Lemmens, Christophe Croux, Bagging and boosting classification trees to predict churn, Journal of Marketing Research 43(2), 2006
- Wouter Verbeke, Karel Dejaeger, David Martens, Joon Hur, Bart Baesens, New insights into churn prediction in the telecommunication sector: a profit driven data mining approach, European Journal of Operational Research, 2012
- Eva Ascarza, Retention futility: targeting high-risk customers might be ineffective, Journal of Marketing Research 55(1), 2018
- Sunil Gupta, Valarie Zeithaml, Customer metrics and their impact on financial performance, Marketing Science 25(6), 2006
- Timothy L. Keiningham, Bruce Cooil, Tor Wallin Andreassen, Lerzan Aksoy, A longitudinal examination of Net Promoter and firm revenue growth, Journal of Marketing 71(3), 2007
- Robyn M. Dawes, The robust beauty of improper linear models in decision making, American Psychologist 34(7), 1979
- Shachar Kaufman, Saharon Rosset, Claudia Perlich, Ori Stitelman, Leakage in data mining, ACM Transactions on Knowledge Discovery from Data 6(4), 2012
- James A. Hanley, Barbara J. McNeil, The meaning and use of the area under a receiver operating characteristic (ROC) curve, Radiology 143(1), 1982
- Takaya Saito, Marc Rehmsmeier, The precision-recall plot is more informative than the ROC plot when evaluating binary classifiers on imbalanced datasets, PLOS ONE, 2015
- Glenn W. Brier, Verification of forecasts expressed in terms of probability, Monthly Weather Review 78(1), 1950
- Peter Peduzzi, John Concato, Elizabeth Kemper, Theodore R. Holford, Alvan R. Feinstein, A simulation study of the number of events per variable in logistic regression analysis, Journal of Clinical Epidemiology 49(12), 1996
- David R. Cox, Regression models and life-tables, Journal of the Royal Statistical Society B 34(2), 1972
- Peter S. Fader, Bruce G. S. Hardie, How to project customer retention, Journal of Interactive Marketing 21(1), 2007
- scikit-learn documentation, Probability calibration
- scikit-learn documentation, Metrics and scoring: quantifying the quality of predictions
- scikit-learn documentation, Cross-validation: evaluating estimator performance
- lifelines documentation, Introduction to survival analysis
Last updated Oct 9, 2026


Marketing agency or growth system: when a company outgrows its agency
An agency is the right call while the founder still runs most of the company. Once the business starts copying itself into new locations or markets, it needs a system that sets goals, tests hypotheses and owns the result.

Why healthcare marketing agencies stall: the short, mid and long wins model we use with clinics
Most agencies own the click and nobody owns the front desk. How we structure clinic work in three horizons, the research behind each one, and one year of results.

Why channel tests stall after month three
Most paid channel tests do not end with a decision. They end when the budget runs out, the attribution model changes, or everyone quietly stops looking at the dashboard.