Unit economics
Unit economics is the profit one unit of a business earns, such as a customer or an order, set against what it cost to win that unit, so a team can tell whether growth makes money or burns it.
Unit economics is the revenue and cost of one unit of a business, usually a customer or an order, shown as the contribution that unit earns after its variable costs and compared with the cost of acquiring it. It answers whether each new unit pays for itself, and how fast. Its core measures are contribution per unit, CAC, payback and LTV.
- Origin
- Management accounting and growth-finance practice; formalised in customer-valuation research by Sunil Gupta, Donald Lehmann and Jennifer Stuart, 2004 (academic formalisation)
- Level
- 201 · Tool
- Fits
- Startup, Small and mid-size, Scale-up
- Time to apply
- Half a day for a first model; a monthly refresh after that
- What you need
- one agreed definition of the unit: a paying customer, an order, a patient · revenue and variable cost per unit for the last 3 to 6 months · all acquisition spend, including salaries, by channel and by month · retention or repeat-purchase data for at least one cohort
Unit economics is the revenue and cost of one unit of a business, such as a customer, an order or a patient, shown as the profit that unit earns before shared overhead. If each new unit earns more than it cost to win, growth adds value. If it earns less, growth adds losses. The method is plain management accounting applied to growth, and it became a formal valuation tool in 2004, when Sunil Gupta, Donald Lehmann and Jennifer Stuart defined the value of a customer as the expected sum of discounted future earnings, based on retention and profit margin, and the value of all customers as determined by the acquisition rate and the cost of acquiring new customers.
How do you choose the unit?
The unit is the thing you win repeatedly and whose costs rise with each extra one. Pick the level where revenue and cost can both be counted without allocation tricks.
| Business | Common unit | Watch for |
|---|---|---|
| Subscription software | A paying account | Seats and plan changes inside the account |
| Online shop or marketplace seller | An order, then a customer | Returns and free shipping |
| Clinic | A new patient | Insurance delays, no-shows |
| Payments or fintech | An active merchant | Dormant accounts with no volume |
| Lending | A funded loan | Defaults arriving months later |
Start with the unit that matches how you acquire. If marketing buys customers, the customer is the unit and orders are a repeat pattern inside it. The subscription model makes the choice easy because the account renews on a schedule. Retail and clinics need a clear first-event rule, such as the first completed visit.
Contribution per unit
Contribution per unit is the price a unit pays minus every cost that rises with it. OpenStax defines it as selling price per unit minus variable cost per unit, and our page on contribution margin goes through the calculation.
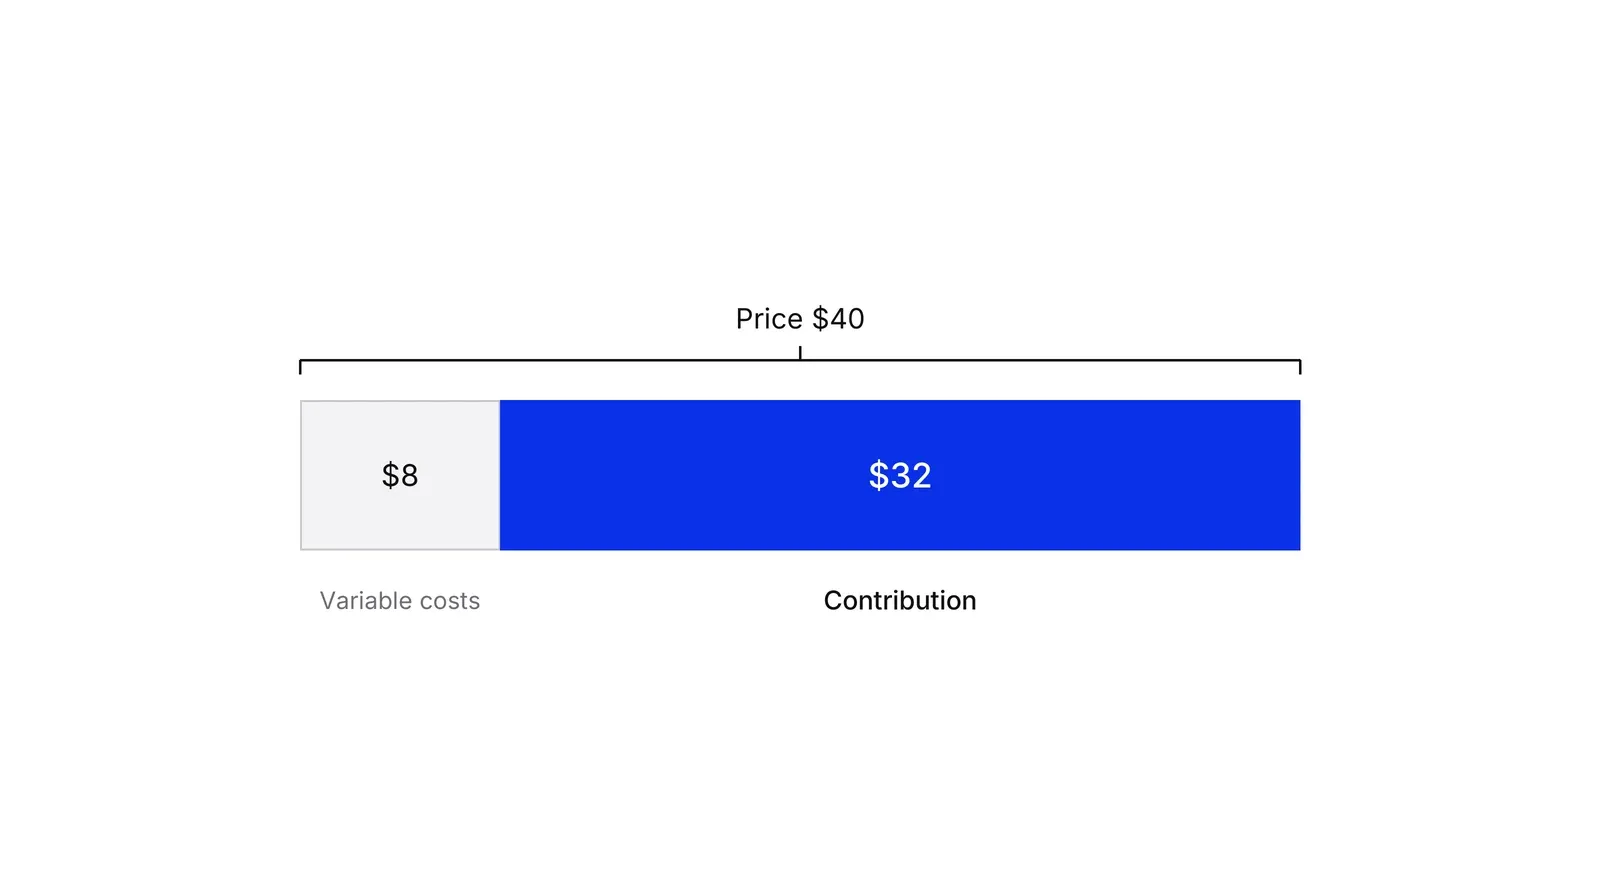
Andreessen Horowitz warns that measuring lifetime value on revenue or gross margin sets the ceiling on acquisition spend too high, and prefers contribution-margin LTV, with selling, administrative and operating costs of serving the customer counted as variable. The reason is simple: support time and refunds are real costs of keeping a unit.
CAC: the full cost of winning a unit
CAC, customer acquisition cost, is all spend that wins new units in a period divided by the new units won. The same a16z guide says it should be the full cost: referral fees, credits and discounts count too. Add sales and marketing salaries.
Two traps recur. First, blended CAC divides by every new customer, including organic ones. a16z notes that investors treat paid CAC as the more telling number, and Bill Gurley argued that marketers often divide spend by total customers, including those who would have come anyway. Second, CAC rises as you buy more reach, so measure it by channel and by month.
Accounting rules will not hand you CAC. Under US GAAP only incremental costs of obtaining a contract, such as sales commissions, are capitalised, and contracts amortised over a year or less may be expensed at once. Knowledge at Wharton reports that over 80% of Dish Network’s subscriber acquisition costs are expensed immediately. Build CAC from spend, not from the ledger.
Payback: how long a unit takes to repay CAC
Payback is the time a unit needs to earn back its acquisition cost: CAC divided by monthly contribution. In the example below that is 300 ÷ 32, or about 9.4 months. Churn lengthens it, because some customers leave before repaying. Adding up expected contribution month by month gives about 11.5 months.
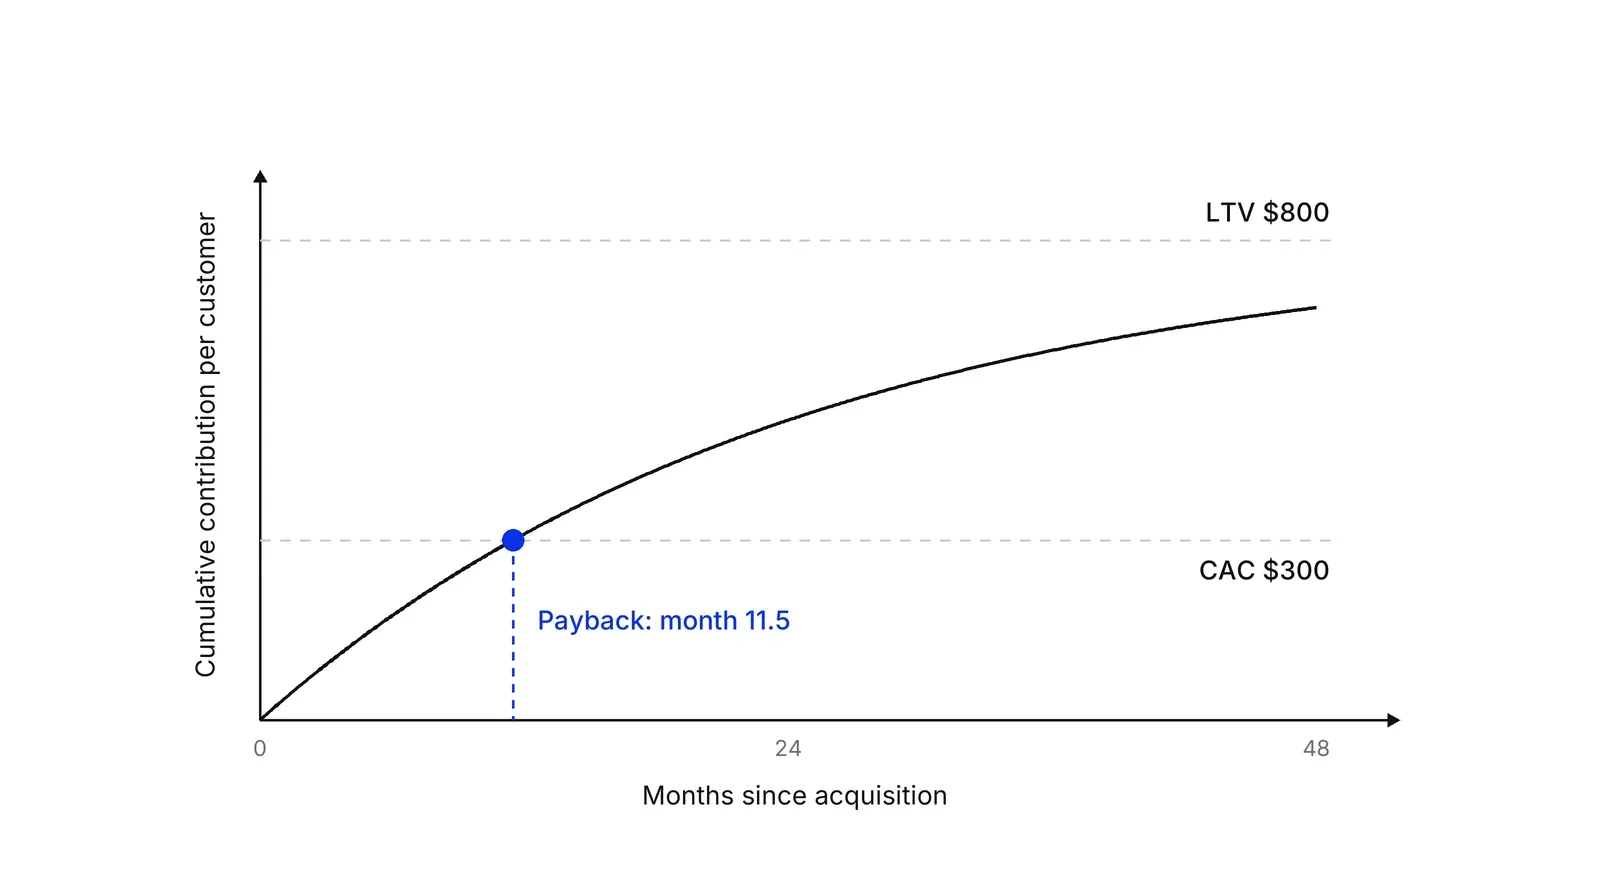
David Skok’s SaaS metrics guide says many of the best businesses recover CAC in 5 to 7 months, and calls recovery beyond 12 months a sign of thin profitability. He calls these guidelines, and notes that bigger companies with cheap capital can accept longer periods. Treat any benchmark as a starting question, not a verdict.
LTV: what a unit earns over its life
LTV, lifetime value, is the present value of the future net profit a customer brings. a16z gives the working formula as monthly contribution margin times average lifespan, where lifespan is 1 divided by monthly churn. At $32 contribution and 4% churn, lifespan is 25 months and LTV is $800. At 6% churn, it is $533.
The idea of treating customers as assets goes back at least to Robert Blattberg and John Deighton’s 1996 customer equity test, and Roland Rust, Katherine Lemon and Valarie Zeithaml built a customer equity framework in 2004 around lifetime value and contribution margin. Retention gets heavy weight in this tradition. HBR repeats the claim that winning a customer costs 5 to 25 times more than keeping one, while saying the multiple depends on the study and the industry. Gupta and colleagues compared levers in a five-company sample, and found that improving retention by 1% was likely to lift customer and firm value by 3 to 7%, against about 1% for margin and 0.02 to 0.3% for acquisition cost. Their sample was small and dated 2002, so read it as an illustration of why retention carries weight, not as a rule. Our pages on net revenue retention and growth accounting show how to track that retention, and cohort analysis shows how to read it by group.
Gurley’s 2012 critique lists what the formula hides: CAC that climbs as spend grows, churn that rises when you raise price, future costs left out, and the hope that “one day we can stop spending”. It also averages over customers who behave differently. McCarthy told Knowledge at Wharton that a valuation model must allow for customers being different from each other, and that treating every customer as average produced a much lower valuation of Dish than its trading price. Use cohorts rather than one blended churn rate whenever you have the data. Peter Fader, Bruce Hardie and Ka Lok Lee published a probability model for repeat buying in 2005 that predicts future purchases as an input to lifetime value and can be fitted in Microsoft Excel. In later work on retailers, the researchers found that purchase frequency plus the count of active customers predicted value best among six metrics they tested.
What the SEC expects when a company publishes these numbers
Public companies in the United States cannot publish a unit metric without explaining it. In a 2020 release (33-10751) the SEC said it would generally expect a clear definition of the metric and how it is calculated, why it is useful, and how management uses it. It also asks companies to consider disclosing the estimates behind a metric, and any change in how it is calculated, with the effect on prior periods.
Where a measure is a non-GAAP financial measure, Regulation G and Item 10(e) of Regulation S-K add a comparable GAAP measure with equal or greater prominence and a reconciliation. SEC staff interpretations say that a measure which excludes normal, recurring, cash operating expenses can be misleading. A “contribution” that leaves out support or payment costs invites exactly that question. Private firms are not bound by these rules, but they are a good checklist for any internal dashboard.
McCarthy and Fader showed what outsiders do with such disclosures. Using public data, they estimated Wayfair’s per-customer economics as described in Emory Business: the figures in the examples above. Metrics invite scrutiny once someone can recompute them.
A Growth Lab plan starts from a unit model like this one, so each channel gets a payback limit before budget moves.
How to apply Unit economics, step by step
- Fix the unit. Write one sentence that says what counts as a unit and when it begins: the first paid invoice, the first delivered order, the first completed visit. Keep one unit per model. Result: a definition finance and marketing both sign.
- Build contribution per unit. Take the price the unit pays, subtract every cost that rises with each extra unit: payment fees, delivery, refunds, support time, materials, partner payouts. Leave fixed overhead out. Result: a contribution figure per unit, per month or per order.
- Calculate fully loaded CAC. Add all spend that wins new units in a period (media, agency fees, sales salaries, commissions, discounts and credits) and divide by the new units won in that period. Compute it for paid channels separately from the blended figure. Result: one CAC for each channel and one blended.
- Find the payback. Divide CAC by contribution per month, then repeat the sum with churn built in, adding up expected contribution month by month until it reaches CAC. Result: the number of months before a new unit has repaid its acquisition cost.
- Estimate LTV from a cohort. Multiply monthly contribution by the expected lifetime, which is 1 divided by monthly churn when churn is steady. Check the result against what real cohorts have paid so far. Result: an LTV you can defend, with the assumptions written next to it.
- Compare, then set a rule. Put LTV, CAC and payback side by side and decide the limits you will accept, for example a maximum payback in months. Review them every month and after any change in price, channel or churn. Result: a go or no-go rule for each channel.
Examples
A subscription app (illustrative)
The price is $40 a month. Payment fees, hosting and support cost $8, so contribution is $32. Paid CAC is $300. Without churn, payback is 300 ÷ 32, about 9.4 months. With 4% monthly churn the expected lifetime is 25 months, so LTV is $800 and LTV to CAC is 2.7. Counting churn month by month, payback stretches to about 11.5 months. At 6% churn, LTV drops to about $533.
A dental clinic (illustrative)
The unit is a new patient. In the first year the patient brings $600 of revenue and $360 of variable cost: materials, lab fees, hygienist time paid per visit and card fees. Contribution is $240. Ads and the call-handling time used to book the patient add up to $150, so the clinic recovers acquisition cost inside the first year. The dentist's salary stays out of the unit, because it does not rise with one more patient.
Wayfair and Overstock, as estimated by outside researchers
Daniel McCarthy and Peter Fader built customer-based valuations of both retailers from public data. As reported by Emory Business, they estimated Wayfair spent about $69 to acquire a new customer and earned about $59 from that customer afterwards, while Overstock earned about $10 per new customer. These are researchers' estimates, not company-reported figures.
When to use it
Use it before scaling paid acquisition, when you set prices, when you plan a new channel or market, and whenever revenue is growing but cash is not. It suits any business with a repeatable unit: subscriptions, orders, patients, merchants, loans.
When not to use it
Skip it for a product with no repeat pattern yet and fewer than a few dozen units, where any average is noise. It also cannot replace a full P&L: fixed costs, financing and one-off projects sit outside the unit. For a business with a handful of very large deals, model each deal rather than an average.
Common mistakes
- Using gross margin instead of contribution. Gross margin leaves out support, payment fees and refunds, so LTV looks higher than the unit really earns. Build contribution from every variable cost.
- Dividing acquisition spend by all new customers, including those who would have come anyway. Bill Gurley warned of this in 2012. Track paid CAC next to the blended figure.
- Treating LTV as revenue over a guessed lifetime. Discount the future, net out variable costs and cap the horizon at what cohorts have shown.
- Mixing units: counting CAC per customer but contribution per order. Every figure must use the unit you defined in step one.
- Reading the accounting ledger as CAC. Under US GAAP only incremental costs of obtaining a contract are capitalised, so ledger lines will not match the cost of winning a unit.
FAQ
How do you calculate unit economics?
Choose the unit, then compute contribution per unit (price minus variable costs), CAC (all acquisition spend divided by new units), payback (CAC divided by monthly contribution) and LTV (monthly contribution times expected lifetime). Compare them. A unit is healthy when it repays CAC quickly and LTV is clearly above CAC.
What is a good LTV to CAC ratio?
Sources differ. David Skok called a ratio above 3 typical for the best SaaS businesses, and treated payback beyond 12 months as a warning. He called both guidelines, not rules. A lower ratio can work with cheap capital and low churn, a higher one can hide underinvestment in growth.
How do marketplace sellers work out unit economics?
Take one order or one product listing as the unit. Subtract the marketplace commission, logistics, packaging, returns, ad spend per order and payment costs from the sale price. What remains is contribution per order. Repeat the sum per product, because a single average hides items that lose money.
Is unit economics the same as contribution margin?
No. Contribution margin is one input: what a unit earns after variable costs. Unit economics adds the cost of acquiring the unit and the time it stays, then judges whether the sum pays. It uses contribution margin, CAC, payback and LTV together.
Why do unit economics matter to investors?
They show whether growth creates value. Gupta, Lehmann and Stuart showed in 2004 that customer value, built from retention, margin and acquisition cost, can be linked to firm value, including for firms with negative earnings. McCarthy and Fader later used the same logic to value public companies.
Sources
- Sunil Gupta, Donald R. Lehmann, Jennifer Ames Stuart, Valuing Customers, Journal of Marketing Research 41(1), 2004 (Columbia Business School copy)
- Daniel McCarthy, Peter Fader, Bruce Hardie, Valuing Subscription-Based Businesses Using Publicly Disclosed Customer Data, Journal of Marketing 81(1), 2017, London Business School repository
- Knowledge at Wharton, Why your business really is only as valuable as your customers
- Knowledge at Wharton, article on McCarthy and Fader's valuation of Wayfair and Overstock
- Knowledge at Wharton, Customer behavior and company value
- Emory Business, Think you don't need scholarly research to run a business? Think again, 2019
- Peter Fader, Bruce Hardie, Ka Lok Lee, Counting Your Customers the Easy Way, Marketing Science 24(2), 2005
- U.S. Securities and Exchange Commission, Commission Guidance on Key Performance Indicators and Metrics in MD&A, Release 33-10751, 2020
- U.S. Securities and Exchange Commission, Non-GAAP Financial Measures: Compliance and Disclosure Interpretations
- Cornell Legal Information Institute, 17 CFR 244.100 (Regulation G, Rule 100)
- Cornell Legal Information Institute, 17 CFR 229.10 (Regulation S-K, Item 10)
- PwC Viewpoint, FASB Transition Resource Group: incremental costs of obtaining a contract
- Bill Gurley, The Dangerous Seduction of the Lifetime Value (LTV) Formula, Above the Crowd, 2012
- Bill Gurley, All Revenue Is Not Created Equal, Above the Crowd, 2011
- Andreessen Horowitz, 16 Startup Metrics
- David Skok, SaaS Metrics 2.0, For Entrepreneurs
- Harvard Business Review, Amy Gallo, The Value of Keeping the Right Customers, 2014
- Harvard Business Review, Robert Blattberg, John Deighton, Manage Marketing by the Customer Equity Test, 1996
- Harvard Business Review, Amy Gallo, Contribution Margin: What It Is, How to Calculate It, and Why You Need It, 2017
- OpenStax, Principles of Accounting Volume 2: Managerial Accounting, section 3.1, contribution margin
- Roland Rust, Katherine Lemon, Valarie Zeithaml, Return on Marketing: Using Customer Equity to Focus Marketing Strategy, Journal of Marketing 68(1), 2004, Erasmus University repository
Last updated Oct 9, 2026


How to calculate channel payback and unit economics
A CAC number that only marketing believes will not survive a finance review. This guide calculates channel payback so both teams work from the same model.

Fractional CFO vs finance operations: which gap do you actually have
A fractional CFO is a person. Finance operations is a system. Companies searching for one are often missing the other, or both.