Bow-tie model
The bow-tie model draws the customer journey of a recurring-revenue business as two funnels joined at the signature, so acquisition and everything after the sale (onboarding, impact, expansion) are measured as one system.
The bow-tie model is a revenue framework from Winning by Design that draws the customer journey as two funnels joined at the moment of commitment: acquisition on the left, onboarding, impact and expansion on the right. It is built for subscription businesses, where most of a customer's value arrives after the contract is signed, and gives both halves the same stages and metrics.
- Origin
- Martin Collings (airline bow tie); Jacco van der Kooij, Winning by Design (recurring-revenue version), 2009 for the travel original; current Bowtie Standard published January 2026
- Level
- 301 · Advanced
- Fits
- Scale-up
- Time to apply
- Half a day to define the stages, then one reporting cycle to see the first numbers
- What you need
- CRM data on leads, opportunities and closed deals · billing or product data on onboarding, renewals and upgrades · one owner each from marketing, sales and customer success
The bow-tie model is a way of drawing the customer journey as two funnels joined at a knot. The left funnel covers how a buyer becomes a customer: Awareness, Education and Selection. The knot is Commit, the moment the contract is signed. The right funnel covers what comes next: Onboard, Impact and Expansion. Winning by Design (WbD), the revenue consultancy founded by Jacco van der Kooij, presents it as a replacement for a funnel that stops at the sale. It is built for subscription and other recurring-revenue businesses, where the signature starts the revenue instead of finishing the job.
Where does the bow-tie model come from?
The picture came from travel before it reached software. Martin Collings, who wrote a blog on airline direct sales, drew a bow tie in an April 2009 post on his Shearwater blog. His knot was the ticket purchase, and the right wing was the weeks between booking and departure, when an airline can still sell a seat upgrade, a hotel or a rental car. A follow-up post argued that spend returns more on the right side than the left. The market he pointed at has grown: IdeaWorksCompany estimates that ancillary sales made up 15.7% of global airline revenue in 2025, up from 9.1% in 2016.
WbD’s own article on funnels says the model comes from the travel industry and dates to 2009. Its pages do not say when the software version first appeared. The firm now treats it as the data model inside its Revenue Architecture system, which lists six models and has been a book by van der Kooij since 2023, according to the Google Books record. A 2023 update added five go-to-market motions, from no touch to dedicated touch, and a benchmark set covering more than 300 companies.
What are the stages?
There are seven, and Commit belongs to both sides. WbD’s page splits them between acquisition (marketing and sales) and retention and growth (customer success).
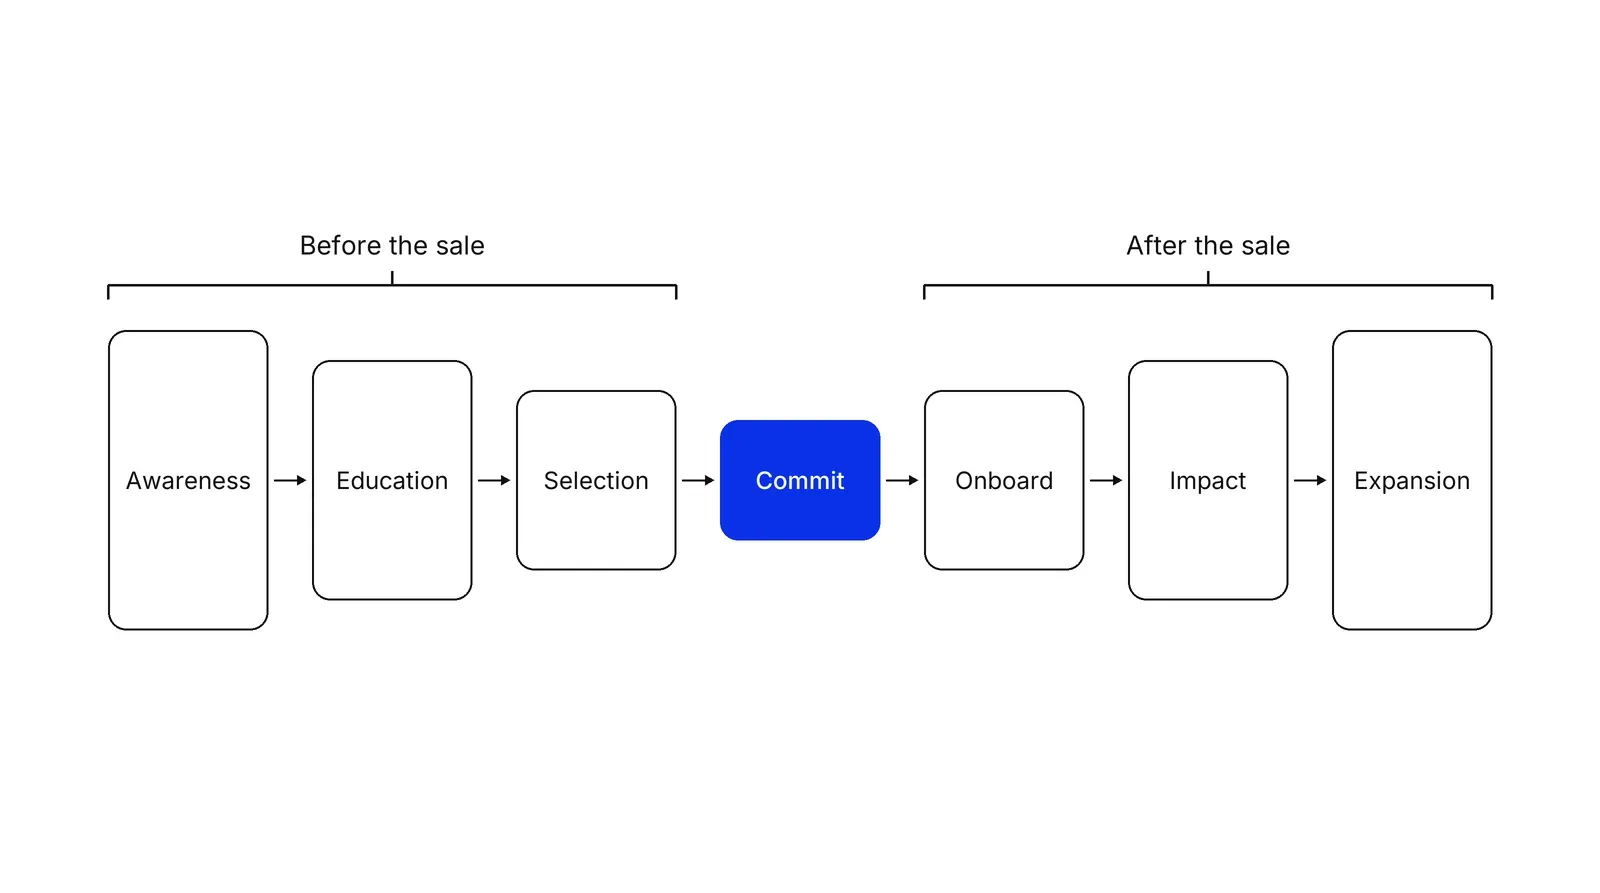
| Stage | What happens, per WbD |
|---|---|
| Awareness | Buyers recognize a problem and learn that a solution exists |
| Education | Buyers learn about the problem and explore solutions |
| Selection | Buyers compare options, check fit and decide what to buy |
| Commit | The prospect becomes a customer and delivery is set to begin |
| Onboard | The customer is activated, trained and guided to a first outcome |
| Impact | The customer sees measurable value |
| Expansion | The customer grows through more usage, extra products or renewals |
Stage names have moved between versions and write-ups. Funnel.io describes the right side as renewal and growth stages, while WbD’s current page folds renewals into Expansion. WbD’s customer success blueprint calls first impact “the true end of onboarding” and a leading indicator of retention, which is why Impact has its own box.
Why does the right side get half the picture?
Because in a recurring contract, most of the money arrives after the signature. Take a $24,000 first-year contract that renews for five years and grows 10% a year (illustrative arithmetic, the same compounding Tunguz uses). Five-year revenue is about $146,500, and the first year is about 16% of it. The rest depends on onboarding, impact and renewal going well.
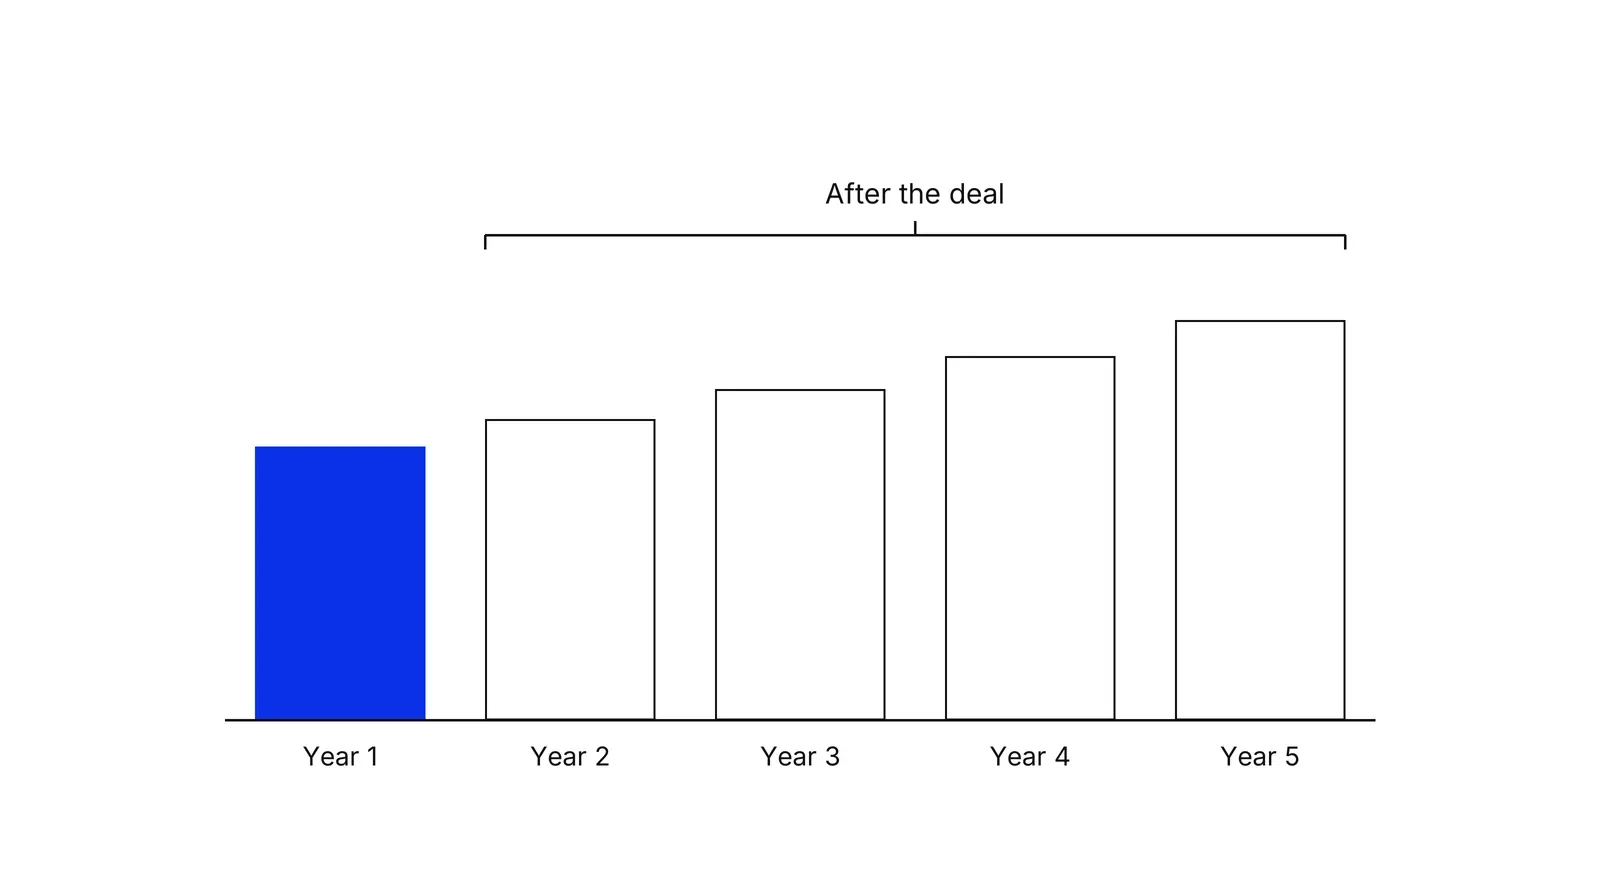
WbD goes further and claims 72 to 93% of lifetime value arrives after the first deal, with no method shown, so treat that range as the firm’s estimate. Independent data point the same way without proving it. SaaS Capital’s 2025 survey of more than 1,000 private B2B SaaS companies found median growth of 15% where net revenue retention was below 90% and 50% where it was above 130%, a correlation, not a cause. Gupta, Lehmann and Stuart’s Journal of Marketing Research paper estimates that a 1% gain in retention lifts firm value by 3% to 7%. David Skok shows a cohort in which expansion outweighs cancellations reaching $450k, against $140k at 3% churn.
The older retention claims vary with the telling. Bain’s summary of Reichheld and Sasser’s 1990 article says 5% more retained customers can raise profits by almost 100%, while HBR’s 2014 piece quotes a range of 25% to 95%. Both come from service businesses in a different era.
What do you measure on each side?
WbD’s Bowtie Standard measures volume, conversion and velocity at every stage. Volume is how many accounts enter, conversion is the share that move on, and velocity is the days between stages. The left side will look familiar from any funnel. The right side adds time to first impact, then revenue measures: net revenue retention for the whole base, and growth accounting to split movement into new, expanded, contracted and lost revenue. Tomasz Tunguz shows why the gap matters: a company at 160% net dollar retention ends up about 4.2 times larger in five years than one at 120%.
WbD’s page also lists results for teams using the model, including a 50% shorter sales cycle and a 298% rise in wins, without naming a sample or a period. Read those as marketing claims.
How is it different from a funnel and from LAER?
A funnel ends at the purchase; the bow tie keeps counting. AIDA, which WbD dates to 1898, plans what to say before the sale. Customer lifecycle marketing times messages to a customer’s stage. Customer success is the function that mostly owns the right wing.
| Model | Covers | Built for |
|---|---|---|
| AIDA funnel | Attention to purchase | Planning pre-sale messages |
| Bow tie | Awareness through expansion, one data model | Recurring-revenue businesses with several teams |
| LAER (Land, Adopt, Expand, Renew) | After the first sale | Services teams, per TSIA |
Is it the same as bow-tie analysis?
No. Bow-tie analysis is a process-safety method. A hazard and its top event sit at the centre, threats and preventive barriers on one side, consequences and mitigating barriers on the other, as the IChemE paper on the CCPS and Energy Institute guidance sets out. It shares the shape and nothing else with the revenue model.
What are the limits?
The results claimed for the model come from its maker, and we found no independent study testing it. It needs billing or product data that most CRMs do not hold. A business with one-off sales has no right wing to draw. For a team that does have renewals, a Growth Lab plan starts from the stage with the biggest drop in its own bow-tie table.
How to apply Bow-tie model, step by step
- Define the seven stages in your own words. Write one sentence for each of Awareness, Education, Selection, Commit, Onboard, Impact and Expansion, using what your buyers actually do. Result: a shared vocabulary that marketing, sales and customer success all use.
- Write an exit rule for every stage. A customer leaves a stage only when something checkable happens: a booked demo, a signed order form, a first live payment. Result: a stage count nobody can argue with.
- Fix the knot where delivery starts. Place Commit at the point where the contract is signed and the work of delivering the promised result begins. Result: a clear line for handing the account from sales to the team that delivers.
- Define first impact. Agree what a new customer would call the first proof that the product works, and measure the days from Commit to that moment. Result: one number that predicts whether onboarding is working.
- Pull volume, conversion and velocity for each stage. Count how many accounts enter each stage, what share move on, and how many days they take. Result: a table with seven rows and three columns.
- Add renewal and expansion revenue to the same table. Put gross and net revenue retention on the right side, using your billing data. Result: the right side is measured in money, like the left.
- Pick the weakest stage and test one change. Choose the stage with the largest drop or the slowest velocity, write one hypothesis, and review the table monthly with all three teams. Result: one experiment owned by the people who feel the problem.
Examples
A scheduling tool for clinics
Illustrative. A vendor closes 50 clinics in a quarter (Commit). Dashboards show 35 reach first impact, meaning their first full week of online bookings, within 60 days. That is 70%, so 15 clinics are already at risk before their first renewal. The sales team has hit its target and sees nothing wrong. The bow-tie table shows the leak sits in Onboard, so the next experiment is a guided setup call in week one, owned by customer success.
A B2B payments platform
Illustrative. Commit is a signed merchant agreement, but no revenue exists until the merchant passes verification and processes a live payment. If 100 merchants sign and 60 go live within 30 days, the first impact rate is 60% and the average wait is a metric in its own right. Expansion means more processed volume or a second payment method. A funnel that ends at the signature would report all 100 as wins.
A clinic with an annual membership plan
Illustrative. A private clinic sells 300 annual memberships. If 70% renew, 210 members return before any upgrades, and the other 90 have to be replaced just to stand still. Treating the first visit as first impact, and tracking days from purchase to that visit, shows which members are likely to lapse months before the renewal date.
When to use it
Use it when revenue repeats: subscriptions, memberships, usage-based contracts or retainers, and when marketing, sales and customer success report different numbers for the same customers. It suits companies that have outgrown a single funnel and need one data model across acquisition and retention.
When not to use it
Skip it for one-off purchases with no renewal or upsell, where a classic funnel is enough. Skip it in a company too early to have renewals to measure. A team with no billing or product data cannot fill the right side, and drawing the picture without numbers changes nothing.
Common mistakes
- Stopping the table at Commit. The right side is the reason for the model, and a bow tie with only a left wing is a funnel.
- Letting every team define stages differently. If sales counts a signature as a win and customer success counts first impact, the handoff gap stays hidden.
- Reporting only totals. Volume without conversion and velocity cannot tell you which stage is leaking.
- Treating vendor benchmarks as targets. The figures published for the model give no sample or period, so compare against your own previous quarters.
- Confusing it with bow-tie analysis from process safety, a different method that shares only the shape.
FAQ
What is the bow-tie model in sales?
It is a customer-journey framework from Winning by Design that joins two funnels at the signature. The left funnel covers Awareness, Education and Selection; the right covers Onboard, Impact and Expansion. It is meant for recurring-revenue companies, where retention and growth after the sale matter as much as winning the deal.
Who created the bow-tie model?
The shape was first described for airlines by Martin Collings, in a 2009 blog post. Jacco van der Kooij and Winning by Design adapted it to recurring-revenue software, and the firm's own article says the model comes from travel. Winning by Design's pages do not give a year for the first software version.
What are the stages of the bow-tie model?
Winning by Design's current page lists seven: Awareness, Education, Selection, Commit, Onboard, Impact and Expansion, with Commit shared by both sides. Older and third-party descriptions use labels such as Adoption and Renewal for the right side, so check which version a team means.
How do you measure the bow-tie model?
Winning by Design's Bowtie Standard uses volume, conversion and velocity at each stage: how many accounts enter, what share move on, and how many days they take. On the right side, add time to first impact, gross and net revenue retention, and expansion revenue.
Is the bow-tie model the same as bow-tie analysis?
No. Bow-tie analysis is a risk method used in process safety, with a hazard and a top event at the centre, threats and preventive barriers on one side, consequences and mitigating barriers on the other. It shares the shape and nothing else with the revenue model.
Sources
- Winning by Design, The Modern Sales Funnel (the Bowtie)
- Winning by Design, The Bowtie Standard, January 2026
- Winning by Design, press release: Updated Bowtie Model and Benchmarks, October 2023
- Winning by Design, Revenue Architecture, the GTM operating system
- Winning by Design, The Operating Model for Recurring Revenue, June 2022
- Winning by Design, The SaaS Sales Method
- Winning by Design, Frameworks that govern B2B marketing and sales, and why SaaS needs its own framework
- Winning by Design, Customer Success Operating Model blueprint, October 2022
- Jacco van der Kooij, Revenue Architecture, Winning by Design, 2023 (Google Books record)
- Martin Collings, Birth of the Bow Tie, Shearwater Blog, April 2009
- Martin Collings, Updated Bow Tie and Lead Time Numbers, Shearwater Blog, May 2009
- IdeaWorksCompany, Global Estimate of Ancillary Revenue 2025, press release, November 2025
- TSIA, LAER: The Roadmap for Revenue Growth, 2019
- SaaS Capital, Research Brief 32: 2025 B2B SaaS Retention Benchmarks
- Sunil Gupta, Donald Lehmann, Jennifer Ames Stuart, Valuing Customers, Journal of Marketing Research, 2004
- Frederick Reichheld, W. Earl Sasser, Zero defections: quality comes to services, Harvard Business Review, 1990 (Bain summary)
- Amy Gallo, The Value of Keeping the Right Customers, Harvard Business Review, 2014
- David Skok, SaaS Metrics 2.0, For Entrepreneurs
- Tomasz Tunguz, How much is 20% more NDR worth to your SaaS startup?
- Funnel.io, The modern sales funnel (bowtie funnel)
- Revenue Flow, Winning by Design's sales methodology: SPICED and the Bowtie
- Martin Johnson, Mark Manton, Charles Cowley, Mark Scanlon, Bow ties in risk management: using the new CCPS-EI book to avoid pitfalls, IChemE Hazards 28, 2018
Last updated Oct 9, 2026


Marketing agency or growth system: when a company outgrows its agency
An agency is the right call while the founder still runs most of the company. Once the business starts copying itself into new locations or markets, it needs a system that sets goals, tests hypotheses and owns the result.

Why healthcare marketing agencies stall: the short, mid and long wins model we use with clinics
Most agencies own the click and nobody owns the front desk. How we structure clinic work in three horizons, the research behind each one, and one year of results.

Why channel tests stall after month three
Most paid channel tests do not end with a decision. They end when the budget runs out, the attribution model changes, or everyone quietly stops looking at the dashboard.