Unified marketing measurement
Unified marketing measurement runs marketing mix modeling, attribution and incrementality experiments as one system, with clear jobs for each and experiments used to correct the other two.
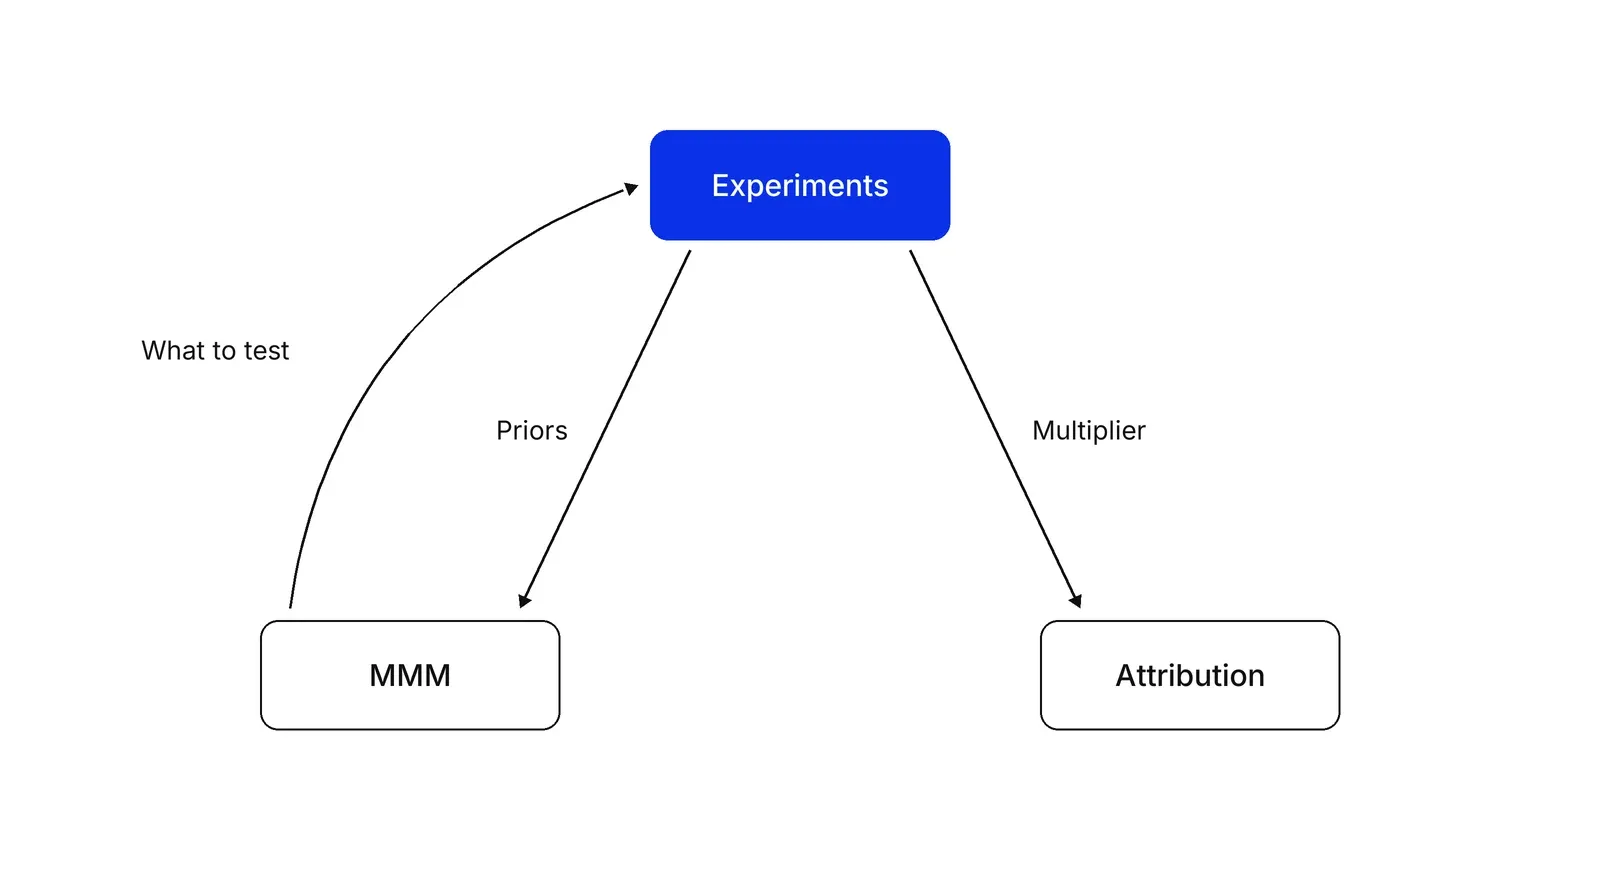
Unified marketing measurement is a way of running three methods together: marketing mix modeling (MMM) for budget splits across channels, attribution for daily campaign decisions, and incrementality experiments as the causal check. Experiment results calibrate the other two, for example as priors in the MMM or as multipliers on attributed return. The tools stay separate, and the aim is decisions that do not contradict each other.
- Origin
- Practice with no single inventor; set out in Google's Modern Measurement playbook and in the calibration features of Meridian, Robyn and PyMC-Marketing, No single date; Google playbook, 2024 edition
- Level
- 401 · Expert
- Fits
- Enterprise
- Time to apply
- one week to assign decision rights and compare numbers; six to twelve months to run the first calibration cycle
- What you need
- an attribution report you already use for campaign decisions · at least one incrementality experiment, ideally a geo experiment, on a large channel · two years of weekly data per channel if you plan to build or buy an MMM · an analyst who owns the comparison and a budget owner who agrees to act on it
Unified marketing measurement is a way of running three methods as one system. Marketing mix modeling (MMM) estimates each channel’s contribution from weekly totals. Attribution, often multi-touch attribution (MTA), splits credit for tracked conversions across the ads a person touched. Incrementality experiments compare people or regions that saw ads with ones that did not. Each method gets the decisions it handles best, and experiments are used to correct the other two.
No one invented it. Google’s 2024 Modern Measurement playbook puts the premise in one line: “No single tool has all the answers any more.” Google calls the combined approach modern measurement; vendors say unified measurement or triangulation. The users are large advertisers whose finance and marketing teams quote different returns for the same budget.
Why does one method fail on its own?
Each method has a blind spot the others can see. Attribution sees only what it tracks. Google’s data-driven attribution works on interactions with Google ads, and since iOS 14.5 Apple requires permission before an app tracks people across other companies’ apps for ad measurement. Attribution also credits sales that would have happened anyway.
An MMM sees every channel, offline included, but it learns from correlations in past spend and, per Google’s playbook, needs at least two years of history. Google researchers David Chan and Mike Perry wrote in 2017 about the difficulty of getting valid answers from such models. Experiments are causal but narrow and noisy: Lewis and Rao found a median confidence interval on return over 100 percentage points wide across 25 large tests with $2.8 million of spend. The marketing mix modeling page compares the three in a table; this page is about running them together.
Triangulation: read the three numbers as bounds
Triangulation means comparing estimates whose errors come from different places. Epidemiologists Lawlor, Tilling and Davey Smith define it as combining approaches with different and largely unrelated sources of bias. If methods that fail in different ways agree, the answer is more likely right.
Google’s playbook turns this into a rule for click-based digital channels. Attribution gives the generous view, the upper bound. An incrementality experiment gives the most conservative view, the lower bound. The MMM’s estimate should fall between them.
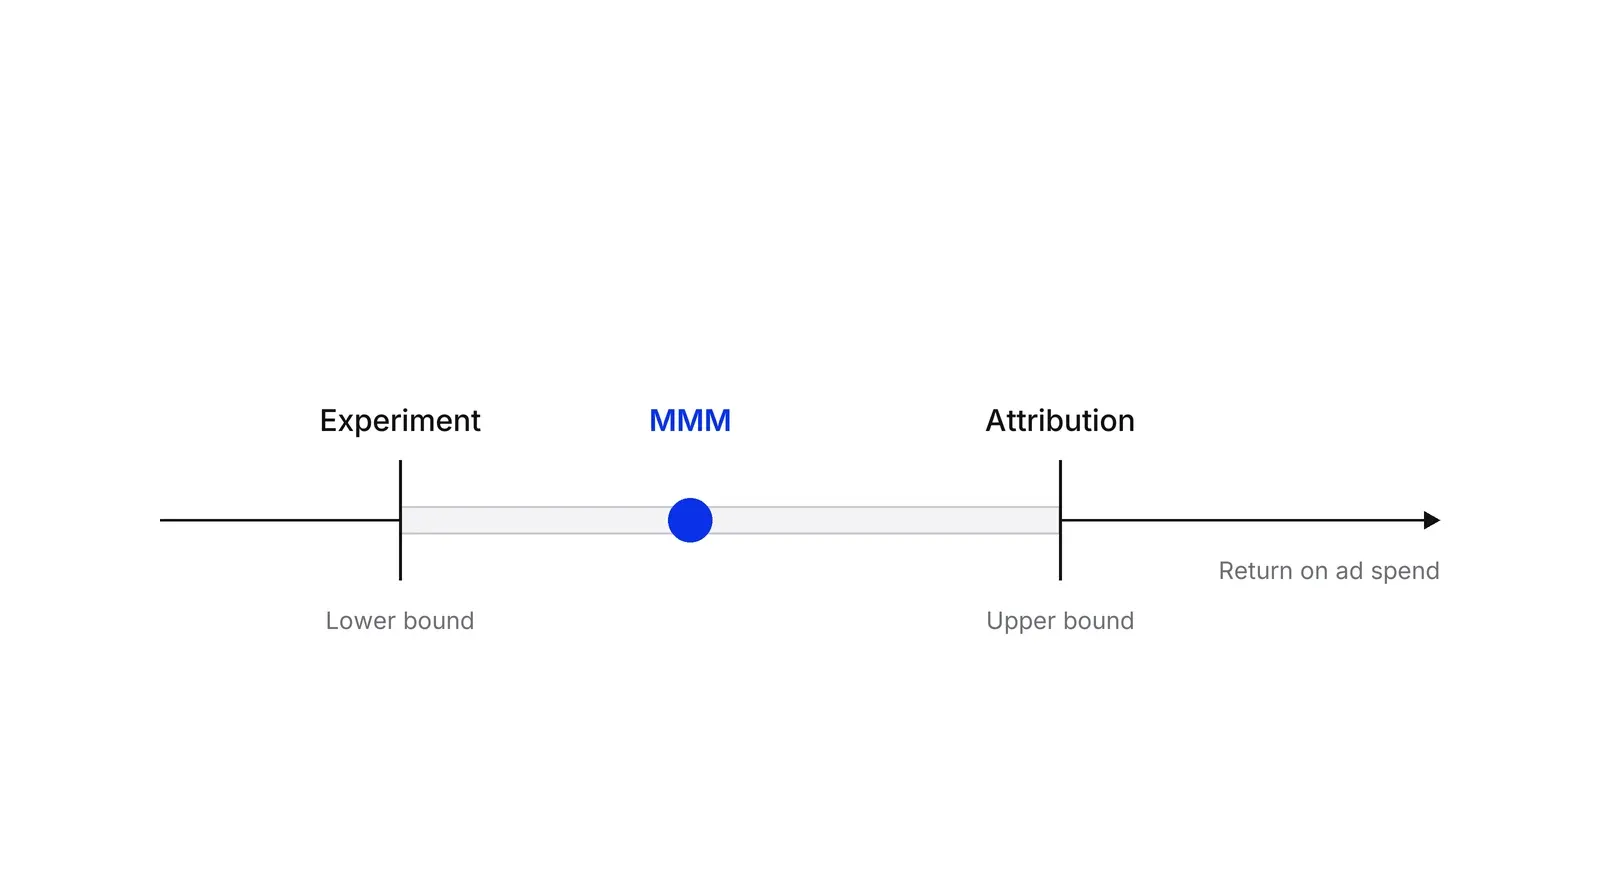
When a number falls outside the range, something is set up wrong: conversion tracking, model assumptions or the test itself. The same logic filters model versions. If an MMM version claims a lower incremental cost per acquisition than the attributed cost for a click channel, the playbook says to discard that version, because an incremental figure should not beat the generous one.
Who decides what
A unified system starts with decision rights: which tool settles which question. The playbook’s cadence and roles fit in one table.
| Decision | Main tool | Typical cadence | Checked by |
|---|---|---|---|
| Budget split across channels | MMM | One to four times a year | Experiments on the largest channels |
| Bids, creatives, audiences inside a channel | Attribution | Daily | Calibration multipliers from experiments |
| Does this channel cause sales at all | Experiment | Quarterly | Repeat tests every three to six months |
The playbook warns against chasing one merged figure. Forcing the model, attribution and experiments to agree means imposing strong assumptions, which makes each number less accurate. It also notes that two tools used well beat three used without a clear purpose.
Calibrating attribution with experiments
A calibration multiplier converts attributed return into estimated incremental return. You divide the return measured in an experiment by the attributed return for the same campaigns and weeks, then apply that ratio between tests. In Google’s worked example, a channel with attributed return of 5 and experiment return of 3.5 gets a multiplier of 0.7. A second channel at 5.5 attributed and 3 measured gets 0.54, so it drops behind the first despite the higher attributed figure.
The playbook adds guardrails. Prefer geo experiments, such as Google’s design by Vaver and Koehler or Meta’s GeoLift, and use the same design across channels so results compare. When a multiplier looks extreme, move only part of the way and retest before acting on it in full. Change bid targets by no more than 20% at a time, and refresh multipliers every three to six months. Platform tools such as Google Conversion Lift and Meta lift studies supply the inputs where access is available.
Calibrating the MMM with experiments
Experiments fix what a model cannot learn from history, for example two channels whose spend always rose together. Meridian, Robyn and PyMC-Marketing, the three main open-source tools, take experiment results in different forms.
| Tool | How an experiment enters | What to watch |
|---|---|---|
| Google Meridian | As a prior on a channel’s return on investment | Adjusted for spend level, test length and age of the test |
| Meta Robyn | As a calibration error the model minimises | Weighted against fit and a spend-share penalty |
| PyMC-Marketing | As an extra observation on the saturation curve | Needs spend before the test, spend change, lift and its error |
Meridian’s documentation calls incrementality experiments perhaps the strongest basis for priors, while warning that no fixed formula translates one into the other. Its calibration builder widens the prior for older tests, using a 52-week half-life, and for tests run at spend levels unlike the channel’s usual spend. A 2024 Google paper by Zhang and colleagues explains the idea: rewrite the model so return on ad spend is itself a parameter, then set its prior from the experiment.
Robyn treats experiments as ground truth and optimises three errors together: fit to sales, a business error called DECOMP.RSSD and a calibration error called MAPE.LIFT. By default the three weights are equal, set to 1, 1 and 1. The Robyn paper explains that DECOMP.RSSD measures the distance between each channel’s share of effect and its share of spend. It is a preference for results close to the status quo, so treat it as a judgment call that a test can overrule. PyMC-Marketing reads each lift test as two points on a channel’s response curve.
Google’s playbook gives a working threshold. If a refreshed model and a comparable experiment differ by less than about 10%, no action is needed. Above 10%, calibrate. For model-driven budget moves, the playbook suggests shifting at most 20% of a channel’s spend at a time and testing any change above 10%. Keep old experiments too: Uber’s team found that a model using all past tests predicted a held-out experiment better than one using only the latest test.
Where unified measurement goes wrong
The usual failure is false precision. Experiments carry wide intervals, so compare intervals rather than point estimates. Observational shortcuts do not replace tests: in 663 Facebook experiments, the errors of non-experimental estimates were larger than the lifts being measured. The incrementality testing page covers how to design and size a test that holds up.
The second failure is a calendar problem. Experiments run on one channel at a time, while budgets are set for all channels at once. Map the dates when budgets are decided and schedule tests to finish before them. Pushers’ Growth Lab runs this kind of calendar as HADI loops, one hypothesis and one test at a time.
How to apply Unified marketing measurement, step by step
- Assign decision rights. Write down which tool decides what. Typical split: the MMM sets the budget across channels once or twice a year, attribution moves money between campaigns, audiences and creatives inside a channel, experiments settle disputes about whether a channel works at all. Result: a one-page table that ends arguments over whose number wins.
- Put the numbers side by side. For each large channel, list attributed return, experiment return (if any) and MMM return for the same period and the same outcome. Check that the MMM sits between the experiment and attribution for click-based channels. Result: a list of channels where the tools agree and a short list where they clash.
- Plan experiments where the doubt is largest. Start with the channels whose MMM estimate has the widest range, the ones where tools clash, and brand search, which models handle badly. Use the same design, ideally geo experiments, across channels so results can be compared. Result: a test calendar for the next four quarters.
- Calibrate attribution. Divide the return measured in each experiment by the attributed return for the same campaigns and weeks. Apply that multiplier to attribution reports between tests, and refresh it every three to six months. Result: daily reports that speak in incremental terms.
- Calibrate the MMM. Feed each experiment into the model in the form its tool expects: ROI priors in Meridian, calibration input in Robyn, lift-test rows in PyMC-Marketing. If the refreshed model and a new experiment differ by more than about 10%, calibrate again. Result: a model whose channel estimates rest on measured effects.
- Move budget in steps and retest. Shift a channel's spend in small steps on model advice, and confirm larger moves with an experiment. Result: a budget that changes in measured steps, and a reason for the next test.
Examples
Google's calibration multiplier example
Google's 2024 playbook shows three channels with attributed returns of 5, 5.5 and 8 and geo experiment returns of 3.5, 3 and 12. The multipliers are 0.7, 0.54 and 1.5. Channel 2 looked better than Channel 1 in attribution; after calibration Channel 1 is ahead. Channel 3, which attribution under-credited, turns out to be the strongest of the three.
Uber's test of old and new experiments
Three Uber researchers built a Bayesian model that takes experiments as priors. In one check, the newest experiment for a paid channel was held out as the truth, with an attribution figure of 1,147 (the paper gives no units). A model using only the previous experiment estimated 1,311. A model using all older experiments estimated 1,240, closer to the truth. The authors conclude that older tests still add value.
A payments app reconciling three numbers
Illustrative, no real company implied. A payments app sees an attributed cost of 40 per funded account on paid social, an MMM estimate of 70, and a geo experiment result of 95 for the same quarter. The MMM sits between the bounds, so the team keeps it, sets a multiplier of 40 / 95, about 0.42, on attributed accounts, and uses 95 as the planning cost until the next test.
When to use it
Use it when you spend in several channels, at least one of them offline or poorly tracked, and different teams quote different returns for the same money. It suits companies that can afford at least a few experiments a year and either run an MMM or plan to. It is most valuable before an annual budget round.
When not to use it
Skip the full system if you run one or two channels or lack the volume for experiments and a model. A single well-run geo test and an honest attribution report will tell a smaller business more. Do not adopt it to produce one merged number for the board; the tools measure different things and forcing them to agree hides real uncertainty.
Common mistakes
- Forcing the MMM, attribution and experiments to match exactly, which Google's playbook warns adds strong assumptions and makes every number less accurate.
- Calibrating a whole channel from one experiment, then treating the result as permanent.
- Comparing an experiment and a model that measure different outcomes, periods or spend levels, for example a two-week campaign test against a full-year channel estimate.
- Using attribution numbers for annual planning and model numbers for daily bidding, the reverse of what each is built for.
- Reading a point estimate from a noisy experiment as exact instead of comparing confidence intervals.
FAQ
What is unified marketing measurement?
It is the practice of running marketing mix modeling, attribution and incrementality experiments together, each for the decision it is best at. Experiments provide the causal check and are used to correct the other two. Google calls the same approach modern measurement. There is no single standard or inventor; the method is set out in vendor and open-source documentation.
What is triangulation in marketing measurement?
Triangulation means comparing estimates from methods whose errors come from different sources. Attribution tends to over-credit click-based channels, experiments give a conservative but causal reading, and MMM sits between them. When the three point the same way, you can act with more confidence. When they diverge, you check tracking, model assumptions or the test design before moving money.
How do you calibrate a marketing mix model with lift tests?
Each open-source tool does it differently. Meridian turns experiment results into ROI priors and adjusts them for spend, recency and test length. Robyn adds the gap between model and experiment as a calibration error it minimises. PyMC-Marketing treats each lift test as an extra observation of a channel's saturation curve.
How often should you run calibration experiments?
Google's 2024 playbook describes experiments as a quarterly activity and recommends retesting every three to six months, because incrementality changes with spend, season and creative. MMMs are usually refreshed one to four times a year, and attribution runs daily. Plan experiments around the moments when budgets are set.
Is multi-touch attribution still useful?
Yes, for day-to-day work. Attribution is fast and granular, so it guides bids, creatives and audiences inside a channel. It is weak for planning, because it sees only tracked digital touchpoints and, on iOS since version 14.5, needs user permission to track across apps. Calibrating it with experiments keeps it useful.
Sources
- Google, Modern Measurement playbook, 2024 edition (PDF)
- Google, Ana Carreira Vidal and Hannah Lamb, Drive business goals with modern measurement, March 2024
- Google Meridian, ROI priors and calibration
- Google Meridian, Set custom ROI priors using past experiments
- Google, Meridian marketing mix model, developer documentation
- Meta Marketing Science, Robyn features: calibration with experiments
- Julian Runge, Igor Skokan, Gufeng Zhou, Koen Pauwels, Packaging Up Media Mix Modeling: An Introduction to Robyn's Open-Source Approach, arXiv, 2024
- PyMC-Marketing, Lift test calibration
- Yingxiang Zhang, Mike Wurm, Eddie Li, Alexander Wakim, Joseph Kelly, Brenda Price, Ying Liu, Media Mix Model Calibration With Bayesian Priors, Google, 2024
- Edwin Ng, Zhishi Wang, Athena Dai, Bayesian Time Varying Coefficient Model with Applications to Marketing Mix Modeling, Uber, arXiv, 2021
- Julian Runge, Harpreet Patter, Igor Skokan, A New Gold Standard for Digital Ad Measurement?, Harvard Business Review, March 2023
- Debbie A. Lawlor, Kate Tilling, George Davey Smith, Triangulation in aetiological epidemiology, International Journal of Epidemiology 45(6), 2016
- David Chan, Mike Perry, Challenges and Opportunities in Media Mix Modeling, Google, 2017
- Jon Vaver, Jim Koehler, Measuring Ad Effectiveness Using Geo Experiments, Google, 2011
- Brett R. Gordon, Florian Zettelmeyer, Neha Bhargava, Dan Chapsky, A Comparison of Approaches to Advertising Measurement: Evidence from Big Field Experiments at Facebook, Marketing Science 38(2), 2019
- Kellogg School of Management, Gordon, Moakler, Zettelmeyer, Close Enough? research abstract, 2023
- Randall A. Lewis, Justin M. Rao, The Unfavorable Economics of Measuring the Returns to Advertising, Quarterly Journal of Economics 130(4), 2015
- Google Ads Help, About data-driven attribution
- Google Ads Help, About Conversion Lift
- Meta for Developers, Lift studies
- Meta Open Source, GeoLift documentation, Methodology
- Apple Developer, User privacy and data use (App Tracking Transparency)
Last updated Oct 9, 2026


Marketing agency or growth system: when a company outgrows its agency
An agency is the right call while the founder still runs most of the company. Once the business starts copying itself into new locations or markets, it needs a system that sets goals, tests hypotheses and owns the result.

Why healthcare marketing agencies stall: the short, mid and long wins model we use with clinics
Most agencies own the click and nobody owns the front desk. How we structure clinic work in three horizons, the research behind each one, and one year of results.

The compliance layer under fintech marketing operations
A fintech marketing agency can build campaigns. It cannot own the compliance review, the KYC drop-off or the multi-market licensing rules that decide whether a lead ever becomes a customer.