Critical path method
The critical path method links a project's tasks by dependency and finds the longest chain, which sets the earliest finish date and shows which tasks have spare time.
The critical path method (CPM) is a scheduling technique that links a project's tasks by dependency and finds the longest chain of them, which sets the earliest possible finish date. Tasks on that chain have zero float, so any delay moves the finish. All other tasks have float they can use. James Kelley and Morgan Walker developed it with DuPont and Remington Rand in the late 1950s.
- Origin
- James E. Kelley Jr. and Morgan R. Walker (CPM, DuPont and Remington Rand); the Navy Special Projects Office team (PERT), 1957 to 1959
- Level
- 301 · Advanced
- Fits
- Small and mid-size, Scale-up, Enterprise
- Time to apply
- About two hours for a first network of 10 to 20 tasks
- What you need
- a project with a finish date that matters and tasks that wait on one another · the people who own each task, to give a duration and name what they need first · a spreadsheet or a scheduling tool that can run the passes
The critical path method is a way to calculate a project’s shortest possible duration. You list the tasks, record which ones must finish before others can start, and find the longest chain of dependent tasks. That chain is the critical path: every day it slips, the finish slips a day. Tasks off the chain have float, which is spare time they can use without moving the end.
Where did the critical path method come from?
It came out of an industrial scheduling problem at DuPont. Kelley and Walker’s 1959 paper says DuPont’s Integrated Engineering Control Group began in late 1956 to ask whether computers could build and revise master schedules. James Kelley came from Remington Rand UNIVAC and Morgan Walker represented DuPont. Their method was demonstrated in September 1957 and tested on a $10 million chemical plant project of 393 jobs.
Kelley published the mathematics in Operations Research in 1961 as a parametric linear program that trades duration against cost. Fulkerson gave a network-flow method for the same cost curves, and Prager later reinterpreted it for civil engineers.
A second line developed at the same time. The US Navy’s Special Projects Office and its contractors built PERT for the Polaris missile programme and described it in Malcolm and colleagues’ 1959 paper. Mosaic Projects says PERT lagged CPM by 6 to 12 months and credits its team with coining the phrase “critical path”, although Kelley and Walker used it for their method’s name. The sources disagree on that point, and we leave it open. John Fondahl’s 1961 report then showed how to run the method by hand, without a computer.
How do the forward pass and backward pass work?
The forward pass finds the earliest each task can start and finish. The backward pass finds the latest each can start and finish without delaying the project. NASA’s schedule handbook notes that both passes ignore resource limits. Float is the gap between the two.
Take an illustrative campaign launch for a clinic’s new service. The tasks, in weeks:
| Task | Weeks | Needs first | Earliest start | Earliest finish | Latest start | Latest finish | Float |
|---|---|---|---|---|---|---|---|
| A Offer | 2 | none | 0 | 2 | 0 | 2 | 0 |
| B Legal check | 4 | A | 2 | 6 | 3 | 7 | 1 |
| C Landing page | 5 | A | 2 | 7 | 2 | 7 | 0 |
| D Tracking | 3 | A | 2 | 5 | 4 | 7 | 2 |
| E Training | 2 | D | 5 | 7 | 7 | 9 | 2 |
| F Testing | 2 | B, C, D | 7 | 9 | 7 | 9 | 0 |
| G Go live | 1 | E, F | 9 | 10 | 9 | 10 | 0 |
Forward: F starts only when B, C and D are done, at weeks 6, 7 and 5, so its earliest start is 7. G waits for E (week 7) and F (week 9) and finishes in week 10. Backward: G must start by 9, so E and F must finish by 9. D feeds E and F, both with latest start 7, so D must finish by 7 and start by 4. A feeds B, C and D, with latest starts 3, 2 and 4, so it must finish by 2.
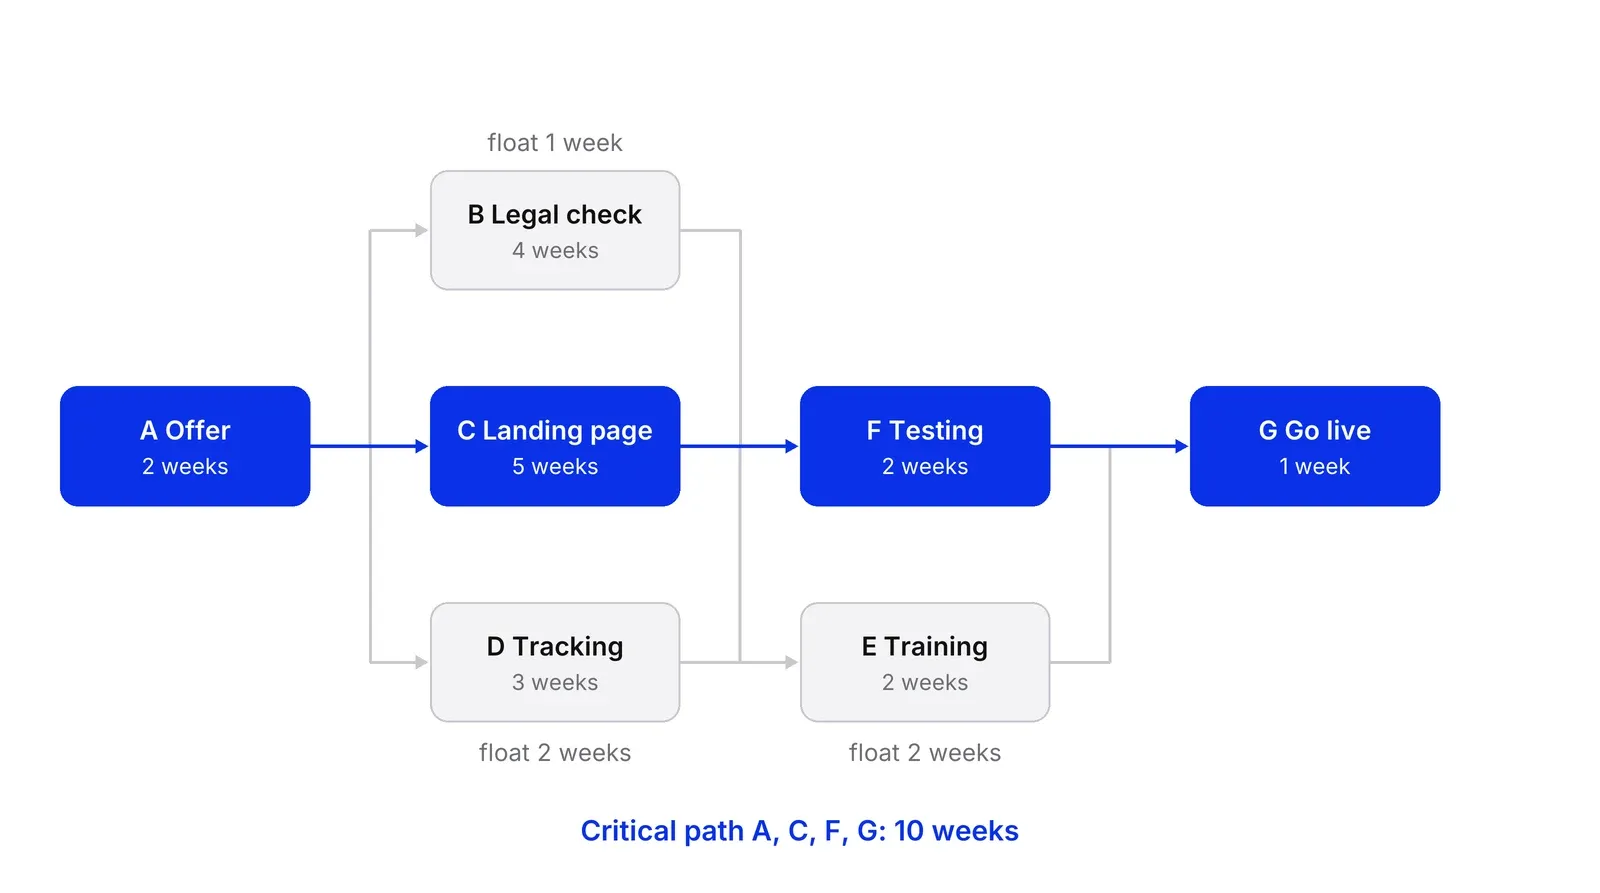
The tasks with zero float, A, C, F and G, form the critical path, and 2 + 5 + 2 + 1 gives the 10 weeks. Kelley and Walker defined a job as critical when the time available to it equals its duration, and named several kinds of float. Two matter in practice. Total float is the slip before the finish moves. Free float is the slip before the next task is affected. Here D has 2 weeks of total float but no free float: if D slips a week, E must start a week later, and E spends a week of its own float.
What can you do with the critical path?
You can aim effort at the few tasks that set the date. In the DuPont tests, Kelley and Walker report that only about 10% of jobs were critical, and that for one plant project the computed schedule gained two months at no added cost and two more for about a 1% rise in variable direct cost. Those are the inventors’ own results. The logic is general: effort spent on a critical task shortens the project, and effort spent elsewhere does not.
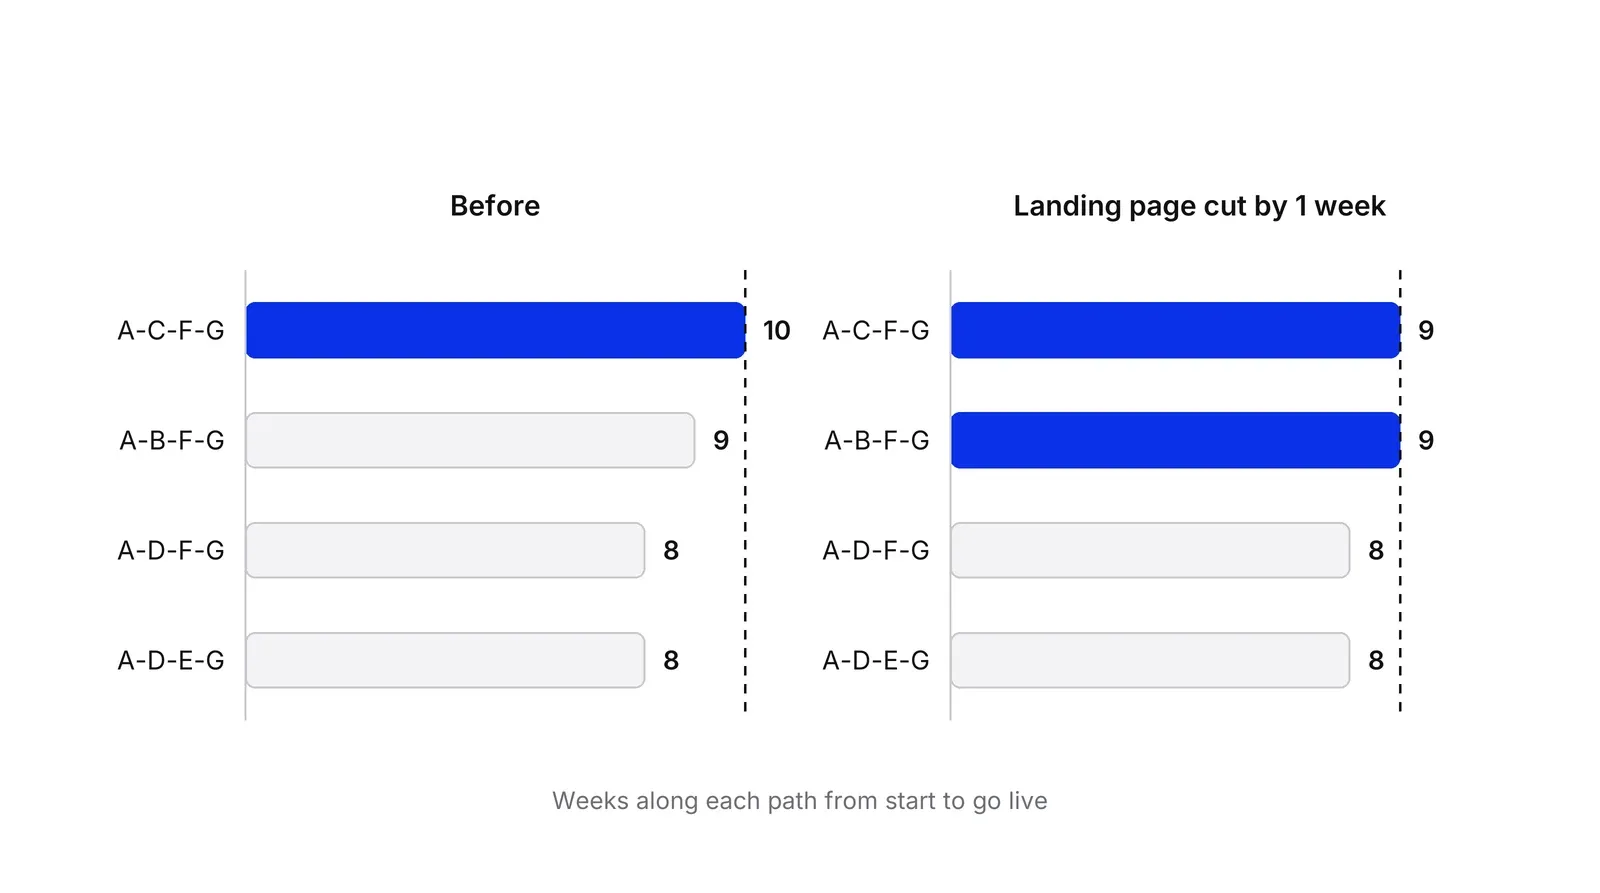
That logic stops at a point. Suppose the landing page is cut from 5 weeks to 4. The A, C, F, G path drops to 9 weeks, but the A, B, F, G path is already 9, so the project gains one week, not two. A second cut has to hit both paths. Kelley and Walker describe the same effect: as a project is compressed, more and more jobs become critical, so the cheapest set of critical jobs is expedited at each stage.
Where does CPM mislead?
NASA’s handbook lists the limits of basic CPM: one fixed duration per task, little attention to non-critical tasks that carry risk, no resource conflicts, and misuse of float, because work expands to fill the time.
Uncertainty is the main gap. Bildson and Gillespie noted in 1962 that Kelley’s basic model does not evaluate random variation in task times. PERT’s answer is three estimates per task, optimistic, most likely and pessimistic, combined as (a + 4m + b) / 6 for the mean; Herrerias-Velasco and colleagues revisit its mean and variance, and Sasieni wrote a note on the mean-time formula. Klingel found PERT completion estimates too optimistic on a real network with several near-equal parallel paths, and Banerjee and Paul analyse the error that arises when path correlation is ignored. Our example has this shape: the legal-check path sits one week behind.
Flyvbjerg attributes forecast errors to optimism bias and recommends reference-class forecasting, which starts from how comparable past projects ended. Longer builds also cost more: across 258 transport projects, Flyvbjerg, Holm and Buhl found cost escalation strongly linked to the length of the implementation phase.
Shared people are the other gap. Critical chain scheduling, which comes from the theory of constraints, adds resource conflicts and buffers to the path. Herroelen and Leus found its common 50% buffer rule may overbuild protection, and that refreshing the baseline regularly gave the shortest final duration.
CPM, PERT, Gantt chart and Kanban
| Tool | What it does | Durations | Best for |
|---|---|---|---|
| CPM | Finds the longest chain and float | One per task | Projects with known work and a fixed end |
| PERT | Same logic with probability | Three per task | Research and uncertain work |
| Gantt chart | Draws the schedule on a calendar | As given | Showing the plan; see that page for its history |
| Kanban | Limits work in progress | None | Continuous flow, no end date |
Söderlund, Geraldi and Engwall review Sapolsky’s account that PERT never played the role in Polaris that it is usually credited with, so be wary of heroic claims for either method. Geraldi and Lechter argue that such charts rest on principles that do not hold for every project. A Growth Lab plan can start from the longest dependent chain.
How to apply Critical path method, step by step
- List the tasks and who owns them. Write every piece of work as a task with one owner and one visible output. Keep tasks to a few days or weeks each. Result: a task list that covers the whole scope, because a task missing from the list is missing from the path.
- Add a duration and the predecessors. For each task, record how long it takes and which tasks must finish before it can start. Ask the owner, not the sponsor. Result: a table of task, duration and predecessors that can be drawn as a network.
- Run the forward pass. Starting at day zero, set each task's earliest start to the latest earliest finish among its predecessors, and its earliest finish to start plus duration. Result: the earliest date each task can finish and the earliest finish of the whole project.
- Run the backward pass and compute float. Starting from the project finish, set each task's latest finish to the earliest latest start among its successors, and its latest start to finish minus duration. Float is latest start minus earliest start. Result: a float figure for every task.
- Mark the critical and near-critical paths. Colour the tasks with zero float. Add any task with only a little float, such as a week, since one slip turns it critical. Result: a short watch list, usually a minority of tasks.
- Re-run it on a fixed day each week. Update the finished tasks and the remaining durations, then repeat both passes. The critical path can move. Result: a weekly view of what now sets the finish date, and what a delay would cost.
Examples
A clinic launching a campaign for a new service
Illustrative. A clinic needs an offer, a legal check of the ad claims, a landing page, tracking, front-desk training, an end-to-end test and a go-live. The worked example below puts numbers on it: the launch takes 10 weeks, only the offer, landing page, test and go-live are critical, and the legal check has a week to spare.
DuPont's Louisville Works shutdowns
Documented. Kelley and Walker report that CPM cut the average shutdown of a neoprene intermediate unit from 125 hours to 93, with a projected 78 hours if work on critical jobs was expedited. They write that only about 10% of the jobs in a shutdown were critical. These are the authors' own figures from the 1959 paper, not an independent evaluation.
A payments startup preparing a market launch
Illustrative. After a 2-week product spec, a partner bank review takes 6 weeks, a sandbox integration 4 and a compliance policy pack 5, and the final test takes 2. The bank path gives 10 weeks, the policy pack path 9 and the integration path 8. The team spends its attention on the bank review, which is also the task it does not control, so it logs a range for that bar and asks the bank for its timetable in week one.
When to use it
Use it for a one-off project with a fixed finish and tasks that depend on each other: a product or campaign launch, a migration, a plant shutdown, an office move, a licence application. It earns its keep when someone asks 'what happens to the date if this slips' or 'where would an extra week of effort help'.
When not to use it
Skip it for continuous flow work such as support or content production, where Kanban and flow metrics fit better. Skip it when scope is still being discovered and tasks cannot be sized. Be careful when one team or specialist is shared across several tasks, because basic CPM assumes people are free when needed.
Common mistakes
- Leaving tasks out. The calculation only sees the network you give it, and NASA's schedule handbook warns that an incomplete or badly linked network produces a wrong critical path.
- Treating a single duration as a fact. Basic CPM uses one deterministic duration per task and ignores uncertainty, which NASA's handbook lists among its limitations.
- Watching only the critical path. When a second path is a week behind, one slip makes it critical, and PERT-style studies found completion-time estimates too optimistic when parallel paths are near-equal.
- Ignoring resources. If one person owns two parallel tasks, the network says they overlap and the calendar says they cannot.
- Spending the float. Work expands to fill the time it is given, so a task with 2 weeks of float often arrives at the end of the float.
FAQ
What is the critical path method used for?
It is used to find the earliest finish date of a project and the tasks that set it. With those tasks marked, a manager knows where a delay moves the launch, where spare time exists, and where paying for extra speed shortens the project. Kelley and Walker built it to schedule plant construction and maintenance shutdowns.
How do you find the critical path?
Draw the tasks as a network, then run a forward pass to get each task's earliest start and finish, and a backward pass from the project finish to get its latest start and finish. Tasks where the two sets of dates are equal have zero float. Together they form the critical path.
What is the difference between CPM and PERT?
CPM uses one duration per task and was built for the time and cost of projects with known work. PERT was built by the US Navy's Special Projects Office and its contractors for Polaris, where durations were uncertain, so it uses three estimates per task. Both find the longest path, and most tools now blend them.
What is float or slack?
Float is the time a task can slip without delaying something else. NASA's handbook separates total float, the slip before the task joins the critical path, from free float, the slip before it delays its immediate successor. Critical tasks usually have zero total float.
Can a project have more than one critical path?
Yes. If two chains of tasks have the same longest length, both are critical, and a delay on either moves the finish date. In the worked example, shortening the landing page by a week makes the legal-check path critical too, so the project gains one week, not two.
Sources
- James E. Kelley Jr., Morgan R. Walker, Critical-path planning and scheduling, Proceedings of the Eastern Joint Computer Conference, 1959
- James E. Kelley Jr., Critical-path planning and scheduling: mathematical basis, Operations Research 9(3), 1961 (RePEc record)
- D. G. Malcolm, J. H. Roseboom, C. E. Clark, W. Fazar, Application of a technique for research and development program evaluation, Operations Research 7(5), 1959 (RePEc record)
- Mosaic Projects, The origins of CPM, PDM and PERT schedules
- Mosaic Projects, A brief history of scheduling
- NASA, Schedule Management Handbook, NASA/SP-2010-3403, revision 1
- D. R. Fulkerson, A network flow computation for project cost curves, Management Science 7(2), 1961 (RePEc record)
- William Prager, A structural method of computing project cost polygons, Management Science 9(3), 1963 (RePEc record)
- R. A. Bildson, J. R. Gillespie, Critical path planning and PERT integration, Operations Research 10(6), 1962 (RePEc record)
- A. R. Klingel Jr., Bias in PERT project completion time calculations for a real network, Management Science 13(4), 1966 (RePEc record)
- Kenneth R. MacCrimmon, Charles A. Ryavec, An analytical study of the PERT assumptions, Operations Research 12(1), 1964 (RePEc record)
- Arunava Banerjee, Anand Paul, On path correlation and PERT bias, European Journal of Operational Research 189(3), 2008 (RePEc record)
- Jose Manuel Herrerias-Velasco, Rafael Herrerias-Pleguezuelo, Johan Rene van Dorp, Revisiting the PERT mean and variance, European Journal of Operational Research 210(2), 2011 (RePEc record)
- M. W. Sasieni, A note on PERT times, Management Science 32(12), 1986 (RePEc record)
- J. Soderlund, J. Geraldi, M. Engwall, PERT, Polaris, and the realities of project execution, International Journal of Managing Projects in Business 5(4), 2012
- J. W. Fondahl, A non-computer approach to the critical path method for the construction industry, Stanford University Technical Report 9, 1962 (TRID record)
- Willy Herroelen, Roel Leus, On the merits and pitfalls of critical chain scheduling, Journal of Operations Management 19(5), 2001 (IAOR record)
- Bent Flyvbjerg, From Nobel Prize to project management: getting risks right, Project Management Journal 37(3), 2006 (arXiv)
- Bent Flyvbjerg, Mette Skamris Holm, Soren Buhl, What causes cost overrun in transport infrastructure projects?, Transport Reviews 24(1), 2004 (arXiv)
- Joana Geraldi, Thomas Lechter, Gantt charts revisited: a critical analysis of its roots and implications to the management of projects today, International Journal of Managing Projects in Business 5(4), 2012
Last updated Oct 9, 2026


Fractional COO or embedded operations team? How to choose at Series A
The two models solve different problems: how to tell which one your company needs, and what each costs in time and control.

What operational systems successful fintech startups use: lessons from ten companies
Starling, Monzo, Qonto, bunq, Lunar, Pleo, Tide, Ramp, Mercury and Column scaled on four operating systems. Regulators' findings show what breaks when one of them lags behind growth.

What a revenue operations manager actually owns
Pipeline definitions, CRM hygiene, forecasting and the handoffs between marketing, sales and success. What the role covers, and how it differs from sales ops.