Six Sigma / DMAIC
Six Sigma is a method for cutting defects by measuring and reducing variation in a process, run as projects that follow the five DMAIC phases: Define, Measure, Analyze, Improve, Control.
Six Sigma is a data-driven method for cutting defects by reducing variation in a process. It began at Motorola in the mid-1980s and spread through General Electric in the late 1990s. Its project routine, DMAIC, has five phases: Define, Measure, Analyze, Improve, Control. The famous 3.4 defects per million rests on an assumed 1.5-sigma drift in the process mean.
- Origin
- Motorola engineers, with Bill Smith most often credited (sources differ); popularised by General Electric under Jack Welch, 1986 at Motorola; company-wide at GE from 1995
- Level
- 301 · Advanced
- Fits
- Scale-up, Enterprise
- Time to apply
- 3 to 6 months for a first DMAIC project on one process
- What you need
- one process that produces countable defects, with a sponsor who owns the result · a way to record each unit and each defect, even if it starts as a spreadsheet · a small team that includes the people who run the process every day
Six Sigma is a method for cutting defects by measuring how much a process varies and then reducing that variation. A team picks one process, counts its defects, finds the causes with data and fixes them in a project that follows five phases, known as DMAIC. ASQ describes DMAIC as a data-driven quality strategy and an integral part of Lean Six Sigma. The method is old enough to have both a track record and a set of well-argued critics, and this page covers both.
Where did Six Sigma come from?
It came from Motorola in the 1980s, though accounts differ on who did what and when. Motorola’s own timeline says it invented the Six Sigma quality improvement process in 1986. A Process Excellence Network history says Bill Smith, a quality engineer, took his ideas to CEO Bob Galvin in 1985. It then lists a three-day course for 14,000 engineers in 1986 and a one-day course for 55,000 other staff in 1987.
The 1987 Motorola annual report shows the goal in the company’s words: a tenfold improvement in quality in two years, a hundredfold in four, and Six Sigma by 1992. NIST records that the first Baldrige quality awards were announced on 14 November 1988, and the Process Excellence Network says Motorola won one. Smith’s own account is in a 1993 IEEE Spectrum article on six-sigma design. Even his story has loose ends: iSixSigma says he joined Motorola in 1987, yet also says his principles were in use two years before the 1988 award.
What does “six sigma” mean, and where does 3.4 come from?
Sigma is the standard deviation, a measure of how widely a process’s results spread around their average. A “six sigma” process has its specification limits six standard deviations from the average. The NIST handbook gives the arithmetic for a centred process: at that distance, about 2 parts per billion fall outside the limits.
The widely quoted 3.4 per million is a different number, and it needs an assumption. Six Sigma assumes the process average drifts by 1.5 standard deviations over time. Then the nearer limit is only 4.5 deviations from the average, and the share beyond it is about 3.4 in a million. We checked the arithmetic: the tail beyond 4.5 deviations is 3.4 in a million, and the far tail is negligible.
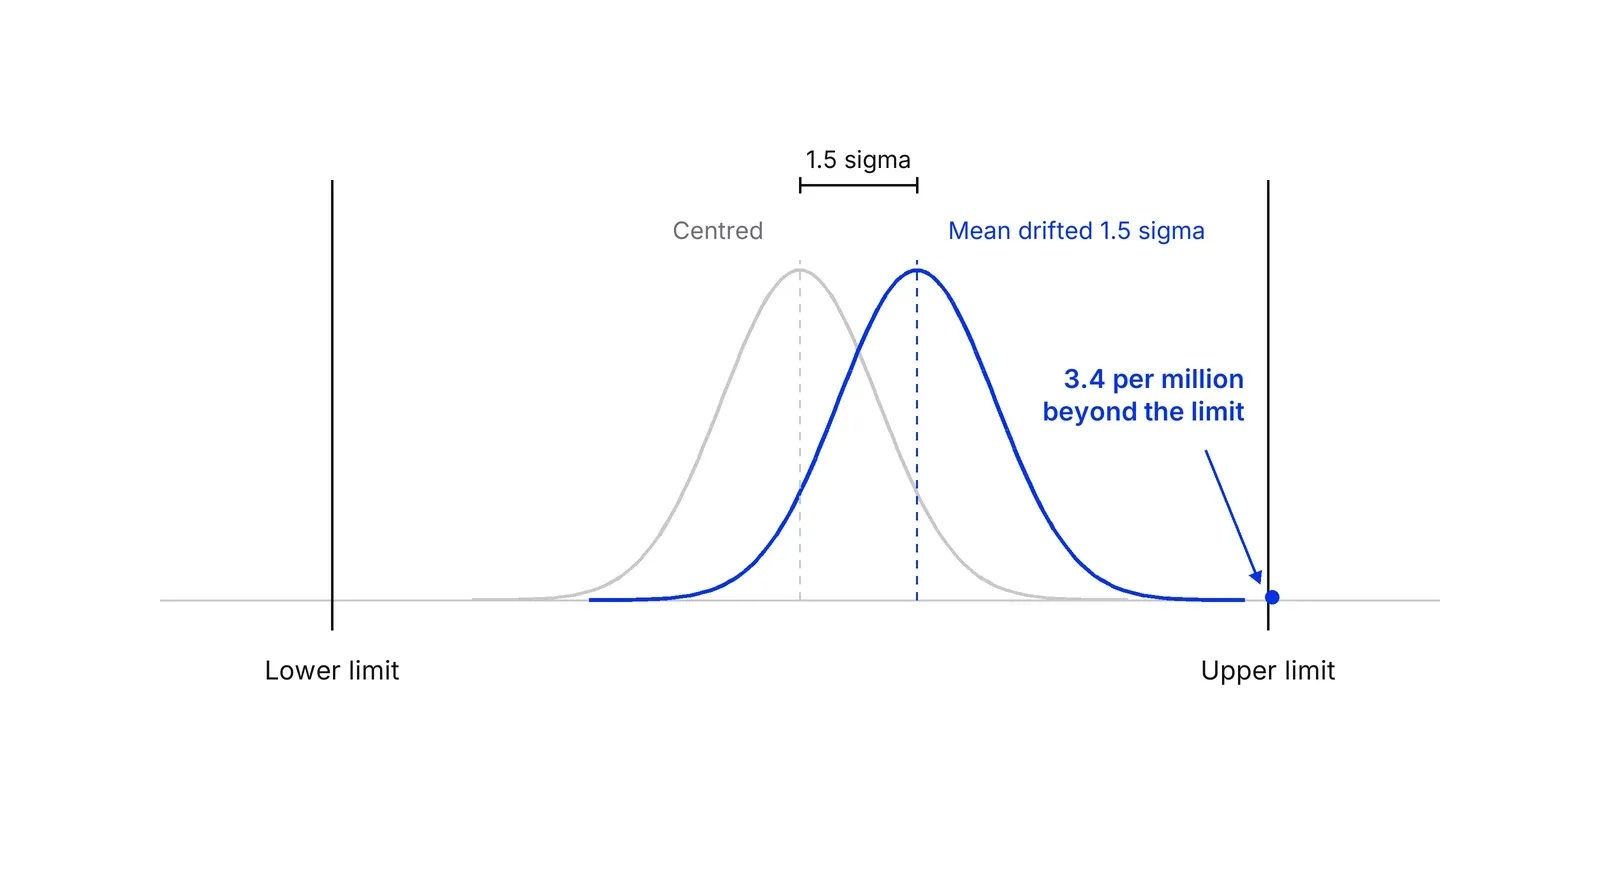
Sources disagree on what the shift is. Mikel Harry, whose 1992 book with Lawson later papers cite for the shift, says on iSixSigma that it is a statistical construct, a worst-case allowance when estimating short-term capability, and not an actual movement of the mean. Coskun and Ialongo, writing in a laboratory medicine journal, state that the shift assumes normally distributed data monitored by control charts, and argue it needs evidence before it is applied to a new setting. Treat 3.4 as a convention that makes sigma levels comparable. For a team, the useful number is its own DPMO, defects per million opportunities, and whether it falls.
How does DMAIC work?
DMAIC is the project routine: Define, Measure, Analyze, Improve, Control. ASQ’s one-page guide gives each phase a purpose and a toolset and presents them in order: the data is collected in Measure, causes are tested in Analyze, and only then is a fix chosen.
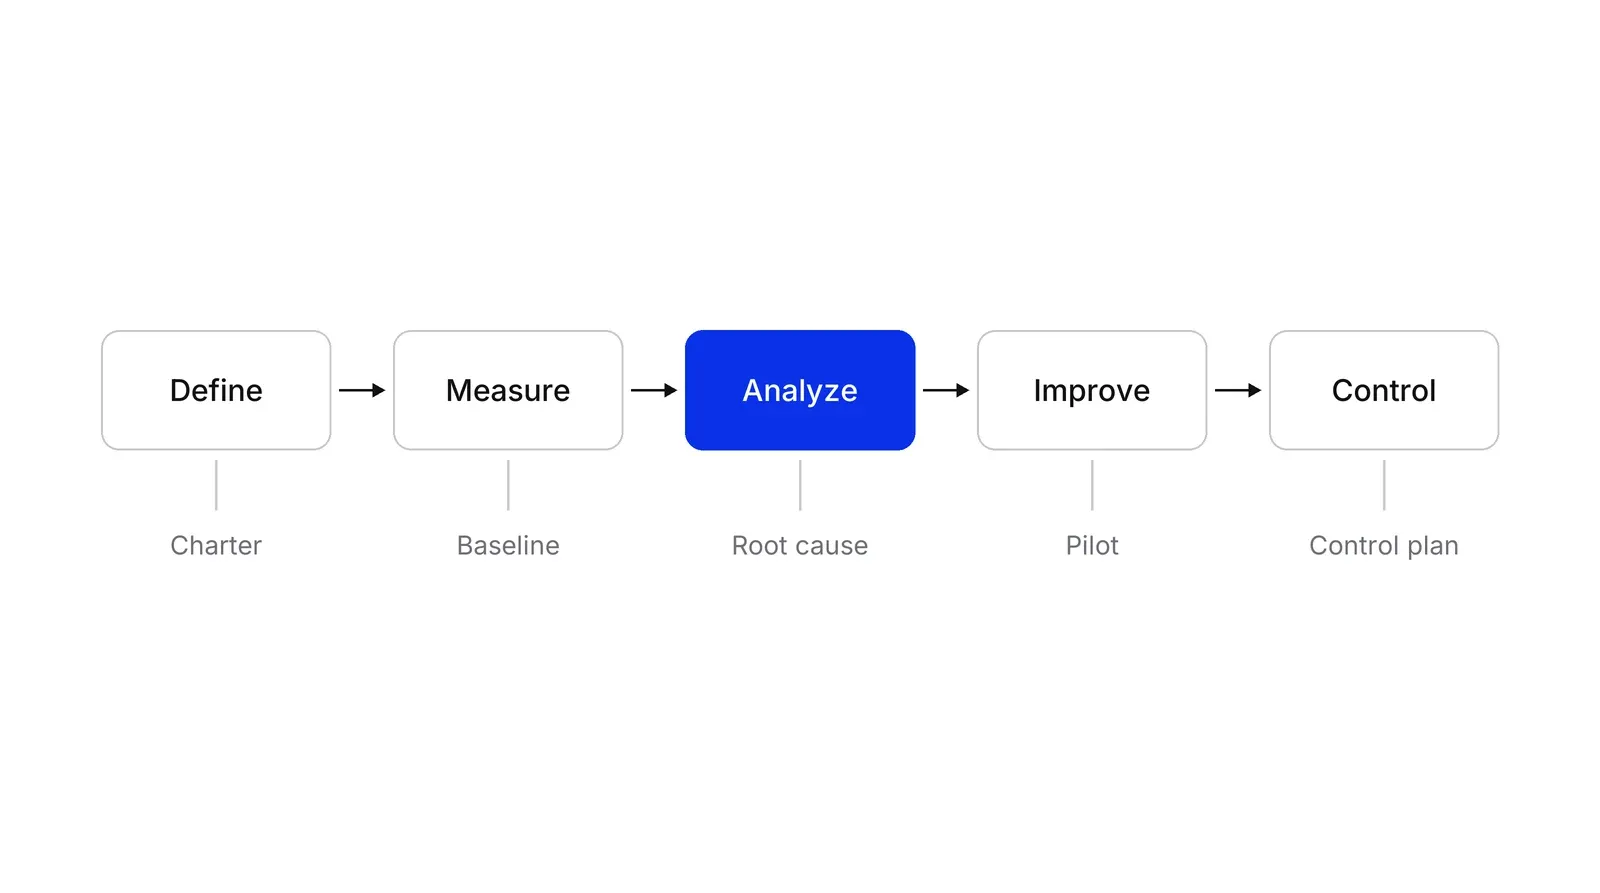
The tools are mostly older ones put in sequence. A SIPOC map frames the process in Define. A Pareto chart splits defects by type, and an Ishikawa diagram with the 5 whys traces causes. A statistical test tells the team whether a pilot really moved the rate. What Six Sigma adds is the structure. Schroeder and colleagues found the tools resemble earlier quality methods, and that the method adds an organisational structure not previously seen.
How did GE make it famous?
GE made it a company-wide program, and its results made the method a standard in large companies. GE’s 1997 annual filing, which covers its businesses from plastics to NBC, attributes sharp variable-cost improvements in 1997 to the Six Sigma program and says it freed capacity, which lowered planned capital spending. IndustryWeek’s reading of Welch’s letter reports an estimate of more than $300 million added to 1997 operating income and a tenfold longer life for CT scanner X-ray tubes. These are company figures, and the filing does not separate Six Sigma from other changes.
When James McNerney left GE to run 3M, BusinessWeek reports, he imported GE’s Six Sigma program and thousands of staff became black belts. That is where the critique starts.
What does the evidence say?
It shows real gains in defined processes, thinner proof of lasting company-wide returns, and a recurring worry about innovation. Gjolaj and colleagues report a 9-week DMAIC pilot in an oncology unit that halved lab turnaround. Antony and colleagues reviewed 68 healthcare papers and reported benefits, but only on papers of fair methodological quality, with projects mostly aimed at whole hospitals.
On innovation, Hindo’s BusinessWeek story reports that the share of 3M sales from products under five years old slipped from about a third to a quarter after the Six Sigma years. Hindo ties it to the program, and 3M’s later CEO said invention cannot be scheduled like a process. We cannot separate Six Sigma from the other changes at 3M. Benner and Tushman’s study of ISO 9000 firms in photography and paint, reported by Wharton, points the same way: process management crowded out exploratory patents. Benner and Tushman recommend using process management where it fits and keeping it out of innovation-focused units. Supporters reply that the harm comes from misapplication, a point also made in Hammer’s MIT Sloan Management Review article, which warns against applying Six Sigma where it does not fit.
| Six Sigma / DMAIC | Lean | PDCA | |
|---|---|---|---|
| Targets | Variation and defects | Waste and flow | Learning from a small test |
| Method | Five-phase project with statistical analysis | Value stream maps, pull, flow | Plan, do, check, act cycle |
| Output | A process with a lower measured defect rate | A shorter, smoother flow | A decision to adopt, adapt or drop a change |
Many organisations combine the first two as Lean Six Sigma, and lean management covers the lean side. If the defect is clear and you can measure it, DMAIC gives a disciplined route. If a quick test would settle the question, run PDCA. A Growth Lab plan starts from a process map and a baseline number, which is the same ground DMAIC covers in Define and Measure: see Growth Lab.
How to apply Six Sigma / DMAIC, step by step
- Define the problem and the customer requirement. Write a project charter: the process, the defect, the customer requirement behind it, the goal and the sponsor. ASQ lists the charter, voice of the customer and value stream mapping as typical tools. A SIPOC map fixes where the process starts and ends. Result: a one-page charter the sponsor has signed.
- Measure current performance. Decide what counts as a defect and what the opportunities for a defect are, then collect data and check that the measurement itself is reliable. Calculate defects per million opportunities (DPMO). Result: a baseline number, with the data collection plan that produced it.
- Analyze to find the root causes. Compare good and bad units, split the defects by type with a Pareto chart, and test suspected causes with data. A fishbone diagram and the 5 whys help generate and trace causes. Result: a short list of causes that data supports, ranked by effect.
- Improve by piloting a solution. Design the fix for the confirmed cause, run it as a pilot on a slice of the work, and compare the result with the baseline using a statistical test. Result: a change that has measurably moved the defect rate, or a documented reason it did not.
- Control so the gain stays. Roll the change into standard work, add a control plan with an owner, a chart and a trigger for action, and hand the process back to its owner. ASQ names control plans, statistical process control and mistake-proofing for this phase. Result: a process that signals when it drifts back.
Examples
A payments company: payout files with errors
Illustrative arithmetic, not a real company. A team sends 2,400 payout files a month and each file has 5 fields that can be wrong. Finance logs 60 wrong fields in a month. DPMO is 60 divided by 12,000 opportunities, times a million, which is 5,000. With the usual 1.5-sigma convention that is about a 4.1 sigma process; without the convention it is about 2.6. Measure fixes the definition of a defect, Analyze splits the 60 by field, and Improve targets the field with most errors.
A cancer center: laboratory turnaround in an infusion unit
A documented case from the Journal of Oncology Practice. Long waits in an outpatient oncology infusion unit pointed to blood-draw delays. The team used DMAIC and put a phlebotomy station inside the unit. Over a 9-week pilot, mean lab turnaround for patients needing same-day lab and treatment fell from 51 to 24 minutes, and the wait to reach the treatment area fell 17% for all patients. The station became permanent.
General Electric: a company-wide program
A documented case at scale. GE's 1997 annual filing credits its Six Sigma quality program for sharp improvements in variable costs and for freeing capacity, so that planned capital spending could be lower. Welch's own estimate, reported by IndustryWeek, was more than $300 million added to 1997 operating income, and a tenfold longer life for CT scanner X-ray tubes. These are company figures, not audited ones.
When to use it
Use it when a process already exists, produces countable defects or delays, and the cost of each one is high: payment failures, claim errors, lab turnaround, shipping mistakes. It suits organisations that can fund trained project leaders and have the volume of data to measure variation. It fits scale-ups and enterprises with several repeating processes.
When not to use it
Do not use it to invent a product or explore a market where the problem is not yet defined. Hindo's BusinessWeek report on 3M and the Benner and Tushman research suggest process programs can crowd out exploratory work. Skip it for processes with a few dozen cases a month, where there is too little data to measure variation, and use PDCA or a kaizen event instead.
Common mistakes
- Treating the sigma level as a goal in itself. A team that chases a 6 sigma label on a process the customer does not care about has misread the method; the charter must start from a customer requirement.
- Skipping Measure and Analyze to jump to a fix. ASQ's own guidance puts the data work before the solution; without it, Improve is a guess.
- Quoting 3.4 defects per million without the 1.5-sigma shift. The figure is a convention, and comparing a team's sigma level with another team's needs the same convention.
- Letting the gain decay after the project. Without a control plan and an owner, the process drifts back; Kwak and Anbari conclude that culture change needs time and commitment.
- Applying the method to exploratory work. Hammer warned about applying Six Sigma where it does not fit, and 3M's CEO said invention cannot be scheduled like a process.
FAQ
What is Six Sigma?
Six Sigma is a method for reducing defects by measuring and reducing variation in a process. Schroeder and colleagues found its tools resemble older quality methods but that it adds an organisational structure not previously seen. Motorola began it in the mid-1980s, and General Electric made it famous in the late 1990s.
What does DMAIC stand for?
DMAIC stands for Define, Measure, Analyze, Improve, Control. ASQ describes it as a data-driven quality strategy used to improve processes and as an integral part of Lean Six Sigma. Define frames the problem, Measure sets the baseline, Analyze finds causes, Improve pilots a fix, and Control keeps the gain.
Why is Six Sigma 3.4 defects per million and not 2 per billion?
A process centred between limits six standard deviations away would give about 2 defects per billion. The 3.4 figure assumes the process mean drifts 1.5 standard deviations over time, so the nearer limit sits 4.5 deviations away. Critics note the shift is a convention that needs evidence in each setting.
Who invented Six Sigma?
Sources disagree. Motorola's own timeline dates its invention of the Six Sigma quality process to 1986, and many accounts credit the engineer Bill Smith. Dates for his proposal, the launch and even his arrival at the company differ between accounts. Mikel Harry co-wrote a 1992 book that later papers cite for the 1.5-sigma shift.
Is Six Sigma the same as Lean?
No. Six Sigma targets variation and defects with statistics, while lean targets waste and flow. They are often combined as Lean Six Sigma. Motorola says it later added lean methodology to its program. ASQ's DMAIC guide lists value stream mapping, a lean tool, among its Define tools.
Sources
- Motorola Solutions, Timeline: Six Sigma quality process, 1986
- Motorola Solutions, press release on its Lean Six Sigma program (origin, lean addition, DMAIC)
- Motorola Inc., 1987 Annual Report
- NIST, Baldrige history: Launching the award
- Process Excellence Network, Motorola, change and the development of Six Sigma
- iSixSigma, Remembering Bill Smith, father of Six Sigma
- Bill Smith, Six-sigma design, IEEE Spectrum 30(9), 1993
- Mikel Harry, Ask Dr. Harry: the 1.5 sigma shift, iSixSigma
- NIST/SEMATECH e-Handbook of Statistical Methods, process capability: Cp and Cpk
- Coskun and Ialongo, Six Sigma revisited: evidence for a 1.5 SD shift, Biochemia Medica 30(1), 2020
- Montgomery and Woodall, An Overview of Six Sigma, International Statistical Review 76(3), 2008
- General Electric, Form 10-K405 for fiscal 1997, SEC EDGAR
- IndustryWeek, Welch's 1997 annual report letter on Six Sigma
- ASQ, Identify and eliminate defects with the DMAIC process (PDF)
- Schroeder, Linderman, Liedtke and Choo, Six Sigma: definition and underlying theory, Journal of Operations Management 26(4), 2008
- Antony and colleagues, Six Sigma in healthcare: a systematic review of the literature, International Journal of Quality and Reliability Management, 2018
- Gjolaj, Gari, Olier-Pino and colleagues, Decreasing laboratory turnaround time and patient wait time in an outpatient oncology infusion unit, Journal of Oncology Practice 10(6), 2014
- Kwak and Anbari, Benefits, obstacles, and future of six sigma approach, Technovation 26(5), 2006
- Brian Hindo, At 3M, a struggle between efficiency and creativity, BusinessWeek, 11 June 2007
- Knowledge at Wharton, Do process management programs discourage innovation? (Benner and Tushman), 2005
- Michael Hammer, Process management and the future of Six Sigma, MIT Sloan Management Review, Winter 2002
- Pyzdek Institute, Six Sigma and innovation: debunking the myths (a training provider's defence)
Last updated Oct 9, 2026


Fractional COO or embedded operations team? How to choose at Series A
The two models solve different problems: how to tell which one your company needs, and what each costs in time and control.

What operational systems successful fintech startups use: lessons from ten companies
Starling, Monzo, Qonto, bunq, Lunar, Pleo, Tide, Ramp, Mercury and Column scaled on four operating systems. Regulators' findings show what breaks when one of them lags behind growth.

What a revenue operations manager actually owns
Pipeline definitions, CRM hygiene, forecasting and the handoffs between marketing, sales and success. What the role covers, and how it differs from sales ops.