Span of control
Span of control is the number of people who report directly to one manager, and the choice of that number sets how many managers, layers and meetings an organization needs.
Span of control is the number of people who report directly to one manager. Graicunas's formula shows that the relationships a manager must track grow much faster than headcount, so classic advice capped spans at about five. Modern research finds no single right number: the best span depends on how routine the work is, how much the manager also does themselves, and how strong the manager is.
- Origin
- V. A. Graicunas, building on Ian Hamilton, Luther Gulick and Lyndall Urwick, 1933 (published in book form 1937)
- Level
- 201 · Tool
- Fits
- Small and mid-size, Scale-up, Enterprise
- Time to apply
- Half a day for a first pass over one department
- What you need
- an org chart with the real number of direct reports for every manager · a short description of each manager's work: routine or varied, how much they still do themselves · the last few months of one-to-one and engagement data, if you have them
Span of control is the number of people who report directly to one manager. Choosing it also decides how many managers you need and how many layers sit between the top and the front line. Gallup’s survey data put the average at 12.1 direct reports in 2025 (Gallup), up from 10.9 a year earlier, while the median stayed at five to six, so a minority of very large teams pulls the average up.
Where the idea comes from
The idea is older than the formula. Graicunas opened his paper, first published in 1933, with a military rule of thumb from General Sir Ian Hamilton: a brain can handle three to six others, with groups nearer three at the top of an organization and nearer six at the foot (Graicunas, 1937 reprint). He also quoted a General Electric president who thought four or five direct reports were enough.
Graicunas, a Paris-based consultant born in Lithuania, gave the intuition a mathematical form. Lyndall Urwick, who edited the 1937 book with Luther Gulick, later said he helped Graicunas shape the paper (Nickols). Urwick came back to the principle in a 1974 paper (Urwick).
Why do more reports mean so many more relationships?
Because a manager does not only relate to each person. Graicunas counted three kinds: single links between the manager and each report, group links between the manager and every possible subset of the team, and cross links between the reports themselves. With two reports he counted 6 relationships, with four 44, with five 100 (Graicunas).
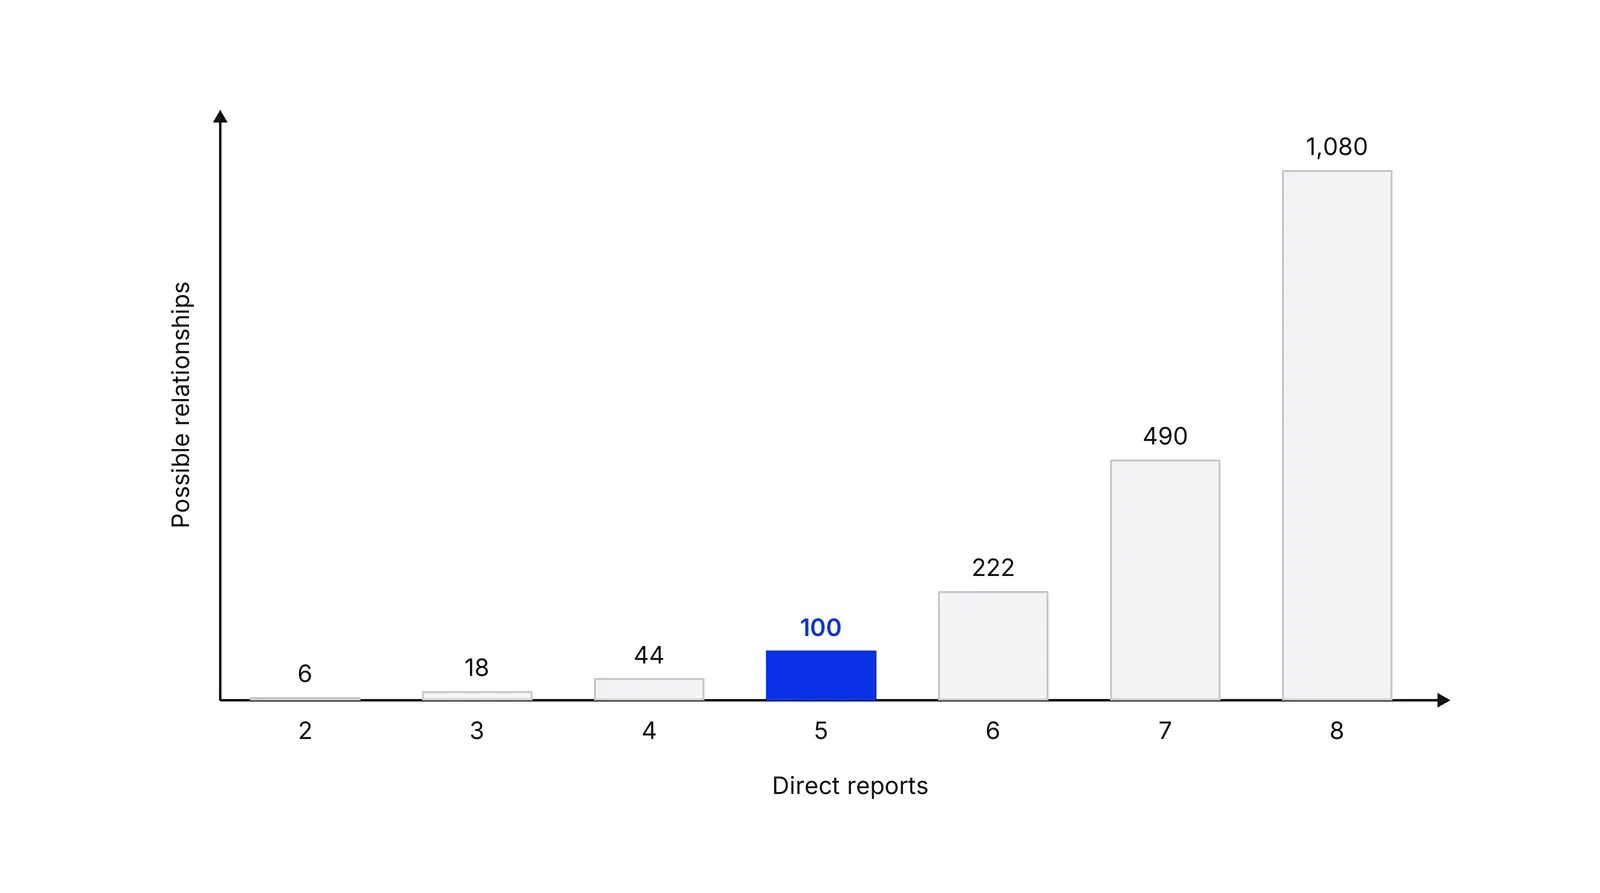
For n reports the maximum-basis total is n(2^(n-1) + n - 1). Going from four to five reports, he wrote, raises the total by 127 percent for a 20 percent gain in working capacity. His conclusion was a limit of five, most probably four, for work that is not routine (Graicunas).
The formula has limits, and Graicunas named one himself. Counting every possible link assumes they all matter. He argued the burden is far lighter where subordinates’ work does not touch, and gave the example of a British infantry division commander with six reports, three of whom led uniform brigades with no regular cross links.
Is there a right number?
No single number survives the evidence. Gulick, the other classic author, wrote that the question had “not been brought under sufficient scientific study”, and that answers diverged because executives differ in capacity and work habits and because the work compared is not alike (Georgiou, 2013). Herbert Simon’s 1946 critique called the narrow-span rule a proverb, since it came with no tested number (Simon). Georgiou argued in 2013 that Simon misread Gulick, who never claimed a generic optimum.
What follows is the research that did test spans.
| Factor | Pushes span down | Pushes span up |
|---|---|---|
| Kind of work | Varied, judgment-heavy tasks | Standardized, repetitive tasks |
| Links between reports | People depend on each other | Work is independent |
| Manager’s own load | Heavy hands-on work | Mostly managing |
| Location | Remote or hybrid | On-site |
| Support | No clear owners or routines | Clear decision rights and tools |
Each row has support. Dewar and Simet’s 1981 model tied spans to size, routineness and the number of specialties (AMJ). Meier and Bohte tested Gulick’s diversity of function, time and place on 678 Texas school districts and found the effects differ by level of the hierarchy (Public Administration Review, 2003). Theobald and Nicholson-Crotty found an organization’s best span for one goal may hurt another (2005).
For practice, McKinsey sorts manager jobs into five archetypes (player-coach, coach, supervisor, facilitator, coordinator), with spans from three to five up to more than 15 (McKinsey; the lower and upper ends are as Randstad reports them). Google’s engineering managers often have about 30 reports by design, to limit micromanagement (Garvin, HBR).
Gallup’s data show why the manager matters as much as the number. Its 2020 study found engagement tends to fall as teams grow, but managers with high scores on five traits stayed more engaged at every size (Gallup, 2020). Its 2026 analysis found managers spend a median 40% of their time on individual work, and team size had little effect on on-site managers but a negative one for remote and hybrid managers.
In healthcare the cost of width shows up in patient numbers. A study of 51 hospital units found wider spans linked to lower nurse and patient satisfaction (McCutcheon et al., 2009), and a 2023 review of 22 articles linked expanded spans to manager overload and burnout (Ruffin et al.).
What does span cost in layers?
Every narrow span needs more managers. Take 1,000 front-line staff, which is arithmetic only. At a span of 5 you need 200 first-line managers, 40 above them, 8, then 2, then 1: 251 managers in five layers. At a span of 10 you need 100, 10 and 1: 111 managers in three layers.
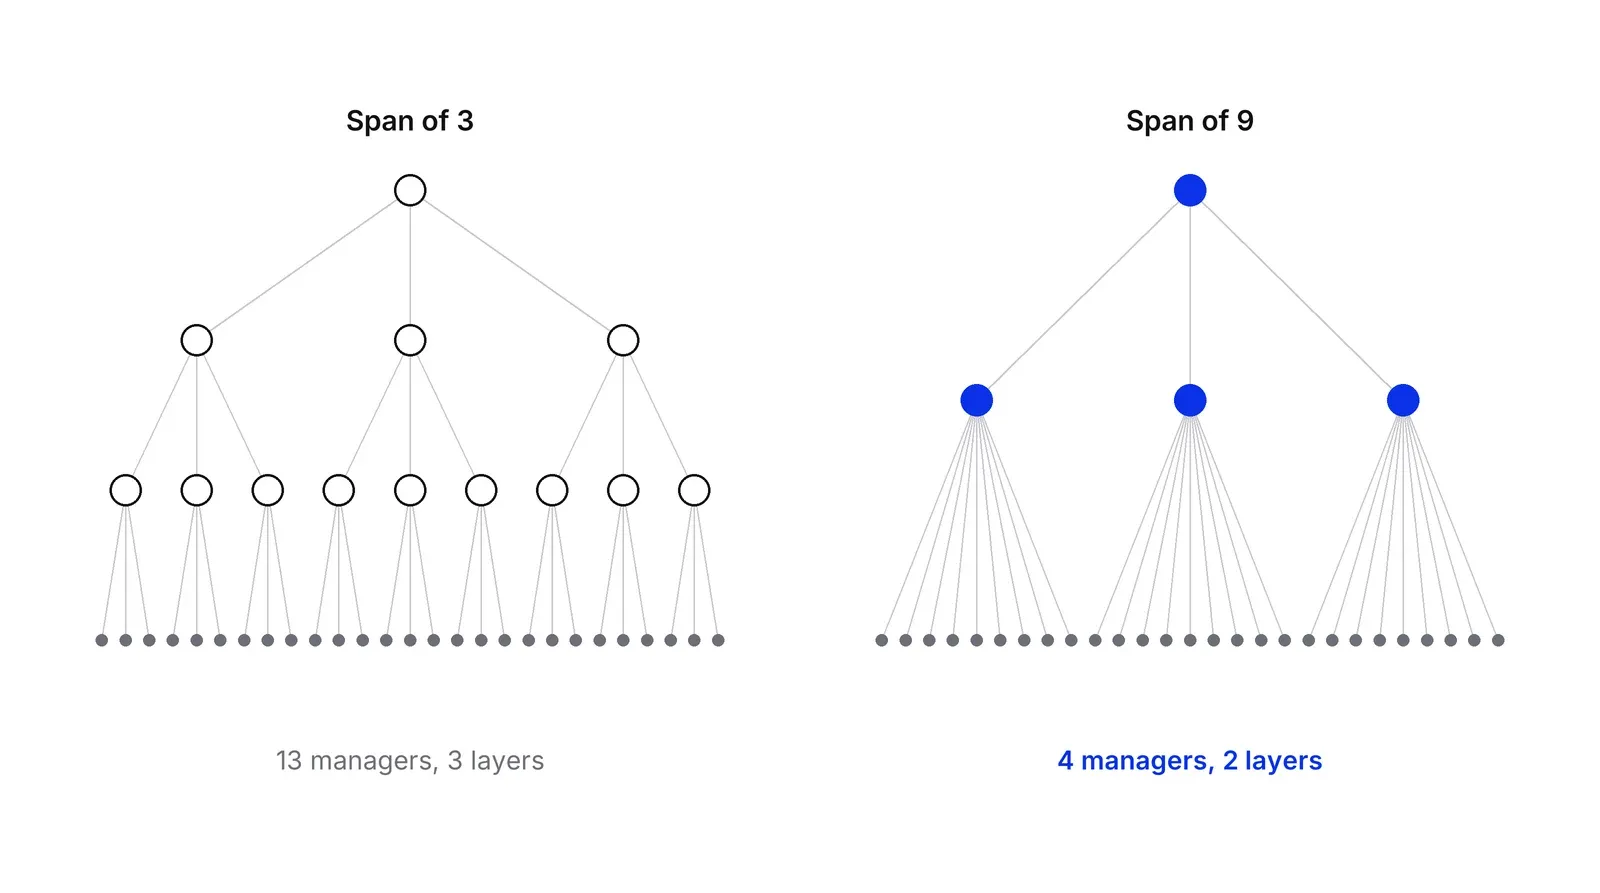
Simon’s point was that a narrow span and short chains of command pull against each other, so you cannot maximize both. Companies have moved toward wider spans. Neilson and Wulf found the typical CEO’s direct reports doubled from about five in the mid-1980s to almost ten in the mid-2000s (HBR, 2012), and Rajan and Wulf saw layers between division heads and the CEO fall in over 300 large U.S. firms (NBER).
Flattening has a catch. Wulf’s later study found flattened firms typically had more control and decision making at the top, not less (California Management Review, 2012). Technology matters too: Bloom and colleagues found tools that cut information costs, like enterprise software, went with wider spans and more autonomy, while communication tools pushed decisions up (Management Science, 2014). Garicano’s model explains why: a hierarchy exists to route hard problems to those who know the answer (JPE, 2000).
How span fits with other design choices
Span decides how much of the work a manager can see. A RACI matrix widens what a manager can safely carry by giving every task one owner. An operating rhythm replaces ad-hoc check-ins with fixed ones. Operating model design sets the structure the spans sit in, and growth team structure applies the same question to marketing and growth teams.
A Growth Lab plan starts from the decision rights and rhythm that let a team lead carry a wider span.
How to apply Span of control, step by step
- Count the real reports. For each manager, list everyone they set goals for, review work with and approve time off for. Include part-time staff and contractors who need real attention. Divide headcount by managers for the company average, then look at the spread, because the average hides the extremes. Result: a table of actual spans, from one manager with 2 reports to one with 24.
- Score the work each manager supervises. Mark each team as routine or varied, tightly or loosely linked (do people's tasks depend on each other?), and co-located or remote. Gulick named diversity of function, time and place as the drivers, and later studies kept size, routineness and specialization. Result: each team tagged with the factors that push its span up or down.
- Set a starting range per role. Use McKinsey's archetypes as the opening guess: about 3 to 5 reports for a player-coach whose team does varied, complex work, 15 or more for a coordinator of standardized work. Then lower the range for managers who still do a lot of hands-on work, as the Gallup data suggests. Result: a target range for each type of manager, not one company-wide number.
- Check the layers. Count how many layers sit between the top and the front line, and how many managers each range implies. A span of 5 needs 251 managers for a thousand front-line staff, a span of 10 needs 111. Result: a view of what the narrow option costs and what the wide one asks of managers.
- Back wide spans with routines. Where a span is wide, give the manager a weekly rhythm, a written decision-rights table and a clear owner for each task. Result: a list of support that makes each wide span safe.
- Review every quarter. Compare each team's turnover, engagement and missed one-to-ones against its span, and adjust. Result: ranges that follow the evidence, not the org chart's neat shape.
Examples
A hospital ward
Illustrative. One nurse manager has 40 nurses on three shifts, and the ward handles acute patients. A 2009 study in 51 hospital units found wider spans went with lower nurse and patient satisfaction, and that no leadership style fully offset very large spans. Splitting the ward into two units under two managers, each with about 20 nurses and a shift lead, cuts the load per manager. The routine tasks stay with shift leads.
A fintech compliance and support team
Illustrative. A payments company has 18 support agents answering the same tier-one questions from a script. The work is routine and agents rarely depend on each other, so one team lead with 12 to 15 agents can work if the lead does little hands-on work and holds weekly feedback sessions. The 6 analysts who review high-risk transactions are a different case: their cases are varied and they consult one another, so a lead with 4 to 5 analysts fits better.
A growth team in a mid-size company
Illustrative. A head of growth has 11 direct reports: paid media, SEO, CRM, analytics, content and their freelancers. She also runs the quarterly plan herself. Gallup's data tie engagement to how much of a manager's time goes on individual work, so she moves the plan to a growth lead and the span falls to 7.
When to use it
Use it when a manager looks overloaded or invisible, when you are adding or removing layers, when a fast hire plan will push someone's span up, or when you design a new team. It belongs in any operating model design pass.
When not to use it
Skip it when the question is who does which task, which a RACI matrix answers. Do not apply one number across the company. Do not use it as a cost-cutting tool alone, since removing managers without changing the work only moves the load.
Common mistakes
- Using a single magic number. The studies we found give ranges that depend on the work, from 3 to 5 for varied work to 15 or more for standard work, so one company-wide target fits some teams and hurts others.
- Counting only full-time employees. Part-time staff, contractors and dotted-line reports all take attention, and a manager whose span looks like 8 may carry 12.
- Flattening to save money and forgetting the work. Wulf's study of flattened firms found more control and decision making at the top, the opposite of the intent.
- Ignoring what the manager also does. A manager who spends most of the week on individual tasks has less time for the team, and Gallup's engagement data fall faster for them as the team grows.
- Setting spans once and leaving them. Tools, remote work and a team's maturity change what a manager can carry.
FAQ
What is a good span of control?
There is no single number. Graicunas and Urwick pointed to about 4 to 6 for work that is varied and interdependent. McKinsey's job-level study gives ranges from 3 to 5 up to 15 or more by type of work. Gallup finds the median manager has 5 to 6 reports, and team engagement depends more on manager quality than on size.
What is the Graicunas formula?
For n subordinates, the maximum-basis count of relationships is n(2^(n-1) + n - 1). For 4 reports it gives 44, for 5 it gives 100 and for 8 it gives 1,080. It counts one-to-one links, links between the manager and subsets of the team, and links between team members. It describes possible relationships, not ones that actually occur.
How do you calculate span of control?
For one manager, count direct reports. For an organization, divide the number of employees by the number of managers. Gallup cites a U.S. Bureau of Labor Statistics ratio of about one manager for every 11.5 employees. Always look at the spread by team, because an average of 10 can hide spans of 3 and 25.
What is the difference between a narrow and a wide span?
A narrow span means few reports per manager, which gives closer attention but needs more managers and more layers. A wide span means many reports, which gives a flatter structure and more autonomy but less time per person. The same 27 staff need 13 managers at a span of 3 and 4 managers at a span of 9.
Does a wider span of control hurt engagement?
It can, but not for everyone. Gallup's 2026 analysis found team size mattered little for on-site managers and more for remote and hybrid ones. Its 2020 work found manager talent shaped how engagement changed as teams grew. A 2009 hospital study found wider spans linked to lower nurse and patient satisfaction.
Sources
- V. A. Graicunas, Relationship in Organization, in Gulick and Urwick (eds.), Papers on the Science of Administration, Columbia University, 1937 (retyped edition by Fred Nickols)
- Fred Nickols, Graicunas and the span of control (biography and history of the 1933 paper)
- L. Urwick, V. A. Graicunas and the span of control, Academy of Management Journal 17(2), 1974
- Herbert A. Simon, The Proverbs of Administration, Public Administration Review 6(1), 1946
- Ion Georgiou, A blast at the past: an inquiry into Herbert Simon's arguments against the principles, Public Administration 91(4), 2013
- William G. Ouchi, John B. Dowling, Defining the span of control, Administrative Science Quarterly 19(3), 1974 (Stanford GSB working paper version)
- Dewar and Simet, A level specific prediction of spans of control examining the effects of size, technology, and specialization, Academy of Management Journal 24(1), 1981
- Kenneth J. Meier, John Bohte, Ode to Luther Gulick: span of control and organizational performance, Administration & Society 32(2), 2000
- Kenneth J. Meier, John Bohte, Span of control and public organizations: implementing Luther Gulick's research design, Public Administration Review 63(1), 2003
- Nick A. Theobald, Sean Nicholson-Crotty, The many faces of span of control, Administration & Society 36(6), 2005
- Raghuram Rajan, Julie Wulf, The flattening firm, NBER Working Paper 9633, 2003
- Julie Wulf, The flattened firm: not as advertised, California Management Review 55(1), 2012
- Gary L. Neilson, Julie Wulf, How many direct reports?, Harvard Business Review, April 2012
- Nicholas Bloom, Luis Garicano, Raffaella Sadun, John Van Reenen, The distinct effects of information technology and communication technology on firm organization, Management Science 60(12), 2014
- Luis Garicano, Hierarchies and the organization of knowledge in production, Journal of Political Economy 108(5), 2000
- Jim Harter, Span of control: what's the optimal team size for managers?, Gallup, January 2026
- Jim Harter, Ideal team size depends on the manager, Gallup, February 2020
- David A. Garvin, How Google sold its engineers on management, Harvard Business Review, December 2013
- McKinsey, How to identify the right spans of control for your organization
- Randstad, How to identify the right span of control for your company, December 2024
- Alison McCutcheon and colleagues, Effects of leadership and span of control on nurses' job satisfaction and patient satisfaction, Nursing Leadership 22(3), 2009
- Ruffin and colleagues, Understanding the impact of span of control on nurse managers and hospital outcomes, Journal of Healthcare Management 68(3), 2023
Last updated Oct 9, 2026


Fractional COO or embedded operations team? How to choose at Series A
The two models solve different problems: how to tell which one your company needs, and what each costs in time and control.

What operational systems successful fintech startups use: lessons from ten companies
Starling, Monzo, Qonto, bunq, Lunar, Pleo, Tide, Ramp, Mercury and Column scaled on four operating systems. Regulators' findings show what breaks when one of them lags behind growth.

What a revenue operations manager actually owns
Pipeline definitions, CRM hygiene, forecasting and the handoffs between marketing, sales and success. What the role covers, and how it differs from sales ops.