Good-better-best tiering
Good-better-best tiering sells one product in three packages, each with more capability and a higher price, so buyers sort themselves into the tier that fits their need.
Good-better-best tiering is a pricing structure that offers one product in three packages: a stripped-down entry tier, a core middle tier and a feature-rich top tier. Buyers pick by need and budget, and fences between tiers keep high-value buyers from trading down. Experiments on the compromise effect show that adding a top tier pulls more buyers toward the middle one.
- Origin
- Practice; no single originator documented. Modern account by Rafi Mohammed (HBR); economics of product lines by Michael Mussa and Sherwin Rosen, 1978 (theory); 2018 (HBR account)
- Level
- 201 · Tool
- Fits
- Startup, Small and mid-size, Scale-up
- Time to apply
- two to three weeks for a first tier design, including a survey to test it
- What you need
- a list of every feature, limit and service you sell today, with what each costs you to deliver · current plan or price data: who buys what, and at what price · ten to twenty customer conversations, or a survey panel, across your cheapest and most demanding buyers
Good-better-best tiering is a pricing structure that sells one product in three packages, each with more capability and a higher price than the one before. Buyers sort themselves: the careful buyer takes the entry package, the typical buyer the middle one and the demanding buyer pays for the top one.
Consultant Rafi Mohammed gave the approach its fullest modern account in a 2018 Harvard Business Review article and a book of the same name. In his version the good tier is a stripped-down option that attracts new, price-sensitive buyers, the better tier is the existing product, and the best tier is a feature-rich version for customers who want more. We found no primary source that says who first used the label. The economics underneath it are older: Michael Mussa and Sherwin Rosen showed in 1978 how a seller who cannot tell buyers apart can offer a quality-differentiated line and let customers allocate themselves along it.
Why three tiers pull buyers to the middle
Buyers tend to choose the middle option of three, a pattern called the compromise effect. Itamar Simonson described it in a 1989 paper, and he and Amos Tversky added extremeness aversion in 1992: an option gains appeal when it sits in the middle of the set and loses it when it sits at the edge.
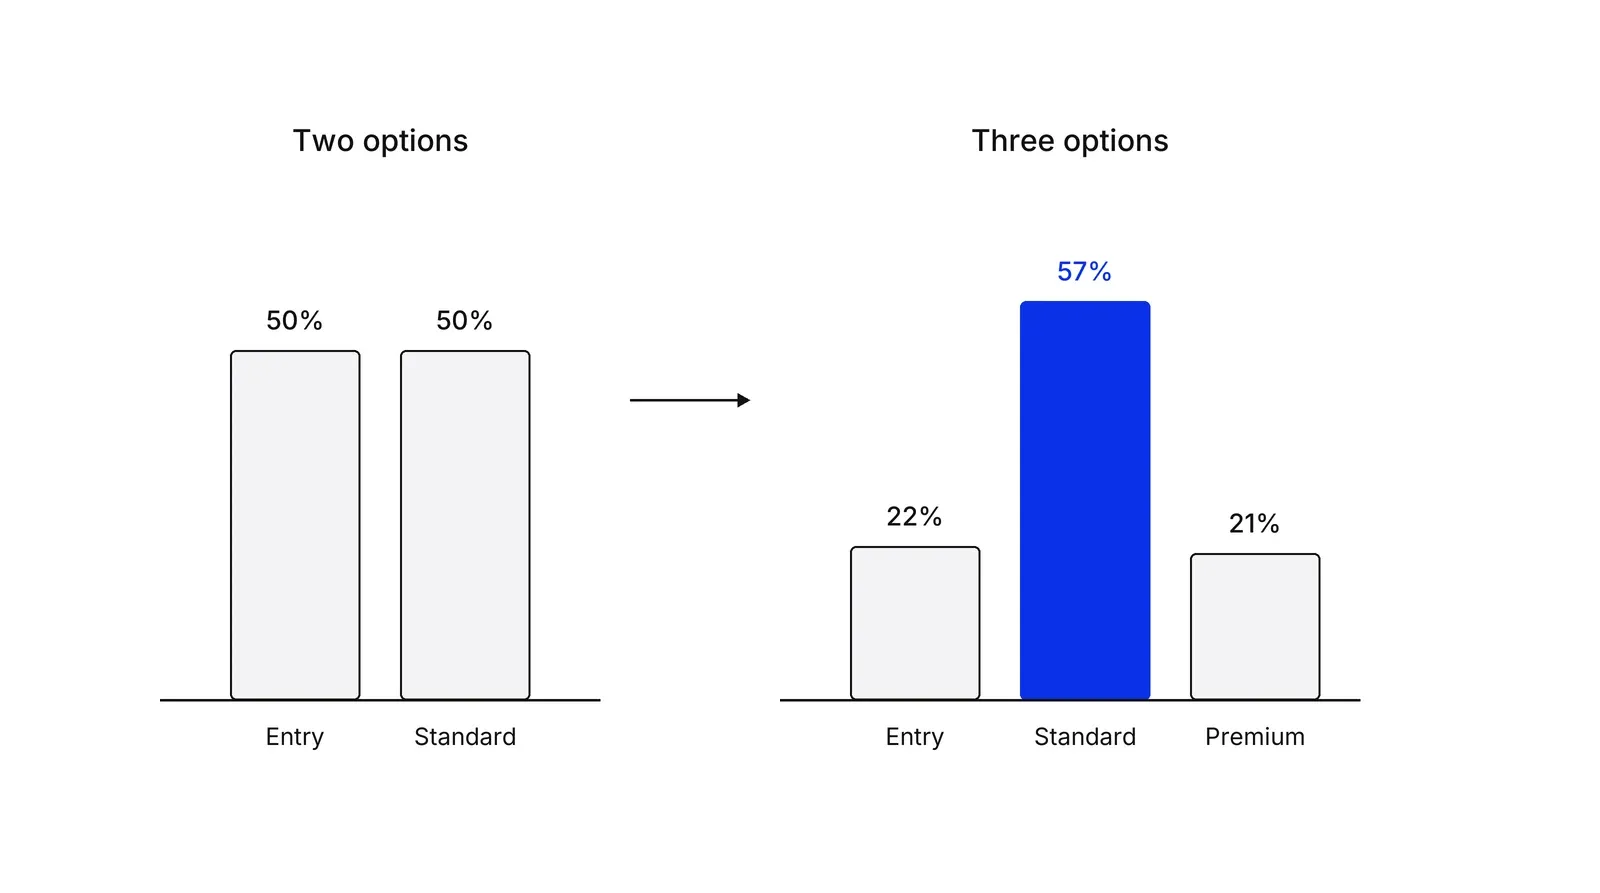
Their camera experiment shows the size of the shift. Two Minolta models drew half of choices each. Once a third, top-priced model joined the set, the middle camera took 57 percent, the cheapest fell to 22 percent and the new model took 21 percent.
Why it happens is still debated. Simonson’s account is that the middle option is easy to justify, and the effect was stronger in people who expected to explain their choice. Wernerfelt argued in 1995 that a rational shopper can read the menu as a signal of what the market offers. Prelec, Wernerfelt and Zettelmeyer estimated that this kind of inference accounted for about two-thirds of the average context effect in their experiments.
Treat the 57 percent as a direction, not a forecast. A 2016 meta-analysis of 142 experimental observations found that middle options win more often, with effect sizes that swing widely by research design, and weaker when the choice is a price-quality trade-off. Sharpe, Staelin and Huber found the same pull with fast-food drink sizes: consumption rose when the smallest size was dropped or a larger one added.
The nearby decoy effect is more contested. Frederick, Lee and Baskin found it mostly when options were described with numbers, and Huber, Payne and Puto replied that it holds when the original conditions are replicated. That dispute is about decoys, not about the pull of the middle.
Fences: what keeps buyers from trading down
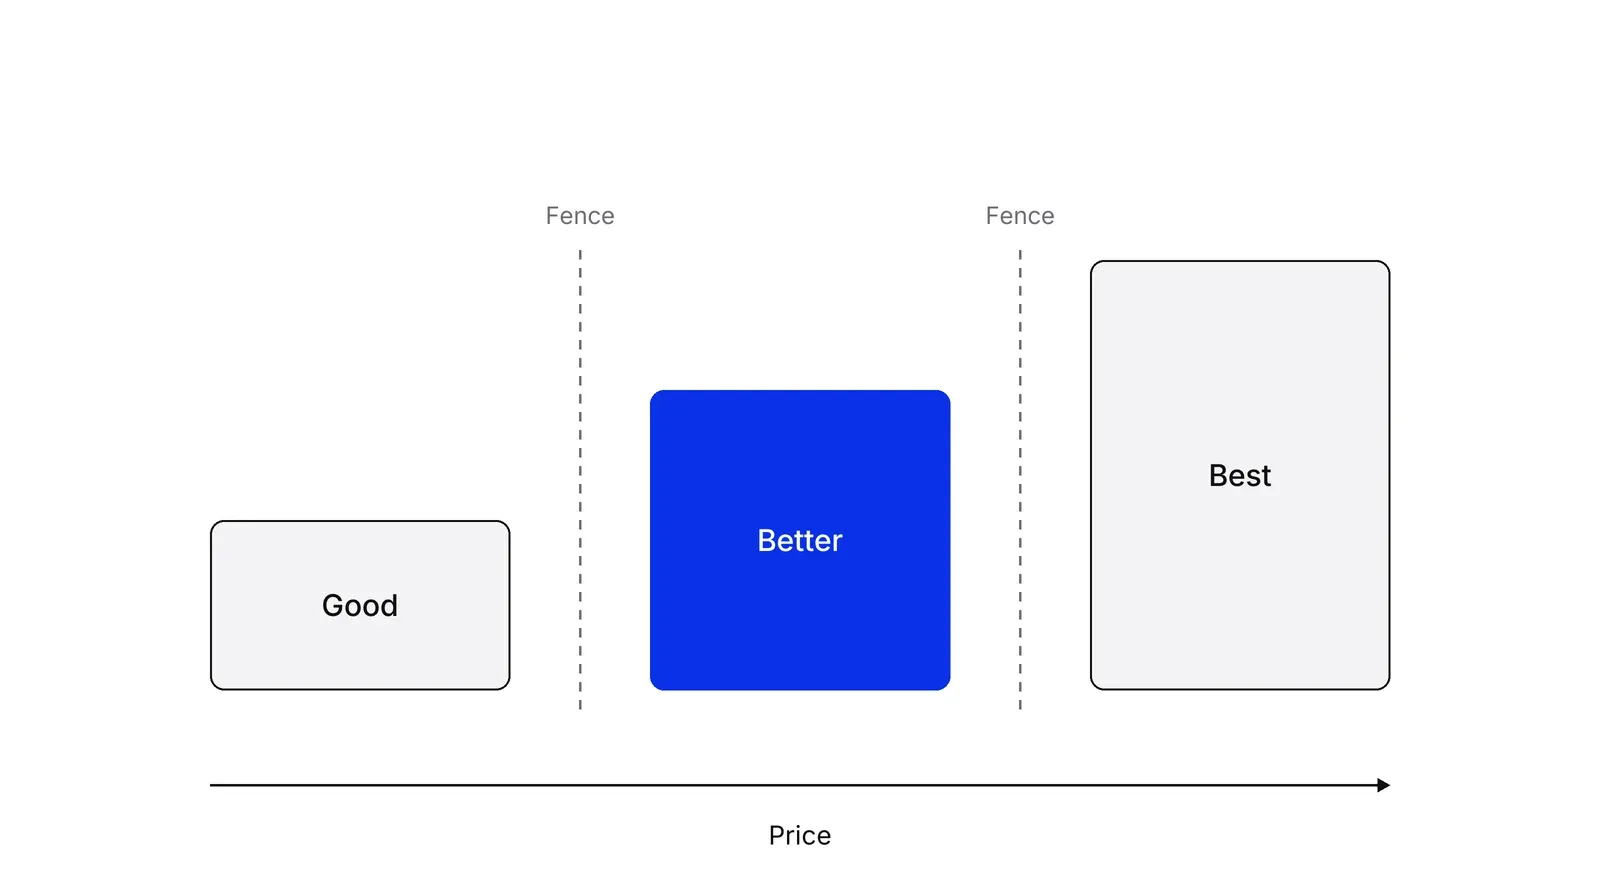
A fence is a feature or limit that makes a cheaper tier unattractive to a buyer who would pay more. Mohammed’s method centres on fence attributes that stop current customers from trading down from the existing offer, and without them the structure just cuts your own price.
Hal Varian’s 1999 paper, building on the Shapiro and Varian versioning article, lists the usual levers: delay, user interface, convenience, speed, flexibility, capability, features, comprehensiveness, support and deliberate annoyance. He notes that sellers often build the high-end product first and then degrade it to make the low-end version. A good fence matters a lot to the buyer you want in a higher tier and little to the buyer you want in a lower one.
| Tier | Job | Typical buyer | Example fences |
|---|---|---|---|
| Good | Win price-sensitive newcomers | Individual or very small team | Seat cap, volume cap, community support |
| Better | Carry the volume | The typical customer | Core integrations, standard support |
| Best | Capture the highest need | Large or regulated buyer | Audit trail, uptime commitment, onboarding |
Feature allocation and price steps
Rank features by how much each buyer group values them before you place any. MaxDiff gives a ranked list of features, and conjoint analysis shows what buyers trade off against price. Rooderkerk, van Heerde and Bijmolt built context effects into a conjoint model using digital camera data and found it predicted choices better, because a tier’s share depends on its neighbours.
Choosing which feature goes where is a real optimisation problem. Green and Krieger noted in 1985 that selecting an optimal product line is computationally prohibitive even for modest problems, so they evaluated heuristics. For a pricing page the practical version is simple: finish the middle tier first, strip it for Good, extend it for Best.
Price the middle tier next. The Van Westendorp survey gives the range buyers accept. Place Better inside it, then set Good and Best around it and test the resulting mix before launch.
When three is the wrong number
Three is a default, not a law. Simon-Kucher’s Joshua Bloom rejects good-better-best as a one-size-fits-all rule: it assumes one upgrade path, and he says some firms do better with two packages while others need four or five.
More options carry a risk, but a smaller one than folklore suggests. Iyengar and Lepper found that about 30% of shoppers facing six jams bought one, against 3% facing twenty-four. A later meta-analysis of 50 experiments found a mean effect near zero. A pricing page with four tiers is not doomed, but each added column has to correspond to a distinct buyer.
Tiering also differs from its neighbours. Freemium puts a free tier beneath Good. Bundling, as Stremersch and Tellis define it, sells two or more separate products in one package, whereas tiers stretch a single product. The wider design of guarantees, scarcity and terms sits in offer architecture.
A Growth Lab plan starts from the tier mix your pricing page produces today, then tests one fence or one price gap at a time.
How to apply Good-better-best tiering, step by step
- Choose what climbs. Pick the one thing that rises from tier to tier: seats, usage, capability or service level. A clinic membership climbs on included visits and same-day access, an invoicing tool on volume and approvals. Result: one sentence naming the axis the three tiers share.
- Describe the buyer of each tier. Write who takes Good (price-sensitive newcomer), Better (the typical customer) and Best (the buyer with the highest need). Use your price and usage data to size each group. Result: three short buyer profiles with a rough share of customers each.
- Allocate features and set fences. Rank features by how much each buyer group values them, using MaxDiff or interviews. Put the core in Better, strip it for Good, extend it for Best. Choose fences that matter a lot to high-value buyers and little to low-value ones. Result: a feature grid with one fence between each pair of tiers.
- Set the middle price first. Use a price sensitivity survey to find the acceptable range, then price Better inside it and place Good and Best around it. Result: three prices and a stated reason for each gap.
- Name and present the tiers. Give each tier a name that signals who it is for, show three columns with few rows, and mark the tier you want most buyers in. Result: a pricing page draft a customer can read in under a minute.
- Test the mix before launch. Run a choice-based conjoint or a live split test and read the share of buyers per tier, not only revenue. Result: a forecast of tier mix, with any tier under a few percent flagged for redesign.
- Review the mix quarterly. Track tier shares, downgrades and upgrades each quarter. A drifting mix means a fence has weakened or a price gap is off. Result: a short quarterly note listing the fences or prices to change.
Examples
The Minolta cameras, 1992
In a published experiment by Simonson and Tversky, two Minolta cameras at $169.99 and $239.99 each drew half of choices, per Simonson and Tversky. When a third, top-of-the-line model at $469.99 was added, the middle camera rose to 57 percent, the cheapest fell to 22 percent and the new model took 21 percent. The expensive camera barely sold, but it made the middle one look like the sensible choice.
A dental clinic membership
Illustrative, no real clinic implied. A clinic with 400 members offers Basic at $19 a month (two cleanings a year), Plus at $39 (adds X-rays and a discount on fillings) and Complete at $69 (adds same-day appointments and a whitening session). If 120 members take Basic, 220 take Plus and 60 take Complete, monthly revenue is $15,000 (120 at $19, 220 at $39 and 60 at $69). Same-day access is the fence: it matters to busy patients and costs the clinic little to protect.
A B2B invoicing tool
Illustrative arithmetic only. A software team sells Starter at $29, Team at $59 and Business at $149 a month. With 1,000 customers split 30%, 55% and 15%, average revenue per customer is $63.50. The team then asks which fence moves customers between tiers: invoice volume for Starter, approval workflows for Team, audit logs for Business. A tier chosen by under 3% of customers would be a candidate to merge or rebuild.
When to use it
Use it when your buyers differ in how much they need and how much they can pay, and one price leaves money on the table at both ends. It fits software, subscriptions, service plans and memberships, where the same core product can be stretched or stripped at low cost and customers can be sorted by a clear fence.
When not to use it
Skip it when buyers differ by industry, role or use case rather than by size and depth of need, because a single ladder misdescribes the product. A modular or usage-based structure fits better there. Also skip it before you know who your customers are: tiers built on guesses harden into a pricing page nobody wants to touch.
Common mistakes
- Adding a third tier because three looks right, with no buyer group for it, so almost nobody chooses it.
- Fencing with features customers do not value, which makes the limit feel arbitrary and invites complaints instead of upgrades.
- Setting tier prices from cost-plus arithmetic and skipping any test of how buyers will split across the three.
- Using the top tier only as a decoy, then discounting it in every deal so it stops anchoring anything.
- Leaving the pricing page untouched for years while usage patterns, costs and competitor plans shift under the fences.
FAQ
What is good better best pricing?
It is a tiered pricing structure with three packages of one product. Good is a stripped-down entry option, better is the core offer and best adds the most capability for the highest price. Rafi Mohammed described the approach in Harvard Business Review in 2018. Buyers choose the tier that fits their need and budget.
How many pricing tiers should you have?
Three is a common default, not a rule. Simon-Kucher's Joshua Bloom says three is not always optimal: some firms do better with two packages, and others with a single upgrade path need four or five. A meta-analysis of choice overload found its average effect near zero, so more tiers do not automatically hurt.
What is the compromise effect in pricing?
It is the tendency to choose the middle option of a set. Itamar Simonson identified it in 1989. In a 1992 study by Simonson and Tversky, adding a top-priced camera lifted the middle camera from half of choices to 57 percent, per the study. Extremeness aversion, the dislike of extreme options, is the proposed reason.
What is a fence in tier pricing?
A fence is a feature or limit that stops a buyer who would pay more from taking a cheaper tier. Examples are seat caps, usage limits, support level or speed. Hal Varian lists versioning dimensions such as delay, capability, features, technical support and annoyance. A good fence matters to high-value buyers and little to the rest.
How do you set the price of the middle tier?
Start from the range of prices buyers accept, for example with a Van Westendorp survey, and price the middle tier inside it. Then set Good and Best around it and test the tier mix with a choice-based conjoint. The compromise effect means the middle tier's share depends on what sits above and below it.
Sources
- Rafi Mohammed, The Good-Better-Best Approach to Pricing, Harvard Business Review, September-October 2018
- Rafi Mohammed, The Good-Better-Best Approach to Pricing, Harvard Business School Publishing, 2018 (book listing)
- Michael Mussa, Sherwin Rosen, Monopoly and Product Quality, Journal of Economic Theory 18(2), 1978
- Hal R. Varian, Market Structure in the Network Age, University of California, Berkeley, 1999
- Carl Shapiro, Hal R. Varian, Versioning: The Smart Way to Sell Information, Harvard Business Review, November-December 1998
- Itamar Simonson, Choice Based on Reasons: The Case of Attraction and Compromise Effects, Journal of Consumer Research 16(2), 1989
- Itamar Simonson, Amos Tversky, Choice in Context: Tradeoff Contrast and Extremeness Aversion, Journal of Marketing Research 29(3), 1992
- Birger Wernerfelt, A Rational Reconstruction of the Compromise Effect, Journal of Consumer Research 21(4), 1995
- Drazen Prelec, Birger Wernerfelt, Florian Zettelmeyer, The Role of Inference in Context Effects, Journal of Consumer Research 24(1), 1997
- Ran Kivetz, Oded Netzer, V. Srinivasan, Alternative Models for Capturing the Compromise Effect, Journal of Marketing Research 41(3), 2004
- Kathryn Sharpe, Richard Staelin, Joel Huber, Using Extremeness Aversion to Fight Obesity, Journal of Consumer Research 35(3), 2008
- Neumann, Böckenholt, Sinha, A Meta-Analysis of Extremeness Aversion, Journal of Consumer Psychology 26(2), 2016
- Robert Rooderkerk, Harald van Heerde, Tammo Bijmolt, Incorporating Context Effects into a Choice Model, Journal of Marketing Research 48(4), 2011
- Shane Frederick, Leonard Lee, Ernest Baskin, The Limits of Attraction, Journal of Marketing Research 51(4), 2014
- Joel Huber, John Payne, Christopher Puto, Let's Be Honest About the Attraction Effect, Journal of Marketing Research 51(4), 2014
- Timothy Heath, Subimal Chatterjee, Asymmetric Decoy Effects on Lower-Quality Versus Higher-Quality Brands, Journal of Consumer Research, 1995
- Sheena Iyengar, Mark Lepper, When Choice is Demotivating, Journal of Personality and Social Psychology 79(6), 2000
- Benjamin Scheibehenne, Rainer Greifeneder, Peter Todd, Can There Ever Be Too Many Options? Journal of Consumer Research 37(3), 2010
- Paul Green, Abba Krieger, Models and Heuristics for Product Line Selection, Marketing Science 4(1), 1985
- Stefan Stremersch, Gerard Tellis, Strategic Bundling of Products and Prices, Journal of Marketing 66(1), 2002
- Joshua Bloom (Simon-Kucher), The A-Z of Pricing Projects, Monetizely book excerpt
Last updated Oct 9, 2026


Marketing agency or growth system: when a company outgrows its agency
An agency is the right call while the founder still runs most of the company. Once the business starts copying itself into new locations or markets, it needs a system that sets goals, tests hypotheses and owns the result.

Why healthcare marketing agencies stall: the short, mid and long wins model we use with clinics
Most agencies own the click and nobody owns the front desk. How we structure clinic work in three horizons, the research behind each one, and one year of results.

Why channel tests stall after month three
Most paid channel tests do not end with a decision. They end when the budget runs out, the attribution model changes, or everyone quietly stops looking at the dashboard.