Geo-lift testing
Geo-lift testing measures what an ad channel adds by changing spend in some cities or regions and comparing their sales with a counterfactual built from regions where nothing changed.
A geo-lift test is an experiment that changes advertising in selected cities or regions and compares their sales with a counterfactual built from untouched regions. The gap is the lift the ads caused. It works without user tracking and covers offline sales. Meta's GeoLift package and Google's time-based regression and Meridian GeoX are the common tools for designing and reading one.
- Origin
- Jon Vaver and Jim Koehler (Google) for geo experiments; Alberto Abadie and Javier Gardeazabal for synthetic control; Meta Marketing Science for GeoLift, 2003 synthetic control; 2011 geo experiments; 2017 time-based regression
- Level
- 301 · Advanced
- Fits
- Scale-up, Enterprise
- Time to apply
- one to two weeks of design and power analysis, then a test of at least 15 days with daily data or four to six weeks with weekly data
- What you need
- daily sales or conversions by city or region, with no gaps, covering at least four to five times the planned test length · 20 or more regions you can target separately in the ad platform · spend data by region if you plan to switch existing spend off or raise it · agreement that prices, promotions and other media stay the same in all regions during the test
A geo-lift test is an experiment that changes advertising in some cities or regions and compares their sales with a counterfactual: an estimate of what those regions would have sold without the change, built from regions where nothing changed. The gap is the lift. Because it reads sales from your own data by region, it needs no cookies or user IDs and covers shops, call centres and apps alike.
Google researchers Jon Vaver and Jim Koehler set out the modern form in a 2011 paper on geo experiments. The statistics behind most current tools come from economics: Alberto Abadie and Javier Gardeazabal introduced synthetic control in a 2003 study of the Basque Country. Meta’s open-source GeoLift and Google’s Meridian GeoX package both approaches for marketers. This page goes into the method; the wider choice between user holdouts, geo tests and switch-off tests is on the incrementality testing page.
Which kind of geo test do you need?
The test type follows from the question. Google’s GeoX documentation names three, and each changes spend in the test regions while the control regions stay at business as usual.
| Type | What changes in test regions | Question it answers | Watch out for |
|---|---|---|---|
| Holdback | New channel or campaign runs only there | Is a new channel worth scaling? | Control regions never get the new channel during the test |
| Go-dark | Existing spend switched off | What would we lose if we stopped? | Revenue risk; needs enough current spend to show a signal |
| Heavy-up | Extra spend on top of current | What does the next dollar buy? | Costs extra budget; measures marginal return only |
Go-dark is the usual choice for defending brand search. Heavy-up is the fallback when current spend is too low for a go-dark test to detect anything, according to Google.
How is the counterfactual built?
Four families of estimators do most of the work, and they differ mainly in how many regions they need.
Vaver and Koehler’s geo-based regression compares each region’s test-period sales with its pretest sales across many randomly assigned regions. It loses power when there are only a few regions, so Jouni Kerman, Peng Wang and Vaver proposed time-based regression in 2017. TBR fits one line on the pretest period, predicting the average of the test regions from the average of the controls, then uses it to forecast the counterfactual day by day. Both methods were released in Google’s GeoexperimentsResearch R package, archived in 2022 and marked as not an official Google product.
Synthetic control builds the counterfactual from a weighted blend of control regions chosen so that the blend tracks the test regions closely before launch. GeoLift uses the augmented version by Eli Ben-Michael, Avi Feller and Jesse Rothstein, which adds a bias correction for imperfect fit. Trimmed match, from Aiyou Chen and Timothy Au, pairs regions, randomizes within each pair and estimates the return with a trimmed mean, so the most extreme pairs drop out. Their paper in the Annals of Applied Statistics built it for tests with a small number of very different regions, and Google has applied it in advertiser studies.
| Method | Regions needed | Main tool | Key assumption |
|---|---|---|---|
| Geo-based regression | Many | GeoexperimentsResearch | Random assignment across many regions |
| Time-based regression | Few, even one pair | GeoexperimentsResearch, Meridian GeoX | Pretest relationship holds during the test |
| Synthetic control | A pool of 20 or more | GeoLift | A weighted blend can match the test regions |
| Trimmed match | Pairs | trimmed_match | Randomized pairs; outliers trimmed |
Synthetic control in plain words
Synthetic control is a method that estimates what a treated unit would have done by mixing untreated units. In Abadie, Diamond and Hainmueller’s study of California’s tobacco program, a synthetic California made of other states showed that by 2000 annual cigarette sales per person were about 26 packs lower than they would have been. Susan Athey and Guido Imbens called the approach arguably the most important innovation in the evaluation literature of the previous fifteen years.
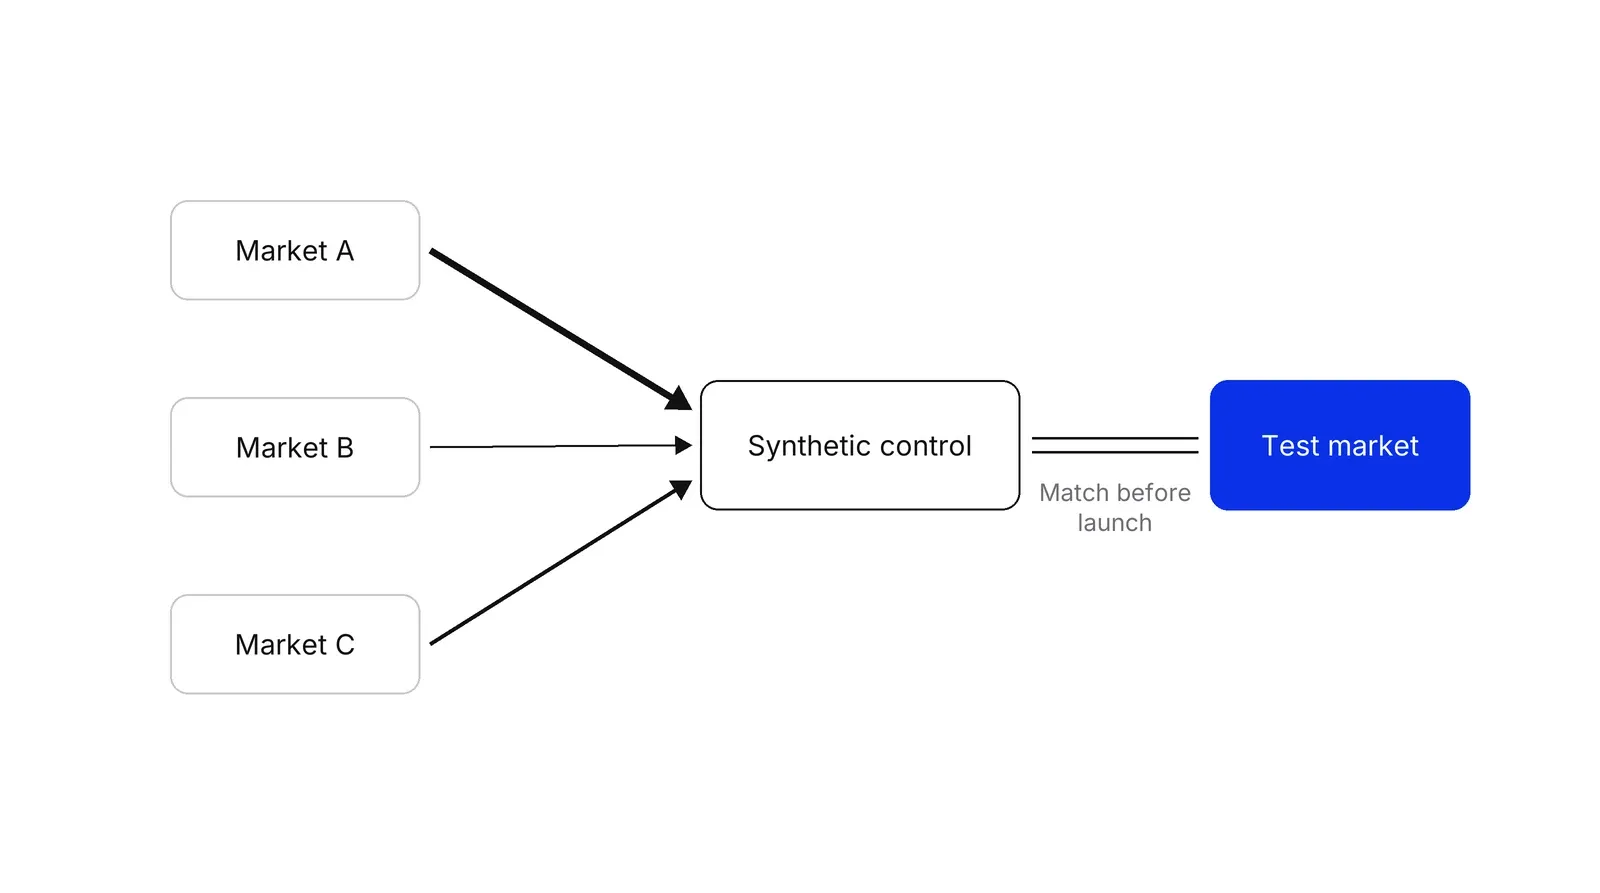
Abadie’s 2021 guide in the Journal of Economic Literature lists conditions that translate directly to marketing. Small effects are hard to see when the outcome is volatile. The donor pool, the set of control regions, should leave out regions hit by their own shocks, such as a store opening. People must not react before the change starts. And spillover must be handled: a control city next to a test city may see its ads.
One condition matters most for market selection. When a unit is extreme, no weighted average of other units can reproduce it, and the full text says the conventional estimator should not be used then. Your largest city is that unit, so it belongs in the control pool or out of the test.
How do you choose the test markets?
Let the history choose. GeoLift’s market selection simulates tests on past data for many candidate sets of regions and ranks them by detectable effect, power and pre-launch fit; its walkthrough also reports the budget each option needs. Meridian GeoX clusters regions by the shape of their KPI series (four clusters by default) and randomizes within clusters, then rejects designs that fail simulated A/A tests.
When full randomization is impractical, Tim Au’s matched markets method searches for group assignments that meet TBR’s assumptions under the advertiser’s constraints. A newer Google design, supergeos, merges regions into larger units so pairs match better.
Power analysis comes before launch
A power analysis tells you the smallest lift a given design can detect. GeoX writes the minimum detectable effect as the standard error of the lift times the sum of two z-values (one for significance, one for power), divided by baseline conversions. In practice that means noisier regions or shorter tests raise the bar.
GeoLift’s methodology page gives the reason to do this first: geo tests often chase small effects. Randall Lewis and Justin Rao showed how small, finding a median confidence interval on return over 100 percentage points wide across 25 large ad experiments. If the detectable lift is bigger than anything the channel could plausibly produce, add regions, run longer or switch to heavy-up. The minimum detectable effect page covers the arithmetic.
How long should the test and the pre-period be?
GeoLift’s best practices give the numbers most teams start from: at least 15 days with daily data, four to six weeks with weekly data, and at least one full purchase cycle. The pre-period should be four to five times the test length, with 25 or more periods and 20 or more regions, ideally a full 52 weeks to capture seasonality.
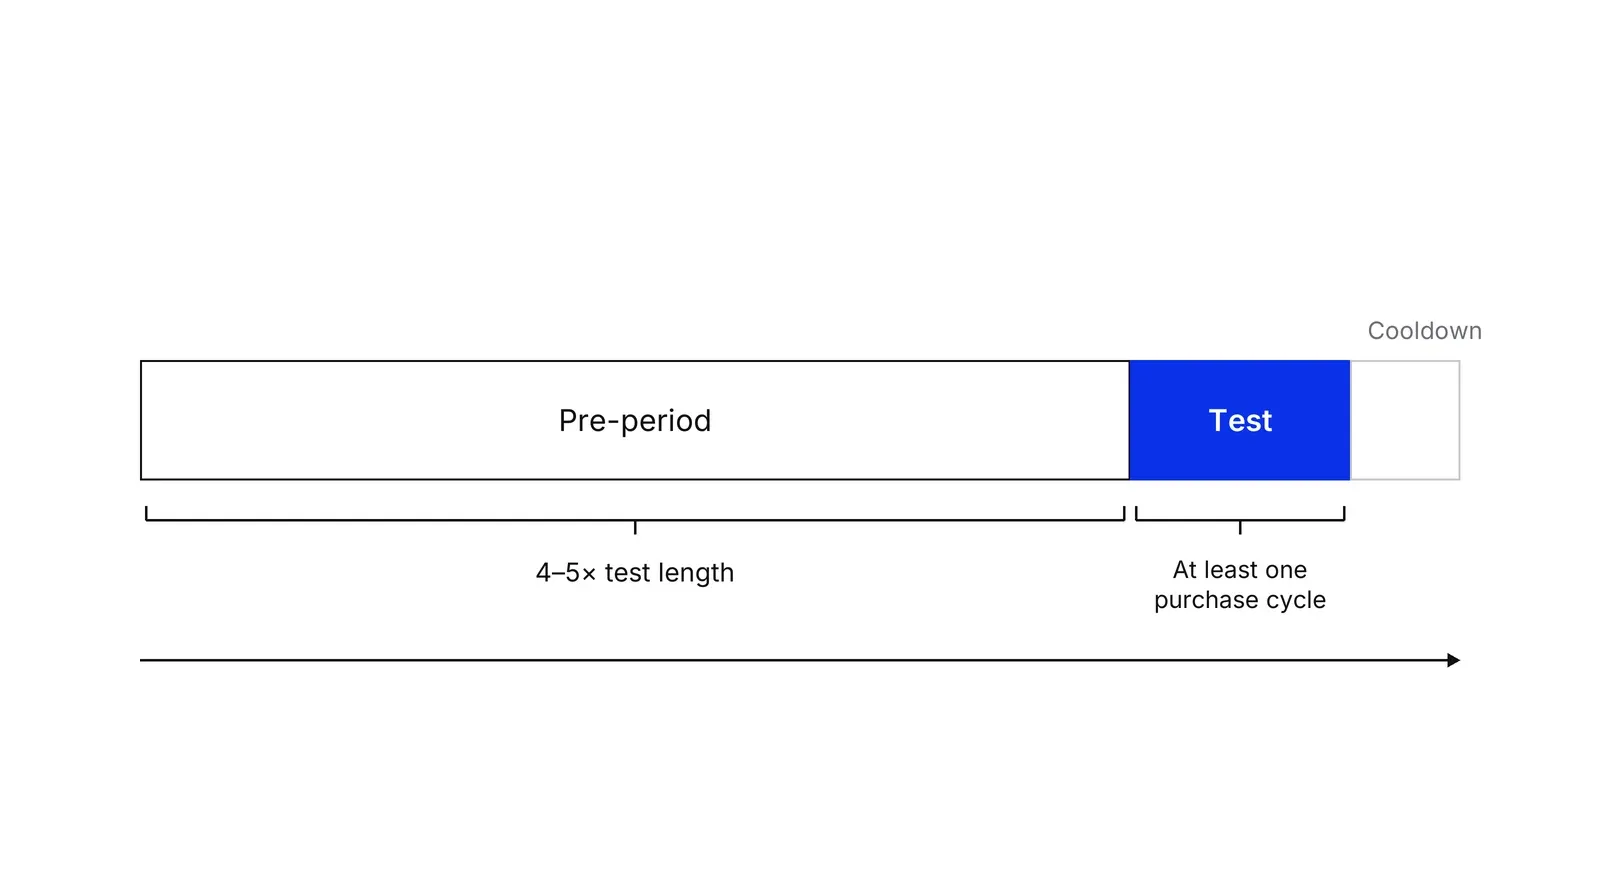
GeoX adds an optional cooldown after the test so delayed purchases are counted. For a channel you want to track all year, Vaver and Koehler’s multiple-test-period design switches regions between test and control across periods and pools the results, which reaches the same precision with a smaller or shorter change in spend.
Reading the result
Read the lift with placebo inference. GeoX reruns the analysis on many valid placebo designs where nothing happened and asks how extreme the real result is among them. A result inside the placebo spread is not a result. The number then goes to finance as incremental cost per acquisition or iROAS, and into a marketing mix model as a calibration point. A workable rhythm is one geo or holdout test per large channel each quarter, with the result changing the budget split, the way a Growth Lab experiment calendar is built.
How to apply Geo-lift testing, step by step
- Pick the test type and the decision. Choose holdback for a new channel, go-dark to check spend you already run, or heavy-up to see what extra budget would add. Write the decision the result drives, for example: if incremental cost per order is above 40, cut the channel by a third. Result: the test type, the KPI and a threshold.
- Prepare clean regional data. Pull daily KPI by region for the last year, with every region present on every day. Remove regions that had a store opening, an outage or a local campaign in the period. Result: a balanced panel of regions and days, and a list of excluded regions with reasons.
- Select markets and size the test. Run the market selection and power analysis in GeoLift or Meridian GeoX on that history. Compare candidate sets of test regions by detectable effect, fit before launch and budget needed. Keep your single largest market out of the test group. Result: test regions, control pool, test length, budget and the minimum detectable lift.
- Launch and leave it alone. Change spend only in the test regions, on the agreed date, and log every other change in any region. Do not stop early because the curve looks good. Result: a test that ran its planned length, and a change log.
- Read the lift with its uncertainty. Estimate the counterfactual from the control regions, take the gap as incremental conversions, and divide spend by it for incremental cost per acquisition, or incremental revenue by spend for iROAS. Report the interval and p-value from placebo or permutation inference. Result: lift, iROAS or incremental CPA, each with an interval.
- Use it and schedule the next one. Change the budget as agreed and feed the result into your marketing mix model as a calibration point. Rotate which regions are treated in the next test. Result: a budget change and a dated plan for the next test.
Examples
Meta's GeoLift walkthrough
The GeoLift documentation walks through a test on simulated daily data for 40 US cities over 90 pre-test days. The market selection ranks candidate city sets and picks Chicago and Portland for a 15-day test, estimating $64,563.75 of spend for a well-powered test at a cost per incremental conversion of 7.50. A 10-day version was cheaper at $43,646.25 but was not chosen. The readout shows a 5.4% lift, 4,667 incremental units and a p-value of 0.01.
California's tobacco program, the method's best-known case
Alberto Abadie, Alexis Diamond and Jens Hainmueller used synthetic control to judge Proposition 99, a tobacco control program California began in 1988. They built a synthetic California from a weighted mix of other states, leaving out states that ran large tobacco programs or raised tobacco taxes in the period. By 2000, annual per-capita cigarette sales in California were about 26 packs lower than the synthetic version predicted.
A payments app testing paid social in regions
Illustrative, no real company implied. A payments app sells in 48 regions and wants to know what paid social adds to funded accounts. History shows daily accounts are stable and the power analysis says a 10% lift is detectable in 6 test regions over 21 days. It raises paid social spend by 30,000 in those regions. Funded accounts there end 900 above the counterfactual, so the extra spend cost 33 per incremental account, under the 40 threshold set before launch.
When to use it
Use it when user-level holdouts are not available or not allowed, when sales happen offline or in apps that tracking cannot see, when you need one test that covers several channels at once, or when you want a calibration point for a marketing mix model. It suits businesses that sell in many regions with steady daily volume.
When not to use it
Skip it when you sell in only a handful of regions or one dominant city, when daily sales are so volatile that the power analysis cannot detect any realistic lift, when regions overlap heavily through commuting or delivery, or when other teams cannot keep prices and promotions the same across regions for the test.
Common mistakes
- Launching without a power analysis, then reading a flat result as proof the channel does nothing when the test could not have seen the effect.
- Putting the largest market in the test group. No weighted mix of smaller regions can reproduce it, so the counterfactual is poor.
- Using a pre-period shorter than the test or one that includes a structural break such as a price change or a new store.
- Running a local promotion, TV flight or price change in only some regions during the test.
- Ignoring spillover: people in a control city see ads aimed at a nearby test city, or travel there to buy.
FAQ
What is a geo-lift test?
It is an experiment that changes advertising in some regions and compares their sales with what those regions would have done without the change, estimated from regions that stayed the same. The difference is the incremental lift. It does not need user-level tracking, so it works for offline sales and privacy-restricted categories.
How many markets do you need for a geo-lift test?
Meta's GeoLift best practices ask for 20 or more geographic units and at least 25 pre-treatment periods. With fewer regions, Google's time-based regression and matched-market designs can still work, but the detectable effect grows. Use the finest level you can target, such as cities or postal areas.
How long should a geo-lift test run?
GeoLift's best practices set a minimum of 15 days with daily data or four to six weeks with weekly data, and the test should cover at least one purchase cycle. The pre-period should be four to five times the test length. The power analysis then tells you whether that duration can detect the lift you expect.
What is the difference between GeoLift and Conversion Lift?
Conversion Lift randomizes individual people inside the ad platform, which gives more statistical power. GeoLift randomizes regions and reads sales from your own data, so it works where user-level tests are not possible. Meta's documentation recommends people-based tests where feasible and geo tests otherwise.
Synthetic control or difference-in-differences: which one for geo tests?
Difference-in-differences assumes test and control regions would have moved in parallel. Synthetic control weights control regions so their combination tracks the test regions before launch, which relaxes that assumption. Synthetic difference-in-differences, published in 2021, combines both ideas and its authors report it performs better than either in their tests.
Sources
- Jon Vaver, Jim Koehler, Measuring Ad Effectiveness Using Geo Experiments, Google, 2011
- Jon Vaver, Jim Koehler, Measuring Ad Effectiveness Using Geo Experiments, full text, Google Research
- Jon Vaver, Jim Koehler, Periodic Measurement of Advertising Effectiveness Using Multiple-Test-Period Geo Experiments, Google, 2012
- Jouni Kerman, Peng Wang, Jon Vaver, Estimating Ad Effectiveness Using Geo Experiments in a Time-Based Regression Framework, Google, 2017
- Tim Au, A Time-Based Regression Matched Markets Approach for Designing Geo Experiments, Google, 2018
- Google, GeoexperimentsResearch R package (archived)
- Aiyou Chen, Timothy C. Au, Robust Causal Inference for Incremental Return on Ad Spend with Randomized Paired Geo Experiments, Annals of Applied Statistics 16(1), 2022
- Aiyou Chen, Timothy C. Au, Robust Causal Inference for iROAS, arXiv preprint
- Google, trimmed_match: analysis and design of randomized paired geo experiments
- Aiyou Chen, Nick Doudchenko, Shunhua Jiang, Cliff Stein, Bicheng Ying, Supergeo Design: Generalized Matching for Geographic Experiments, arXiv, 2023
- Google for Developers, Meridian GeoX introduction
- Google for Developers, Meridian GeoX, Types of experiments
- Google for Developers, Meridian GeoX, Design methodology
- Google for Developers, Meridian GeoX, Time-based regression
- Google for Developers, Meridian GeoX, Robust inference
- Meta Open Source, GeoLift documentation, Introduction
- Meta Open Source, GeoLift documentation, Methodology
- Meta Open Source, GeoLift documentation, Best practices
- Meta Open Source, GeoLift documentation, Walkthrough
- Meta Open Source, GeoLift repository on GitHub
- Alberto Abadie, Javier Gardeazabal, The Economic Costs of Conflict: A Case Study of the Basque Country, American Economic Review 93(1), 2003
- Alberto Abadie, Alexis Diamond, Jens Hainmueller, Synthetic Control Methods for Comparative Case Studies: Estimating the Effect of California's Tobacco Control Program, Journal of the American Statistical Association 105(490), 2010
- National Bureau of Economic Research, Working Paper 12831, Synthetic Control Methods for Comparative Case Studies
- Alberto Abadie, Alexis Diamond, Jens Hainmueller, Comparative Politics and the Synthetic Control Method, American Journal of Political Science 59(2), 2015
- Alberto Abadie, Using Synthetic Controls: Feasibility, Data Requirements, and Methodological Aspects, Journal of Economic Literature 59(2), 2021
- Alberto Abadie, Using Synthetic Controls, full text, NBER Summer Institute copy
- Susan Athey, Guido Imbens, The State of Applied Econometrics: Causality and Policy Evaluation, arXiv, 2016
- Susan Athey, Guido Imbens, The State of Applied Econometrics, Journal of Economic Perspectives 31(2), 2017
- Eli Ben-Michael, Avi Feller, Jesse Rothstein, The Augmented Synthetic Control Method, Journal of the American Statistical Association 116(536), 2021
- Dmitry Arkhangelsky, Susan Athey, David Hirshberg, Guido Imbens, Stefan Wager, Synthetic Difference-in-Differences, American Economic Review 111(12), 2021
- Kay H. Brodersen et al., Inferring causal impact using Bayesian structural time-series models, Annals of Applied Statistics 9(1), 2015
- Randall A. Lewis, Justin M. Rao, The Unfavorable Economics of Measuring the Returns to Advertising, Quarterly Journal of Economics 130(4), 2015
Last updated Oct 9, 2026


Marketing agency or growth system: when a company outgrows its agency
An agency is the right call while the founder still runs most of the company. Once the business starts copying itself into new locations or markets, it needs a system that sets goals, tests hypotheses and owns the result.

Why healthcare marketing agencies stall: the short, mid and long wins model we use with clinics
Most agencies own the click and nobody owns the front desk. How we structure clinic work in three horizons, the research behind each one, and one year of results.

Why channel tests stall after month three
Most paid channel tests do not end with a decision. They end when the budget runs out, the attribution model changes, or everyone quietly stops looking at the dashboard.