Needs-based segmentation (cluster analysis)
Needs-based segmentation groups customers by what they want from a product, using cluster analysis or latent class models on survey data, so the segments come from the data instead of from assumptions.
Needs-based segmentation is a research method that groups customers by the needs or benefits they care about, not by who they are. Respondents rate or rank a list of needs, then cluster analysis (usually k-means) or a latent class model sorts them into groups with similar answers. The analyst chooses the number of segments, tests that they reappear in resampled data, and only then profiles them.
- Origin
- Russell Haley (benefit segmentation); Girish Punj and David Stewart (cluster analysis method for marketing), 1968; 1983
- Level
- 401 · Expert
- Fits
- Scale-up, Enterprise
- Time to apply
- six to ten weeks: two to write the needs list and survey, two to four in field, two for analysis and profiling
- What you need
- a list of 15 to 30 needs or benefits written in customers' words, usually from 20 or more interviews · a survey sample of roughly 70 to 100 respondents per need you plan to cluster on · an analyst who can run k-means or latent class models in R, Python or a tool such as Latent GOLD · one business decision the segments must inform
Needs-based segmentation is a way of finding customer segments in data instead of drawing them up in a meeting. You ask a sample of the market how much each of a list of needs matters, then a clustering algorithm groups people whose answers look alike. The segments that come out are defined by what people want, and only afterwards described by who they are.
The idea goes back to Russell Haley’s benefit segmentation of 1968, which argued that descriptive factors predict buying poorly and that the benefits people seek are “the basic reasons for the existence of true market segments.” The statistics came a little later. Girish Punj and David Stewart’s 1983 review in the Journal of Marketing Research set out how marketers should run cluster analysis, and Michel Wedel and Wagner Kamakura’s textbook added finite mixture models. The most practical modern guide is Sara Dolnicar, Bettina Grün and Friedrich Leisch’s open-access book, which turns the whole process into ten steps.
This page covers the analysis. For the wider choice of segmentation bases and the tests a segment must pass, see market segmentation.
What goes into the model
Only needs go into the clustering. These are statements of what a customer wants to achieve or avoid, scored for importance by each respondent. Age, industry, spend and channel stay out, and are used later to describe the segments and find them in the CRM.
The reason is practical. If demographics go in, the algorithm groups people by demographics, and you are back to the segments you already had. Tony Ulwick of Strategyn makes the case that traits such as age or education “will nearly always fail to explain” why customers have different unmet needs. His outcome-based method surveys people on the importance and satisfaction of each desired outcome, then clusters on the gaps.
How you measure importance matters too. Rating scales let people call everything important, which flattens the differences clustering depends on. Sawtooth Software reports that latent class models on MaxDiff data are “much more successful for finding needs-based segments” than clustering rating-scale data.
How k-means finds the groups
K-means is the default algorithm. You pick a number of segments, k. The algorithm places k centre points, assigns each respondent to the nearest one, moves each centre to the average of its members, and repeats until nothing changes. In 1967 J. MacQueen gave the procedure its name, k-means.
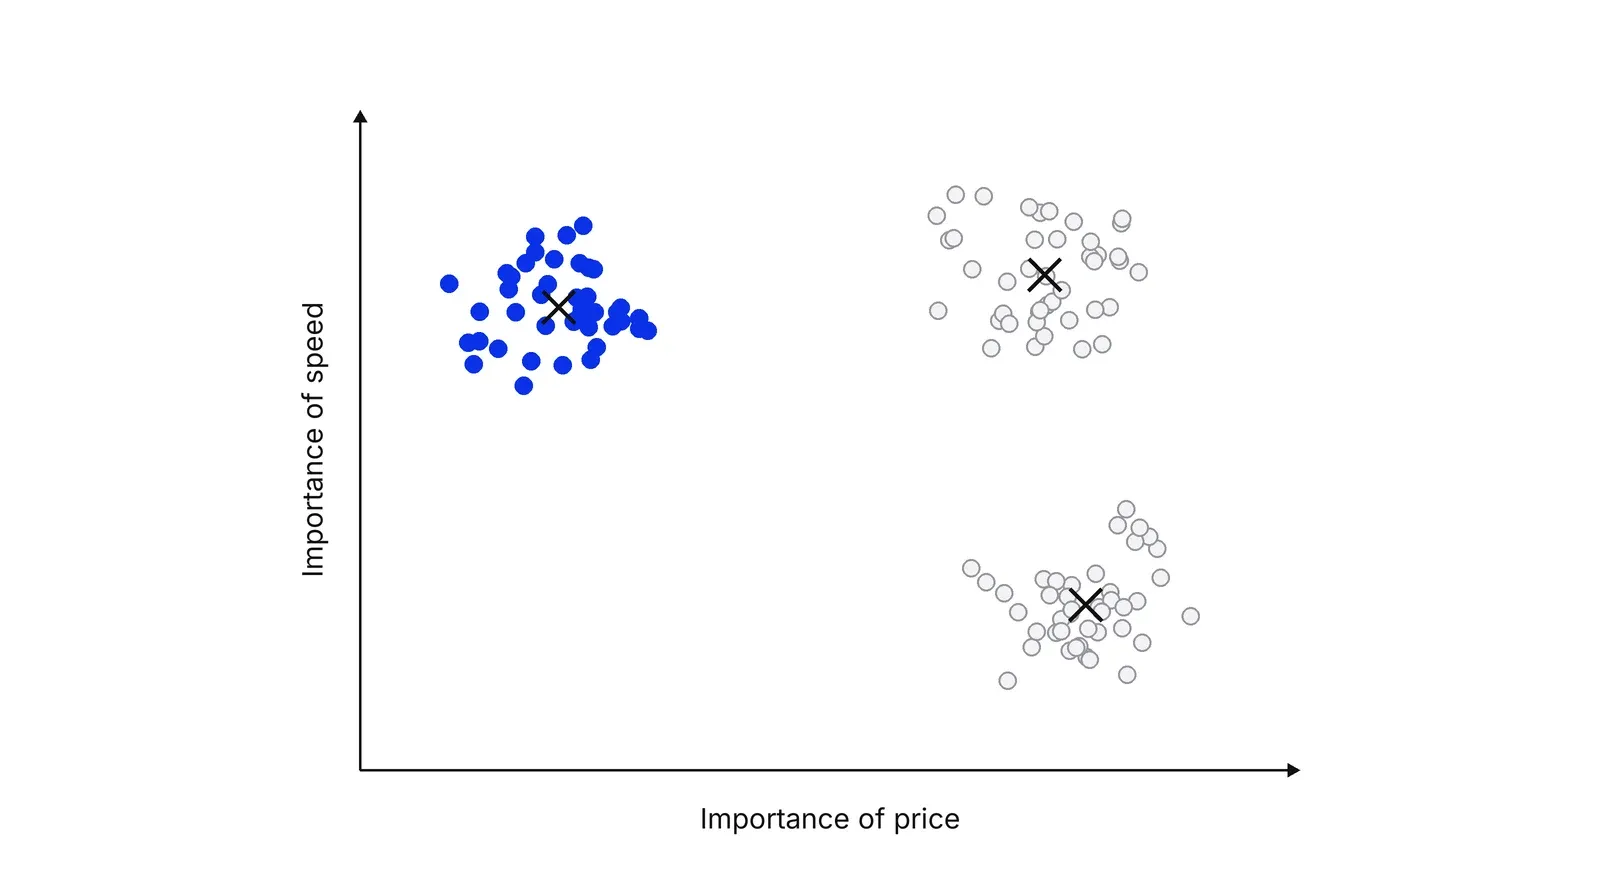
Real surveys have 15 to 30 dimensions, not two, but the logic is the same. Three cautions follow from how the algorithm works. It can stop at a poor answer depending on where the centres start, so the scikit-learn guide advises several runs and smarter seeding such as k-means++. It prefers round, similar-sized groups. And it is sensitive to scale, so variables measured on different ranges must be standardised first. Douglas Steinley’s 50-year review covers these choices in depth.
Punj and Stewart recommended two stages: find a starting solution with Ward’s minimum variance method, a hierarchical procedure from 1963, then refine it with an iterative method such as k-means. Dolnicar’s team adds that hierarchical methods suit small samples and that k-means is preferred above about 1,000 respondents.
Latent class: a model instead of a distance
Latent class analysis, also called finite mixture modelling, assumes the sample is a mix of hidden groups and estimates each group’s size and answer pattern. Each respondent gets a probability of belonging to every segment, not a hard label.
In a simulation where the true groups were known, Magidson and Vermunt found latent class misclassified 1.3% of 300 cases, against 8% for k-means and 5% for k-means on standardised variables. Latent class also accepts categorical, ordinal and continuous variables together and needs no standardisation. The trade-off is cost: it needs specialist software and takes longer to explain to a board.
| Method | How it groups | Best for | Watch out for |
|---|---|---|---|
| Hierarchical (Ward) | Merges the closest people step by step | Samples under about 1,000, starting points | Slow and hard to read on large data |
| K-means | Assigns each person to the nearest centre | Large samples, a fast first pass | Random starts, round clusters, scaling |
| Latent class | Estimates hidden groups and membership probabilities | Mixed data types, choice data such as MaxDiff | Software, run time, harder to explain |
How many segments?
No single rule picks k. Run the analysis for each k from 2 to about 8 and compare several measures.
The elbow chart plots the spread within segments against k and looks for the bend where extra segments stop helping. Dolnicar’s team warns it helps only when segments are well separated, which survey data often are not.
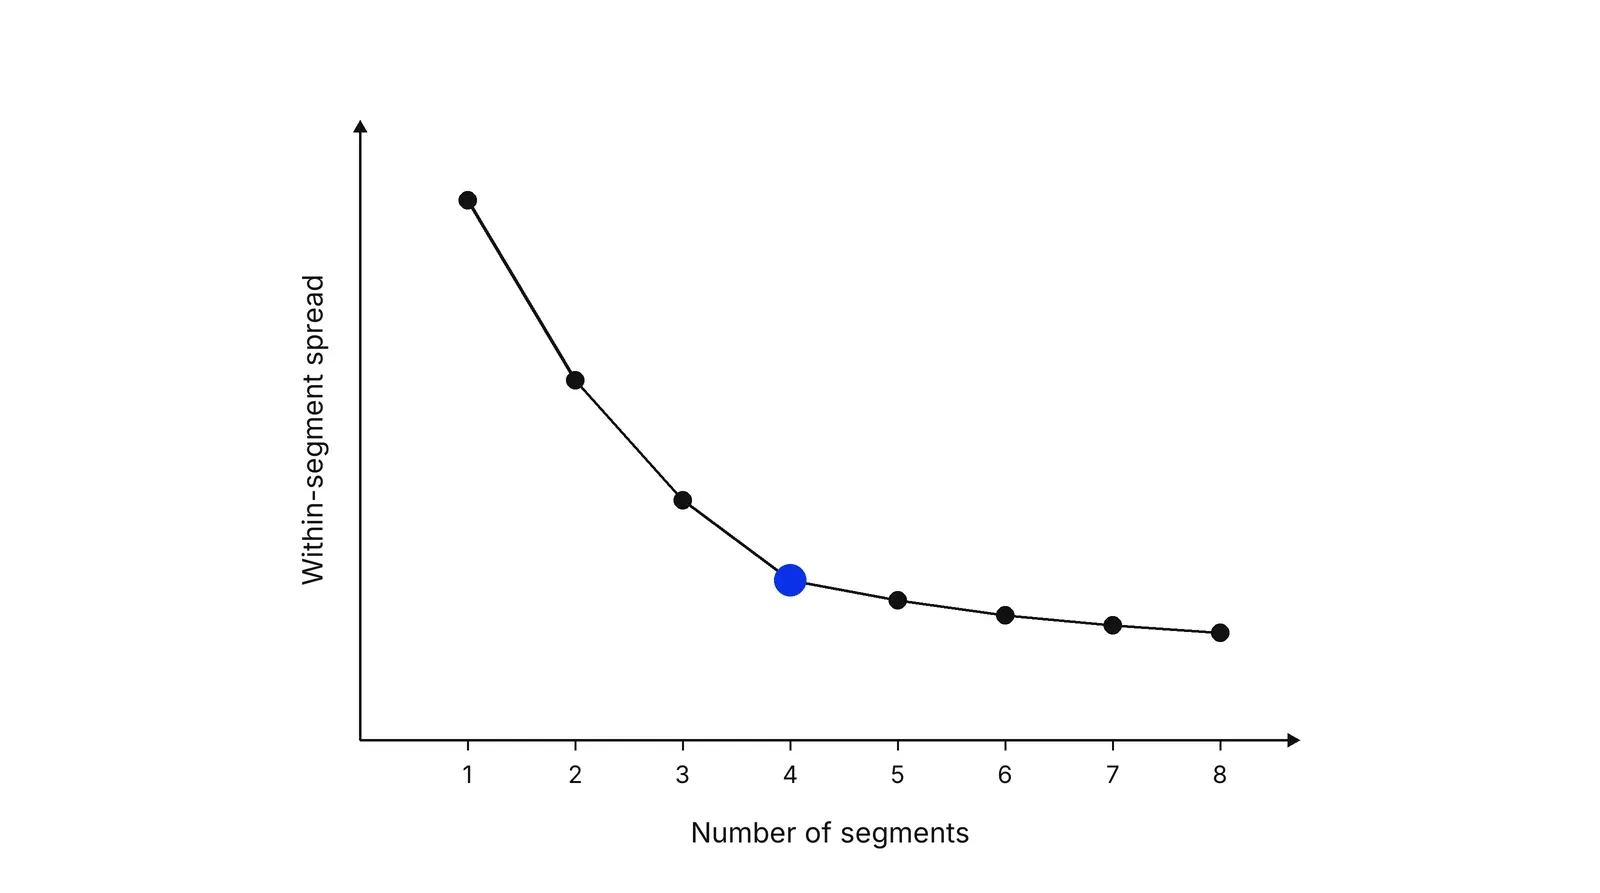
Other indices give a number instead of a picture. The Calinski-Harabasz index compares spread between segments with spread within them; Milligan and Cooper tested 30 stopping rules in 1985 and, as the Stata manual summarises, singled it out as one of the best. Rousseeuw’s silhouette measures how much closer each person sits to their own segment than to the next one. The gap statistic compares the fit with what random data would give. For latent class models, information criteria such as BIC do the job. They can disagree: in one data set in Dolnicar’s book, ICL pointed to 4 segments, BIC to 6 and AIC to at least 8.
Are the segments real?
A segmentation is only worth acting on if the same segments come back when the data changes slightly. Dolnicar’s team separates three cases. Natural segments are distinct and stable. Reproducible segments reappear across runs even though the data has no clear clusters. Constructive segments are artificial, and the analyst helps choose the most useful split.
The test is bootstrapping. Draw pairs of resamples, extract segments from each, and compare them with the adjusted Rand index, where 1 means identical and 0 means chance agreement. The book recommends 100 pairs. To check single segments, Christian Hennig’s clusterboot tool reports how often each one is recovered; its manual treats a mean Jaccard similarity of 0.75 or more as stable and 0.5 or less as dissolved.
Two habits to drop
The first is factor-cluster analysis: reducing the needs to a few factors, then clustering the factor scores. In four data sets, Dolnicar’s team found the factor step discarded 46 to 53% of the variation, and Dolnicar and Grün showed it did not beat clustering raw data. The second is running one algorithm once and building a plan on the result. In our Growth Lab work a segment becomes a target only after it survives resampling and someone can name the offer that would change for it.
How to apply Needs-based segmentation (cluster analysis), step by step
- Name the decision and write the needs list. Agree what the segments are for: a new product line, a pricing tier, a sales split. Then turn customer interviews into 15 to 30 need statements, each one idea, in the customer's words, such as 'get paid out the same day'. Leave demographics out of this list. Result: a needs list and one decision it serves.
- Measure how much each need matters. Survey a sample of the market on the importance of each need. Rating scales are quick but bunch up; MaxDiff forces trade-offs and separates people better. Plan the sample from the number of needs: Dolnicar and colleagues found 70 respondents per variable adequate in simulations, and their later book recommends 100. Result: a clean importance score per person per need.
- Prepare the data without shrinking it. Remove speeders and people who gave every item the same answer. Cluster on the need scores themselves, not on factor scores from the same data, which throws information away. For k-means, put all variables on the same scale. Result: one data table with one row per respondent and one column per need.
- Extract segments for a range of k. Run k-means with many random starts, or a latent class model, for every number of segments from 2 to about 8. Keep the best of the runs for each k, because k-means can stop at a poor local answer. Result: one candidate solution and its fit statistics for each k.
- Choose k and test stability. Compare fit across k with an elbow chart, the Calinski-Harabasz index or the silhouette for k-means, and BIC for latent class. Then bootstrap: re-run the analysis on resampled data and check how often each segment comes back. Result: a number of segments that both fits and reproduces, with any unstable segment flagged.
- Profile, name and assign. Describe each segment by its top needs, then by demographics, behavior and value, which were kept out of the clustering. Give each a plain name and write a short set of questions or CRM rules that assigns new customers to a segment. Result: named segments the sales and product teams can find in their own data.
Examples
A bank segmenting customers by account mix
Jay Magidson and Jeroen Vermunt describe a latent class model built on the types of accounts a bank's customers held. They fitted models with different numbers of clusters and kept the one with the lowest BIC, which gave four segments: Value Seekers (15%), Conservative Savers (35%), Mainstreamers (40%) and Investors (10%). According to the authors, Investors held over 30% of the bank's deposits. Survey data then showed where that segment was least satisfied, and a follow-up model linked its dissatisfaction to attrition.
A telehealth service with 18 needs
Illustrative, no real company implied. A telehealth provider writes 18 need statements, from 'see a doctor within an hour' to 'one doctor who knows my history'. At 70 to 100 respondents per need it plans 1,260 to 1,800 completes. K-means for k = 2 to 8 shows no clear elbow, so the team compares 3, 4 and 5 segments under bootstrapping. Four segments come back consistently; one of the five-segment groups dissolves in most resamples, so the team keeps four.
A payments company choosing what to build
Illustrative, no real company implied. A payments startup asks 1,600 merchants (100 per need, per Dolnicar's rule) to rank 16 needs in a MaxDiff survey and runs a latent class model on the choices. Three segments emerge: merchants who care most about payout speed, merchants who care about low fees, and merchants who care about multi-currency support. Profiling shows the third group is small but sells abroad, which no demographic split had shown.
When to use it
Use it when you suspect customers want different things but cannot say which groups exist, when demographic segments fail to predict who buys, or before a product, pricing or positioning decision that will cost more than the study. It needs a market large enough to survey a thousand or more people.
When not to use it
Skip it when you have fewer than a few hundred reachable customers: interview them and group them by hand. Skip it when the decision depends on observable traits such as company size or region, where a rule-based split is cheaper and easier to act on. Do not use it to rank features for one audience; MaxDiff alone does that.
Common mistakes
- Clustering on demographics and calling the result needs-based. Needs go into the model; demographics come out of it in profiling.
- Running factor analysis first and clustering the factor scores. According to Dolnicar, Grün and Leisch (2018), this step discarded 46 to 53% of the variation in four data sets.
- Taking the first k-means run as the answer. Different random starts give different segments, so run many and keep the best.
- Picking k from one chart. The elbow often has no clear bend; combine fit indices with a stability test and the question of whether each segment is big enough to act on.
- Skipping the assignment tool. Segments that live only in a research deck cannot be targeted, measured or sold to.
FAQ
What is the difference between needs-based and demographic segmentation?
Demographic segmentation groups people by observable traits such as age, income or company size. Needs-based segmentation groups them by what they want from the product. The two often disagree: Tony Ulwick of Strategyn argues that demographic traits nearly always fail to explain why customers have different unmet needs. Demographics are then used to describe and reach each needs segment.
How do you choose the number of clusters in segmentation?
Run the analysis for a range of k, usually 2 to 8, and compare fit with an elbow chart, the Calinski-Harabasz index, the silhouette, the gap statistic or BIC. These often disagree, so add a stability test: re-run on resampled data and keep the k whose segments come back. Last, check that every segment is large enough to act on.
Is k-means or latent class analysis better for segmentation?
Latent class analysis is usually more accurate. According to a simulation by Magidson and Vermunt (2002), it misclassified 1.3% of cases against 8% for k-means. It also handles mixed data types and gives BIC for choosing k. K-means is faster, easier to explain and available in every tool, so it remains a sound first pass.
How big a sample do you need for cluster analysis?
Base it on the number of variables you cluster on. A 2014 simulation by Dolnicar, Grün, Leisch and Schmidt found 70 respondents per variable adequate; their 2018 book recommends at least 100 per variable. So 20 needs call for 1,400 to 2,000 respondents. Niche segments you care about need more.
Should you run factor analysis before cluster analysis?
Usually no. The two-step factor-cluster approach loses information before segments are extracted, and according to Dolnicar and Grün (Journal of Travel Research, 2008) it did not beat clustering the raw variables even on data built from a factor model. Cluster on the original need scores, and drop items that duplicate each other before the survey.
Sources
- Girish Punj and David W. Stewart, Cluster Analysis in Marketing Research: Review and Suggestions for Application, Journal of Marketing Research 20(2), 1983
- Michel Wedel and Wagner A. Kamakura, Market Segmentation: Conceptual and Methodological Foundations, 2nd ed., Springer, 2000
- Sara Dolnicar, Bettina Grün and Friedrich Leisch, Market Segmentation Analysis: Understanding It, Doing It, and Making It Useful, Springer (open access), 2018
- Dolnicar, Grün and Leisch, Step 5: Extracting Segments, in Market Segmentation Analysis, 2018
- Sara Dolnicar, Bettina Grün, Friedrich Leisch and Kathrin Schmidt, Required Sample Sizes for Data-Driven Market Segmentation Analyses in Tourism, Journal of Travel Research 53(3), 2014
- Sara Dolnicar and Bettina Grün, Challenging Factor-Cluster Segmentation, Journal of Travel Research 47(1), 2008
- Russell I. Haley, Benefit Segmentation: A Decision-oriented Research Tool, Journal of Marketing 32(3), 1968
- J. MacQueen, Some Methods for Classification and Analysis of Multivariate Observations, Fifth Berkeley Symposium on Mathematical Statistics and Probability, 1967
- Joe H. Ward Jr., Hierarchical Grouping to Optimize an Objective Function, Journal of the American Statistical Association 58(301), 1963
- David Arthur and Sergei Vassilvitskii, k-means++: The Advantages of Careful Seeding, SODA 2007
- Douglas Steinley, K-means Clustering: A Half-Century Synthesis, British Journal of Mathematical and Statistical Psychology 59(1), 2006
- Jay Magidson and Jeroen K. Vermunt, Latent Class Models for Clustering: A Comparison with K-means, Canadian Journal of Marketing Research 20, 2002
- Jay Magidson and Jeroen K. Vermunt, A Nontechnical Introduction to Latent Class Models, Statistical Innovations
- Sawtooth Software, The MaxDiff System Technical Paper, Version 9, 2020
- Glenn W. Milligan and Martha C. Cooper, An Examination of Procedures for Determining the Number of Clusters in a Data Set, Psychometrika 50, 1985
- T. Caliński and J. Harabasz, A Dendrite Method for Cluster Analysis, Communications in Statistics 3(1), 1974
- StataCorp, Stata Multivariate Statistics Reference Manual: cluster stop
- Peter J. Rousseeuw, Silhouettes: A Graphical Aid to the Interpretation and Validation of Cluster Analysis, Journal of Computational and Applied Mathematics 20, 1987
- Robert Tibshirani, Guenther Walther and Trevor Hastie, Estimating the Number of Clusters in a Data Set via the Gap Statistic, Journal of the Royal Statistical Society B 63(2), 2001
- Gideon Schwarz, Estimating the Dimension of a Model, Annals of Statistics 6(2), 1978
- Lawrence Hubert and Phipps Arabie, Comparing Partitions, Journal of Classification 2, 1985
- Christian Hennig, Cluster-wise Assessment of Cluster Stability, Computational Statistics and Data Analysis 52(1), 2007
- Christian Hennig, fpc package reference manual (clusterboot), CRAN
- scikit-learn developers, Clustering: user guide
- Tony Ulwick, What Hidden Segments Exist in Your Market?, Strategyn
Last updated Oct 9, 2026


Marketing agency or growth system: when a company outgrows its agency
An agency is the right call while the founder still runs most of the company. Once the business starts copying itself into new locations or markets, it needs a system that sets goals, tests hypotheses and owns the result.

Why healthcare marketing agencies stall: the short, mid and long wins model we use with clinics
Most agencies own the click and nobody owns the front desk. How we structure clinic work in three horizons, the research behind each one, and one year of results.

Why channel tests stall after month three
Most paid channel tests do not end with a decision. They end when the budget runs out, the attribution model changes, or everyone quietly stops looking at the dashboard.