Operating leverage
Operating leverage describes how much faster operating profit moves than revenue because part of the cost base stays fixed, and the degree of operating leverage puts a number on it.
Operating leverage is the extent to which a company's costs are fixed rather than tied to sales, so operating profit changes by a larger percentage than revenue. The degree of operating leverage (DOL) is contribution margin divided by operating income, or the percentage change in operating profit divided by the percentage change in sales. A DOL of 3 means a 10% rise in sales lifts operating profit by about 30%.
- Origin
- Cost-volume-profit analysis in management accounting; risk link tested by Baruch Lev, 20th century; 1974
- Level
- 301 · Advanced
- Fits
- Small and mid-size, Scale-up
- Time to apply
- about an hour for a first calculation, half a day to tag every cost as fixed or variable
- What you need
- the last 12 months of the P&L, with revenue and every cost line · someone who knows which costs would change if sales moved 10% either way · your monthly cash balance, to compare against the fixed-cost base
Operating leverage is the degree to which a company’s costs stay fixed when sales change, and it decides how much faster operating profit moves than revenue. A business with high fixed costs and low variable costs keeps most of every extra sale once the fixed costs are covered, and it loses profit just as fast when sales fall. Management accountants have used the idea for decades in cost-volume-profit analysis. Baruch Lev’s 1974 paper found that firms with a higher share of fixed costs carried larger total and systematic stock risk, and finance researchers have argued over the details since.
How do you calculate the degree of operating leverage?
The degree of operating leverage (DOL) is contribution margin divided by operating income. OpenStax’s managerial accounting text defines operating leverage as how sensitive net operating income is to a percentage change in sales and gives this formula. Contribution margin is sales minus variable costs; the contribution margin page shows how to build it. The same number can be estimated as the percentage change in operating profit divided by the percentage change in sales, the approximation Damodaran uses because outsiders rarely see a company’s fixed and variable costs.
Take two illustrative businesses with the same revenue and the same profit. The numbers are arithmetic, not real companies.
| Low fixed costs | High fixed costs | |
|---|---|---|
| Revenue | 1,000,000 | 1,000,000 |
| Variable costs | 700,000 | 300,000 |
| Contribution margin | 300,000 | 700,000 |
| Fixed costs | 200,000 | 600,000 |
| Operating profit | 100,000 | 100,000 |
| DOL | 3.0 | 7.0 |
| Revenue up 10% | profit 130,000 (up 30%) | profit 170,000 (up 70%) |
| Revenue down 10% | profit 70,000 (down 30%) | profit 30,000 (down 70%) |
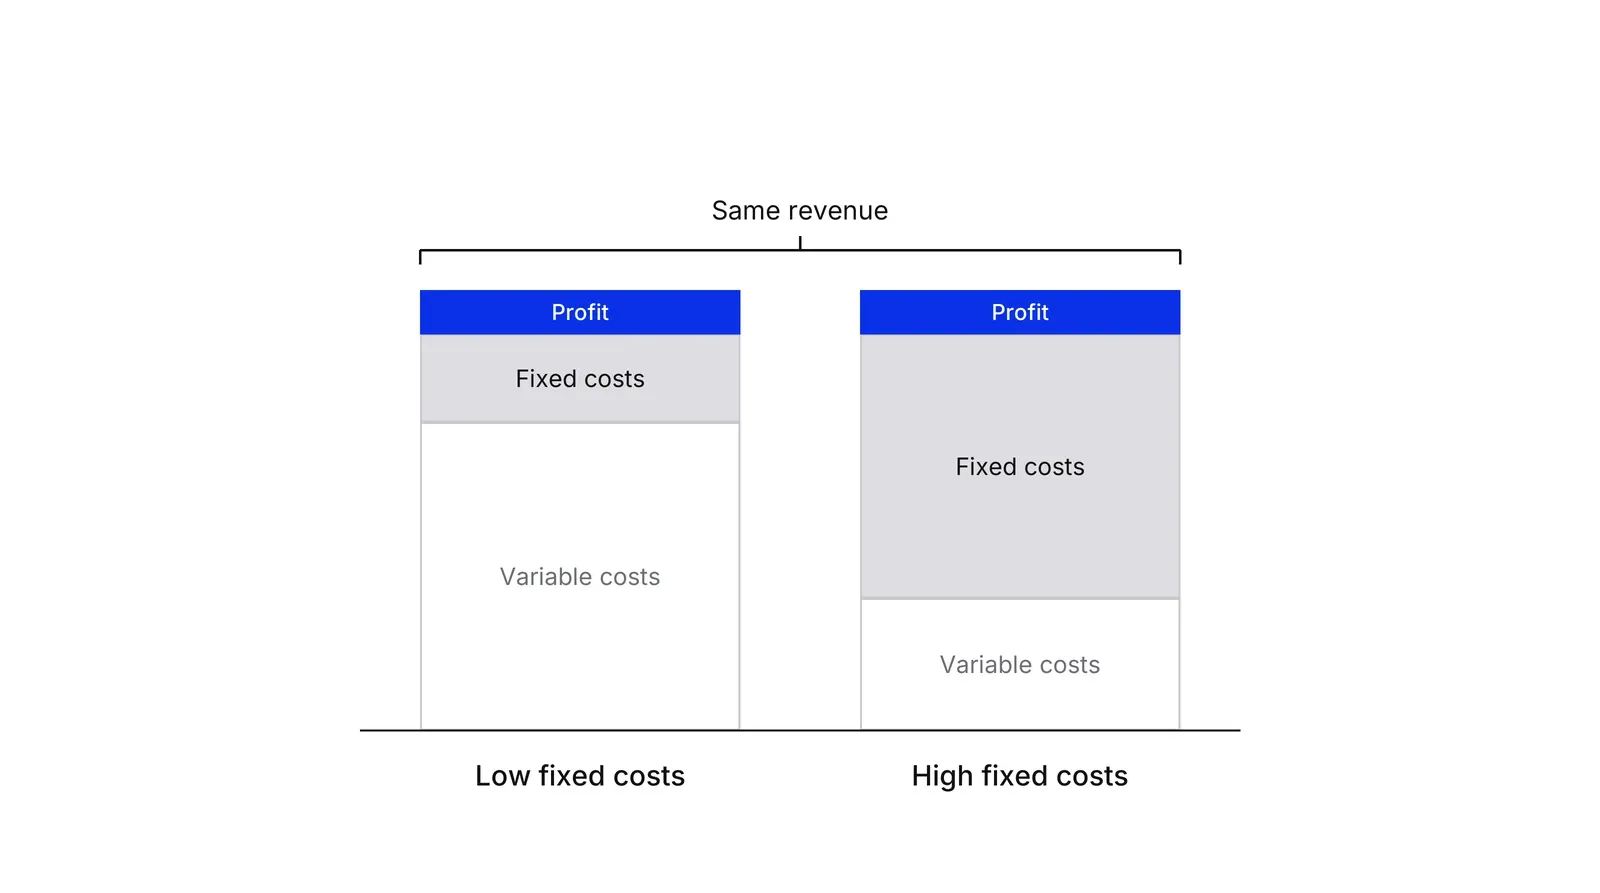
Both look identical on the P&L today. They differ only in what happens when sales move.
Why does profit move faster than revenue?
Because each extra sale adds its contribution margin to profit while fixed costs stay where they are. In the high-fixed business every added unit of revenue brings 70 cents of profit, against 30 cents in the low-fixed one. The line for each business passes through zero and its slope is the DOL.
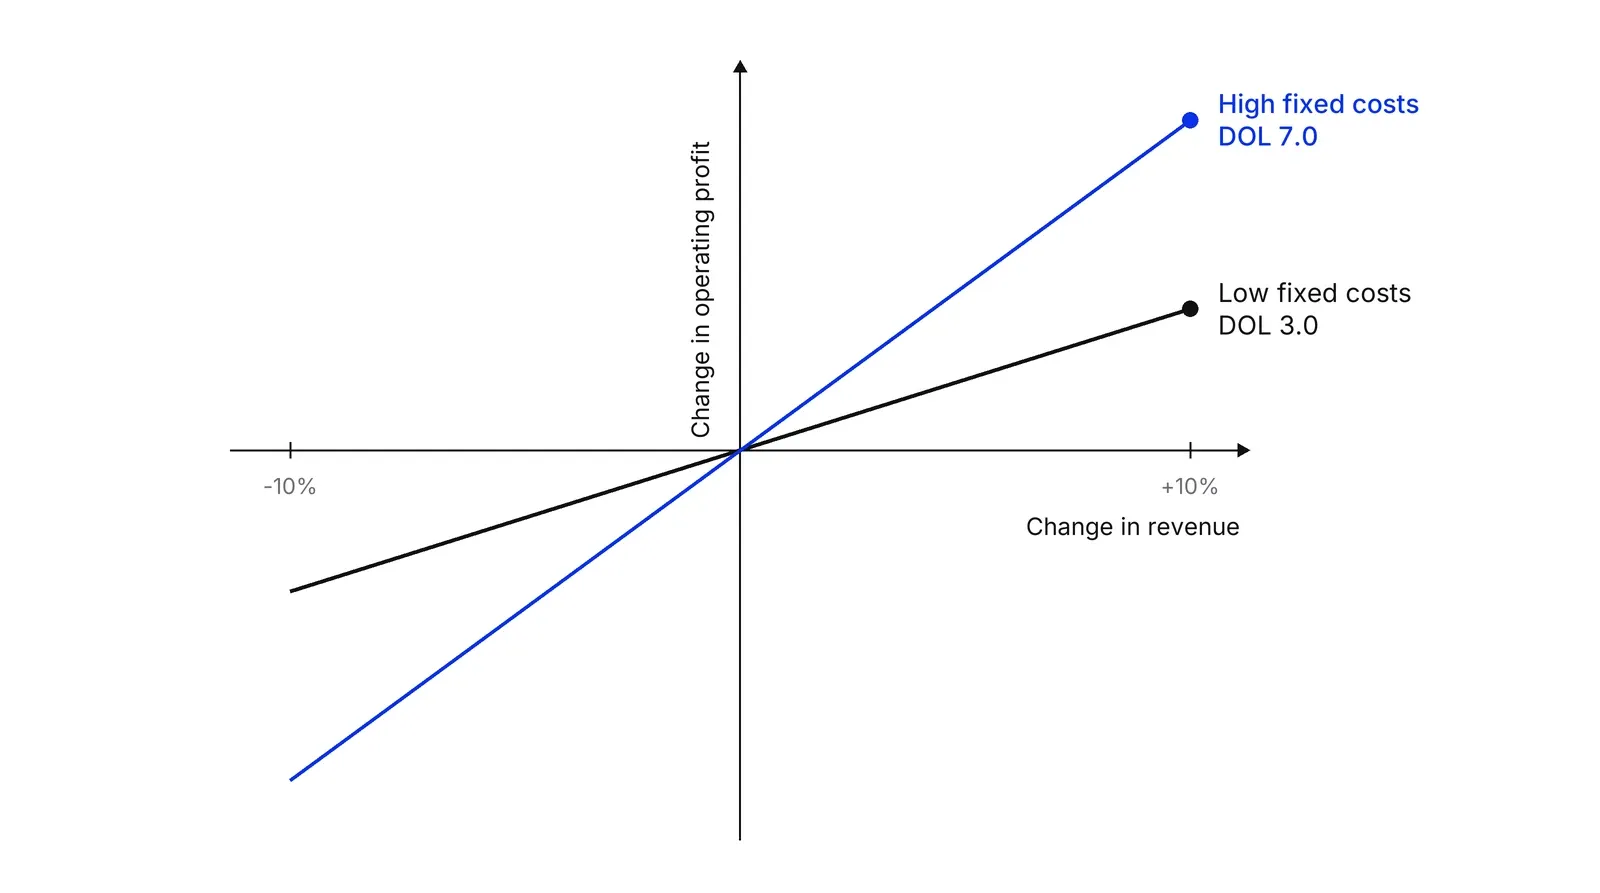
The ratio is not constant. If the high-fixed business grew its revenue by half, operating profit would more than quadruple and its DOL would fall to about 2.3. Close to break-even, where operating profit nears zero, the ratio becomes very large. It also holds only while fixed costs stay fixed, which is true over a range of sales and a period of time, not forever.
What counts as a fixed cost?
A fixed cost is one that stays the same across a normal range of sales over a given period: rent, salaried staff, software licences, committed content or capacity. Variable costs are materials, payment-processing fees and sales commissions. Most real costs sit in between, and the evidence shows managers adjust them unevenly. Anderson, Banker and Janakiraman studied 7,629 firms over 20 years and found that selling, general and administrative costs rise about 0.55% for each 1% sales increase but fall only about 0.35% for each 1% decline. A SUERF brief on Croatian firms found that a 1% sales drop cut goods and materials costs by roughly 0.88% but staff costs by only 0.29%.
The cost structure is also a choice. Damodaran notes that flexible labour contracts, joint ventures and subcontracting lower the fixed share. The research disagrees on which way uncertainty pushes firms. Banker, Byzalov and Plehn-Dujowich report that greater demand uncertainty leads manufacturers to hold more fixed capacity, while Kallapur and Eldenburg found that Washington State hospitals moved toward variable costs after a 1983 Medicare payment change raised revenue uncertainty.
Does high operating leverage mean higher risk?
Often, but the evidence is not uniform. Lev (1974) found higher operating leverage went with larger overall and systematic risk, and Mandelker and Rhee tested how both operating and financial leverage relate to a stock’s beta. Robert Novy-Marx’s 2011 paper found that firms sorted on a new operating leverage measure earn different returns, and that it helps explain the value premium within industries. García-Feijóo and Jorgensen found positive links between book-to-market, DOL, returns and systematic risk. Chen, Kacperczyk and Ortiz-Molina tied a higher cost of equity in unionised industries to lost operating flexibility.
Other work adds conditions. Guthrie shows that once a firm can abandon an unprofitable project, expected return is non-monotonic in operating leverage, and Gu, Hackbarth and Johnson find that risk rises with operating leverage for inflexible firms but falls for flexible ones. For managers, stickier costs also make earnings harder to predict: Dan Weiss found, in 44,931 firm quarters, that analysts’ consensus forecasts were less accurate for firms with stickier costs.
How does it interact with debt and cash?
Operating and financial leverage are two different multipliers. Operating leverage sits in the cost base and magnifies the step from revenue to operating profit; financial leverage sits in the debt and magnifies the step from operating profit to net income. Chen, Harford and Kamara show that greater operating leverage raises profitability and lowers the optimal amount of debt, and Sarkar’s model finds the two are not always substitutes. Jiao, Nishihara and Zhang report that quasi-fixed operating costs can reduce underinvestment in debt-financed firms.
Fixed costs also have to be paid from cash whatever sales do, so the cash flow forecast matters as much as the ratio. The SUERF authors found firms with higher operating leverage saw profits and liquidity respond more sharply to falling sales. The upside depends on contribution per unit, which is the focus of unit economics.
A Growth Lab plan starts from the contribution margin per unit and the size of the fixed-cost base, before any growth target is set.
How to apply Operating leverage, step by step
- Sort every cost line into fixed or variable. Go through the P&L and mark each line. Variable costs move with sales: materials, payment fees, sales commissions. Fixed costs stay put across a normal range of sales: rent, salaried staff, software licences, committed content or capacity. Mark mixed lines as semi-fixed and split them. Result: two totals, fixed and variable, that add up to total cost.
- Calculate contribution margin and operating profit. Subtract total variable costs from revenue to get contribution margin, then subtract fixed costs from that to get operating profit. Result: two figures for the same period that you can divide in the next step.
- Divide to get the degree of operating leverage. Divide contribution margin by operating profit. If the answer is 4, a 5% change in sales moves operating profit by about 20% in the same direction. Result: one number that sums up how exposed profit is to sales.
- Run a plus and minus 10% test. Recalculate operating profit with revenue 10% higher and 10% lower, holding fixed costs flat. Result: a profit range for a normal swing in sales, which is easier to discuss than a ratio.
- Check the downside against cash. Compare monthly fixed costs with cash on hand and with the cash the business generates in the weak scenario. Result: the number of months you can carry the fixed-cost base if sales drop.
- Decide whether to change the structure. If the downside test hurts, look for fixed costs that could become variable, such as per-use contracts, revenue-share deals or flexible staffing. If demand is predictable and growing, you may keep or add fixed capacity on purpose. Result: one written decision with the cost lines it affects.
Examples
Netflix: high operating leverage on the way up
Netflix's [2024 Form 10-K](https://www.sec.gov/Archives/edgar/data/1065280/000106528025000044/nflx-20241231.htm) reports revenue of $39.0 billion, up 16% on the year, and operating income of $10.4 billion, up 50%. Operating margin rose from 21% to 27%. Dividing 50% by 16% gives a DOL of about 3.2 for the year. The same filing describes its content costs as largely fixed in nature, which is the reason extra members add profit faster than cost. It also warns that if growth slows, margins may suffer.
HCA Healthcare: lower operating leverage in a hospital group
HCA's [2024 Form 10-K](https://www.sec.gov/Archives/edgar/data/860730/000095017025020134/hca-20241231.htm) reports revenue of $70.6 billion, up 8.7%. Income before income taxes rose 10.6%, a ratio of about 1.2 after interest expense. Supplies stayed at 15.2% of revenue, and salaries and benefits slipped from 45.4% to 44.1%. Costs that move with patient volume keep the ratio low, so profit follows revenue closely in both directions.
Delta Air Lines in 2020: the downside
Delta's [2020 Form 10-K](https://www.sec.gov/Archives/edgar/data/27904/000002790421000003/dal-20201231.htm) shows total operating revenue falling 64% to $17.1 billion. Total operating expense fell 27%. Removing the restructuring charge and the government grant credit, our arithmetic gives a fall of 37%. Costs fell far less than revenue, and operating income went from a profit of $6.6 billion to a loss of $12.5 billion.
When to use it
Use it before a hiring plan, a capacity purchase or a long contract that turns a variable cost into a fixed one, when you need to know how much profit a sales miss would erase, and when you are comparing two businesses or product lines with similar profit but different cost structures.
When not to use it
Skip it when operating profit is close to zero or negative, because the ratio swings wildly or becomes meaningless. It also misleads when sales change by a very large amount, since fixed costs are only fixed within a range, and it does not capture price changes, one-off charges or mix shifts that sit inside the profit figure.
Common mistakes
- Treating the ratio as a constant. DOL falls as profit grows past break-even and spikes as profit approaches zero, so it describes one point on the cost curve.
- Calling a cost fixed because it was flat last year. A cost is fixed only over a stated range of sales and a stated period.
- Reading a company's DOL from two years of reported results without checking for price changes, acquisitions, restructuring charges or grants that distort the profit change.
- Chasing high operating leverage for the upside while ignoring that the same fixed costs must be paid from cash in a weak quarter.
- Assuming high operating leverage always means more investor risk. Research finds the link depends on how flexibly a firm can scale.
FAQ
What is the degree of operating leverage formula?
Degree of operating leverage equals contribution margin divided by operating income. Contribution margin is sales minus variable costs. The equivalent form is the percentage change in operating profit divided by the percentage change in sales. A result of 4 means a 5% sales change moves operating profit about 20%.
What does a high operating leverage mean?
It means a large share of costs is fixed, so each extra sale adds most of its contribution margin straight to profit once fixed costs are covered. Profit rises quickly when sales grow and falls just as quickly when they shrink, which makes earnings more volatile for the same revenue.
Is high operating leverage good or bad?
Neither by itself. It raises profit when sales grow and cuts it when they fall. Lev (1974) linked higher operating leverage to higher stock risk, while Gu, Hackbarth and Johnson (2018) found risk rises with it only for firms that cannot adjust their scale.
How is operating leverage different from financial leverage?
Operating leverage comes from fixed operating costs and magnifies the move from revenue to operating profit. Financial leverage comes from debt and magnifies the move from operating profit to net income. A firm can carry one without the other, and some research finds firms with high operating leverage choose less debt.
How do you calculate the change in operating leverage?
Calculate the DOL for two periods using the same formula, contribution margin divided by operating income, and compare them. It usually falls as a business grows well past break-even because operating income rises faster than contribution margin. Adding fixed costs, such as new capacity, pushes it up.
Sources
- Baruch Lev, On the Association between Operating Leverage and Risk, Journal of Financial and Quantitative Analysis 9(4), 1974
- Gershon N. Mandelker, S. Ghon Rhee, The Impact of the Degrees of Operating and Financial Leverage on Systematic Risk of Common Stock, Journal of Financial and Quantitative Analysis 19(1), 1984
- Robert Novy-Marx, Operating Leverage, Review of Finance 15(1), 2011
- Luis García-Feijóo, Randy D. Jorgensen, Can Operating Leverage Be the Cause of the Value Premium?, Financial Management 39(3), 2010
- Zhiyao Chen, Jarrad Harford, Avraham Kamara, Operating Leverage, Profitability, and Capital Structure, Journal of Financial and Quantitative Analysis 54(1), 2019
- Huafeng Chen, Marcin Kacperczyk, Hernán Ortiz-Molina, Labor Unions, Operating Flexibility, and the Cost of Equity, Journal of Financial and Quantitative Analysis 46(1), 2011
- Graeme Guthrie, A Note on Operating Leverage and Expected Rates of Return, Finance Research Letters 8(2), 2011
- Lifeng Gu, Dirk Hackbarth, Tim Johnson, Inflexibility and Stock Returns, Review of Financial Studies 31(1), 2018
- Eric Jacquier, Sheridan Titman, Atakan Yalçın, Predicting Systematic Risk: Implications from Growth Options, Journal of Empirical Finance 17(5), 2010
- Feng Jiao, Michi Nishihara, Chuanqian Zhang, Operating Leverage and Underinvestment, Journal of Financial Research 42(3), 2019
- Sudipto Sarkar, The Relationship between Operating Leverage and Financial Leverage, Accounting and Finance 60(S1), 2020
- Mark C. Anderson, Rajiv D. Banker, Surya N. Janakiraman, Are Selling, General, and Administrative Costs Sticky?, Journal of Accounting Research 41(1), 2003
- Rajiv D. Banker, Dmitri Byzalov, Jose M. Plehn-Dujowich, Demand Uncertainty and Cost Behavior, The Accounting Review 89(3), 2014
- Sanjay Kallapur, Leslie Eldenburg, Uncertainty, Real Options, and Cost Behavior: Evidence from Washington State Hospitals, Journal of Accounting Research 43(5), 2005
- Dan Weiss, Cost Behavior and Analysts' Earnings Forecasts, The Accounting Review 85(4), 2010
- OpenStax, Principles of Accounting, Volume 2: Managerial Accounting, section 3.5, Margin of Safety and Operating Leverage
- Aswath Damodaran, Applied Corporate Finance, Chapter 4, Risk Measurement and Hurdle Rates, NYU Stern
- Katharina Allinger, Ivan Huljak, Operating leverage and its importance during the Covid-19 pandemic, SUERF Policy Brief No. 256, 2022
- Netflix, Inc., Form 10-K for the fiscal year ended December 31, 2024, U.S. Securities and Exchange Commission
- HCA Healthcare, Inc., Form 10-K for the fiscal year ended December 31, 2024, U.S. Securities and Exchange Commission
- Delta Air Lines, Inc., Form 10-K for the fiscal year ended December 31, 2020, U.S. Securities and Exchange Commission
Last updated Oct 9, 2026


How to calculate channel payback and unit economics
A CAC number that only marketing believes will not survive a finance review. This guide calculates channel payback so both teams work from the same model.

Fractional CFO vs finance operations: which gap do you actually have
A fractional CFO is a person. Finance operations is a system. Companies searching for one are often missing the other, or both.