Pricing power
Pricing power is a company's ability to raise prices without losing enough customers to make the rise a mistake, and it is the clearest sign that a business has an advantage rivals cannot copy.
Pricing power is a company's ability to raise its prices without losing enough customers to make the increase unprofitable. Warren Buffett called it the single most important factor in judging a business. It comes from things rivals cannot copy quickly, such as a brand, switching costs or scarcity, and it shows up as low price elasticity and margins that survive a price rise.
- Origin
- Warren Buffett (as an investing test); Abba P. Lerner (market power measure), 1934; 1991; 2010
- Level
- 401 · Expert
- Fits
- Scale-up, Enterprise
- Time to apply
- two to three hours for a first read, then a two to four week price test
- What you need
- three to five years of price changes and the sales volume that followed each one · your unit price, variable cost and contribution margin for the product or segment in question · someone in sales or support who hears why customers leave
Pricing power is the ability to raise prices without losing enough customers to make the increase a mistake. Warren Buffett put it at the top of his checklist. In a May 2010 staff interview for the Financial Crisis Inquiry Commission, explaining why Berkshire Hathaway owned Moody’s and Dun & Bradstreet, he said “the single most important decision in evaluating a business is pricing power”. He then contrasted a business that can raise prices with one that agonises over a tiny rise. The idea is older in his writing: the 1991 Berkshire letter says the one real insight in buying See’s Candies in 1972 was that the business had untapped pricing power.
What pricing power looks like
A company has pricing power when demand barely moves after a price rise. Economists measure that with price elasticity, the percentage change in volume for each percent change in price. Abba Lerner’s 1934 index of monopoly power turns it into a margin: for a firm that sets its price to maximise profit, the gap between price and marginal cost, as a share of price, equals one divided by the absolute elasticity. The less customers react, the wider the gap.
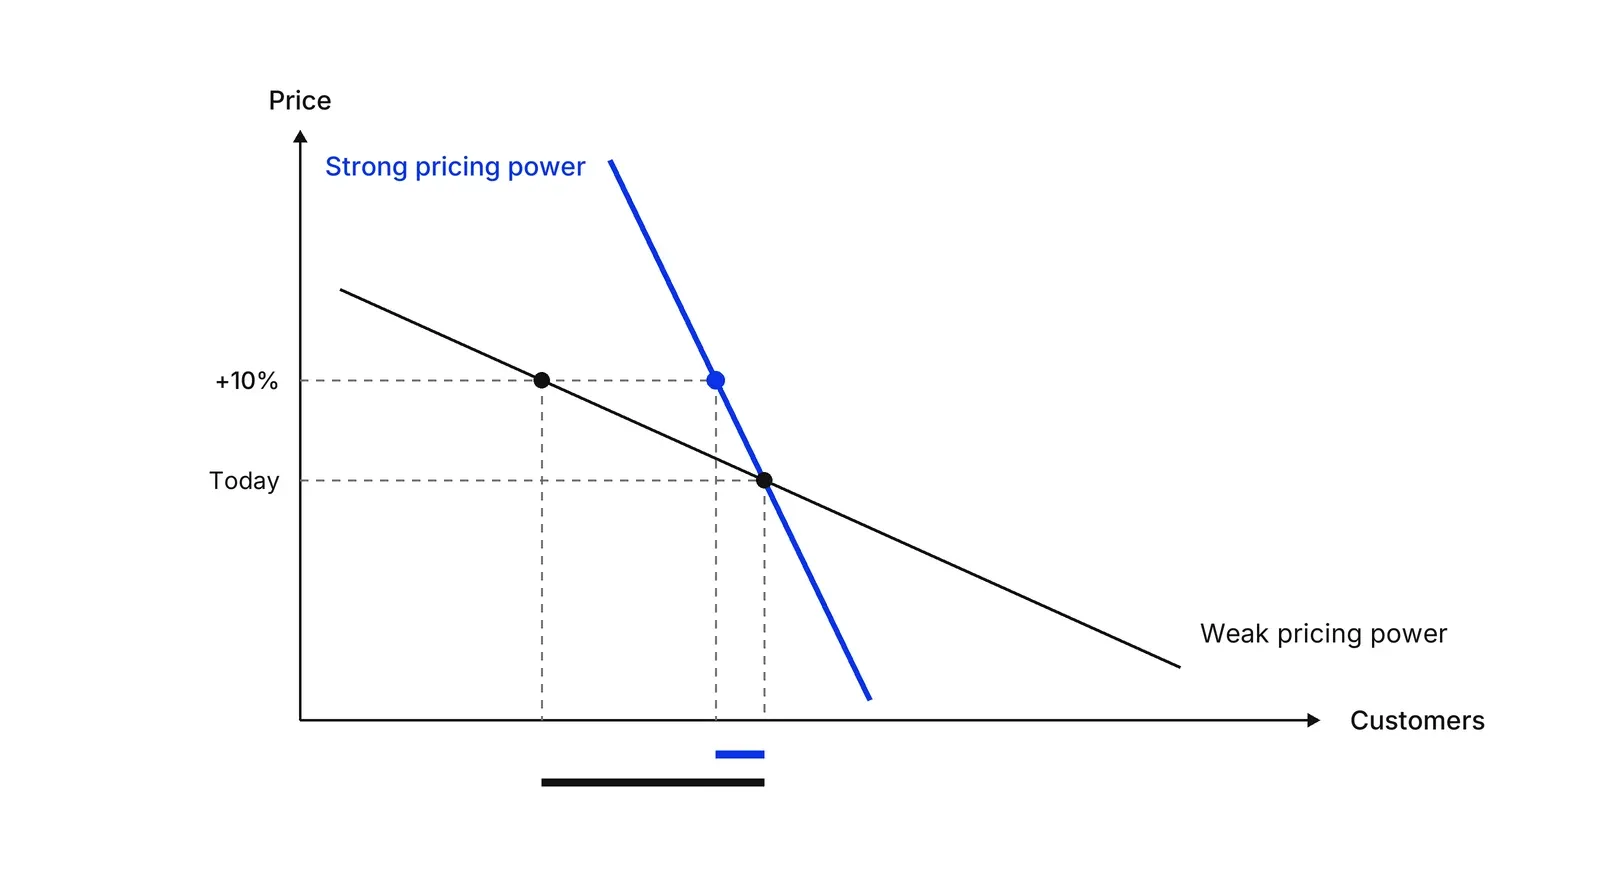
Benchmarks help only as a floor for doubt. Tellis’s 1988 meta-analysis reported an average elasticity of -1.76 and Bijmolt, van Heerde and Pieters (2005) -2.62, both for consumer brands. On those averages a 10% rise costs roughly 18% to 26% of volume. A business with real pricing power sits far from them, and the price elasticity page shows how to estimate your own number.
Where pricing power comes from
Pricing power comes from something that stops customers from simply switching to a rival. Four sources recur, and each has a way of breaking.
| Source | Why customers stay | How it breaks |
|---|---|---|
| Brand and differentiation | Buyers pay for a name or a proven result, as in Keller’s brand equity work | A rival matches the quality, or the brand stops meaning anything |
| Switching costs | Leaving costs time, money or data, which Klemperer’s research links to higher prices for locked-in customers | A rival pays the cost of moving for the customer |
| Few substitutes | Supply is scarce or the market is a duopoly | A new entrant or a regulator arrives |
| Small share of the budget | The price is minor next to what the product saves or earns | The buyer starts auditing the line item |
The last row follows Porter’s five forces: buyers gain power when a product is undifferentiated, costs them a lot and is easy to switch away from. Buffett’s Moody’s example is the third row. He described a natural duopoly in which a rival offering half the price had no chance. How a company organises its names matters here too; the brand architecture page covers that.
Morningstar names five sources of an economic moat: intangible assets, switching costs, network effect, cost advantage and efficient scale. Helmer’s 7 Powers asks for a benefit and a barrier that stops rivals copying it. Pricing power is how that benefit appears in the price list.
See’s is the clearest documented case. The 2007 letter reports sales growing from $30 million at purchase to $383 million while pounds sold rose from 16 million to 31 million, so most of the growth came from price and mix, not from selling more candy. Our arithmetic from those figures puts revenue per pound at about 6.6 times its 1972 level, with the caveat that mix and shop sales blur it.
The arithmetic of a price increase
A price rise is worth more than the same rise in volume. Marn and Rosiello calculated in 1992 that for a company with average economics a 1% price improvement with no loss of volume lifts operating profit by 11.1%, against 3.3% for a 1% volume gain. That is why managers raise prices, and also why a lost customer hurts less than it feels.
The test is break-even. Divide the rise by your contribution margin plus the rise, and you get the share of volume you can lose before profit falls below today’s. With a 40% margin and a 10% rise, that is 20%.
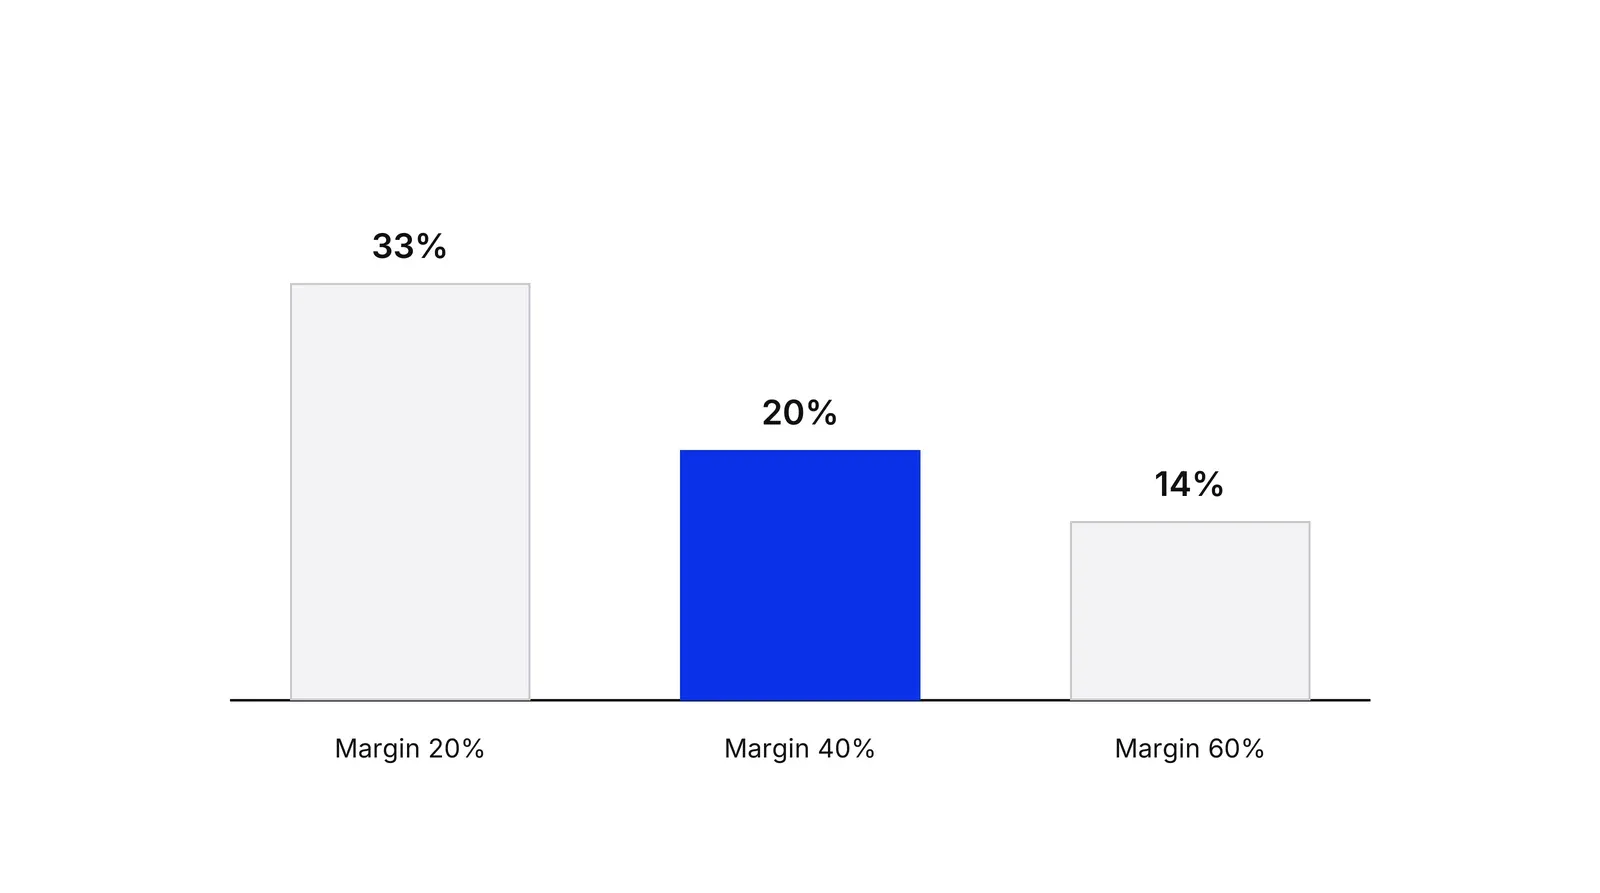
A thin-margin business can lose a third of its customers and break even, because each extra price dollar falls straight to profit. Break-even only tells you what you can afford. Whether you have pricing power depends on whether real losses stay below it.
What limits a price rise
Customers judge how a price moves as well as where it ends up. In Kahneman, Knetsch and Thaler’s 1986 survey, 82% of 107 respondents called it unfair for a hardware store to lift snow shovels from $15 to $20 the morning after a blizzard. The same paper found it acceptable for a firm to raise prices when its profits are threatened. Netflix’s 2011 episode, below, shows the cost of ignoring this.
Changing a price is also work. Zbaracki and colleagues studied one large industrial manufacturer and found that price adjustment cost 1.22% of its revenue and 20.03% of its net margin, mostly in managerial time and customer negotiation, not in reprinting lists.
Has pricing power been growing?
The sources disagree. De Loecker, Eeckhout and Unger (2020) report that average markups of US public firms rose from 21% above marginal cost in 1980 to 61% in 2016, driven by the upper tail while the median stayed flat. Susanto Basu (2019) argues some of the steep estimates are hard to square with other evidence. For a single company the aggregate debate matters less than its own price history.
Pricing power is the position; competitive pricing is how you move once rivals can see you. To capture the value that creates power, see value-based pricing, which in Hinterhuber’s 2004 framework sets prices from customer value, not from cost. A Growth Lab plan starts from a measured answer to what share of customers would leave after a 5% rise, before anything on the price list changes.
How to apply Pricing power, step by step
- Ask the Buffett question. Write down what you expect to happen if you raise the price 5% next month, and ask sales and support for the same guess. If the honest answer is a long meeting about who might leave, that is data. Result: a written guess of the share of customers who would leave, from each person asked.
- Pull your own price history. List every price change of the last three to five years with the volume, churn and complaints in the following quarters. Your own history is better evidence than any benchmark. Result: a table of past price moves and what each did to volume.
- Work out the break-even volume loss. Divide the price rise by your contribution margin plus the rise. With a 40% margin and a 10% rise, you can lose 20% of volume before profit falls. Result: one number, the loss you can absorb, per product or segment.
- Estimate elasticity with a test. Compare the break-even number with what customers really do, using a price test on new customers or one segment, or the elasticity method on the price-elasticity page. Do not test only on the loyal base. Result: an observed volume loss per segment next to its break-even.
- Name the source of your power. Decide which of four sources holds your customers: brand, switching costs, few substitutes or a small share of their budget. Then write down what a rival would need to do to remove it. Result: one named source and the move that would end it.
- Raise where it pays and explain it. Raise prices first in segments where observed loss is below break-even, tie the change to a cost or to value customers can see, and review churn at the next renewal. Result: a dated price plan with a review point.
Examples
See's Candies, the textbook case
According to Berkshire's 2007 letter, Blue Chip Stamps bought See's in 1972 for $25 million, when sales were $30 million and pre-tax earnings under $5 million. The same letter reports 2007 sales of $383 million and pre-tax profit of $82 million, from 31 million pounds of candy against 16 million in 1972, with $32 million of capital reinvested over the period. By our arithmetic, volume about doubled while sales rose almost 13 times, so average revenue per pound rose roughly 6.6 times, though mix and shops blur that. Per the 1991 letter, the one real insight in the purchase was that the business had untapped pricing power.
Netflix in 2011, the other side
In its October 2011 shareholder letter Netflix said $7.99 for unlimited streaming and $7.99 for unlimited DVDs were low prices against competitors and against the value delivered. It said it had misjudged how quickly to get there and had not explained its rising content costs, so many members saw it as greedy. According to the same letter, unique domestic subscribers fell to 23.8 million, which it put down to a higher than expected level of cancellations and fewer new sign-ups. A defensible price level can still lose customers if the way it moves breaks trust.
A dental clinic and a 10% rise
Illustrative, no real clinic implied. A clinic charges $100 for a check-up with $60 of variable cost, so the margin is 40%. At 500 visits a month it earns $20,000. At $110 the margin per visit is $50, so the clinic can drop to 400 visits and still earn $20,000, a 20% loss. If a three-month test shows 8% of patients leave, the clinic earns $23,000 and has pricing power at that price. If 30% leave, it does not.
When to use it
Use it before a price increase, when judging whether a margin is safe from competitors, when deciding where to invest in brand or switching costs, and when valuing or buying a business. It answers one question: what happens to revenue and profit when the price moves up.
When not to use it
Skip it as a stand-alone strategy for a company still finding product-market fit, where there is no stable customer base to test. It also tells you nothing about how rivals will respond to a price cut, which is a competitive pricing question, and it does not replace a legal check where prices are regulated.
Common mistakes
- Treating a long run without complaints as proof, when the price has not moved in years and nobody has tested a rise.
- Counting only the volume lost this month and missing the slower loss at renewal, in referrals and in reputation.
- Testing a rise only on the most loyal customers, then rolling it out to everyone.
- Raising a price with no stated reason. Research on fairness finds people judge a rise that looks like exploiting demand as unfair.
- Confusing a high margin with pricing power. A margin from scale can disappear when a rival matches your cost; pricing power is what happens when the price moves.
FAQ
What is pricing power?
Pricing power is the ability to raise prices without losing enough customers or volume to hurt profit. A company with it can pass on costs and earn above-average margins for years. A company without it must match rivals or watch customers leave. Buffett used it as his first test of a business.
How do you measure pricing power?
There is no single metric. Use three together: price elasticity from tests or history, the volume loss that would cancel a price rise given your margin, and whether margins held after past rises. Abba Lerner's 1934 index, the gap between price and marginal cost relative to price, is the economist's version.
What gives a company pricing power?
Four sources recur: a brand or differentiation customers pay for, switching costs that make leaving expensive, few substitutes or scarce supply, and a price that is a small part of what the customer spends or gains. Morningstar's five moat sources overlap with these. Each can erode if a rival changes the economics.
What is an example of pricing power?
See's Candies is the best-documented one. According to Berkshire's 2007 letter, sales rose from $30 million to $383 million between 1972 and 2007 while pounds sold about doubled. In his 2010 FCIC interview Buffett also named Moody's, a duopoly where a rival offering half the price had no chance.
Is pricing power the same as market power?
They are close. Market power is the economist's term, usually measured as a markup of price over marginal cost. Pricing power is the manager's version, asking whether this price rise holds. Researchers disagree on whether average markups have risen in the US since 1980, so treat any single figure with care.
Sources
- Financial Crisis Inquiry Commission, Transcript of Interview with Warren Buffett, 26 May 2010, FRASER, Federal Reserve Bank of St. Louis
- Financial Crisis Inquiry Commission, staff audiotape of interview with Warren Buffett, 26 May 2010, transcript by Santangel's Review
- Warren Buffett, Berkshire Hathaway shareholder letter for 1991
- Warren Buffett, Berkshire Hathaway shareholder letter for 2007
- Michael V. Marn, Robert L. Rosiello, Managing Price, Gaining Profit, Harvard Business Review, September-October 1992
- Michael E. Porter, The Five Competitive Forces That Shape Strategy, Harvard Business Review, January 2008
- Institute for Strategy and Competitiveness, Harvard Business School, The Five Forces
- Hamilton Helmer, 7 Powers: The Foundations of Business Strategy, synopsis
- Cedric Chin, Commoncog, A summary of 7 Powers
- Morningstar, Equity Research Methodology, October 2020
- Abba P. Lerner, The Concept of Monopoly and the Measurement of Monopoly Power, Review of Economic Studies 1(3), 1934
- Gerard J. Tellis, The Price Elasticity of Selective Demand: A Meta-Analysis of Econometric Models of Sales, Journal of Marketing Research 25(4), 1988
- Tammo H. A. Bijmolt, Harald J. van Heerde, Rik G. M. Pieters, New Empirical Generalizations on the Determinants of Price Elasticity, Journal of Marketing Research 42(2), 2005
- Kevin Lane Keller, Conceptualizing, Measuring, and Managing Customer-Based Brand Equity, Journal of Marketing 57(1), 1993
- Paul Klemperer, Competition when Consumers have Switching Costs, Review of Economic Studies 62(4), 1995
- Joseph Farrell, Paul Klemperer, Coordination and Lock-In: Competition with Switching Costs and Network Effects, Handbook of Industrial Organization vol. 3, 2007
- Daniel Kahneman, Jack L. Knetsch, Richard Thaler, Fairness as a Constraint on Profit Seeking: Entitlements in the Market, American Economic Review 76(4), 1986
- Kahneman, Knetsch, Thaler, Fairness as a Constraint on Profit Seeking, full text, University of California, Berkeley course page
- Mark Zbaracki, Mark Ritson, Daniel Levy, Shantanu Dutta, Mark Bergen, Managerial and Customer Costs of Price Adjustment: Direct Evidence from Industrial Markets, Review of Economics and Statistics 86(2), 2004
- Jan De Loecker, Jan Eeckhout, Gabriel Unger, The Rise of Market Power and the Macroeconomic Implications, Quarterly Journal of Economics 135(2), 2020
- Susanto Basu, Are Price-Cost Markups Rising in the United States? A Discussion of the Evidence, Journal of Economic Perspectives 33(3), 2019
- Netflix, Letter to Shareholders, Q3 2011, 24 October 2011, SEC Form 8-K exhibit 99.1
- Andreas Hinterhuber, Towards Value-Based Pricing: An Integrative Framework for Decision Making, Industrial Marketing Management 33(8), 2004
Last updated Oct 9, 2026


Marketing agency or growth system: when a company outgrows its agency
An agency is the right call while the founder still runs most of the company. Once the business starts copying itself into new locations or markets, it needs a system that sets goals, tests hypotheses and owns the result.

Why healthcare marketing agencies stall: the short, mid and long wins model we use with clinics
Most agencies own the click and nobody owns the front desk. How we structure clinic work in three horizons, the research behind each one, and one year of results.

Why channel tests stall after month three
Most paid channel tests do not end with a decision. They end when the budget runs out, the attribution model changes, or everyone quietly stops looking at the dashboard.