The long and the short of it (60/40 rule)
Les Binet and Peter Field's analysis of IPA effectiveness cases, which found that brands tend to get the best results when they split marketing money between long-term brand building and short-term sales activation, at about 60:40 on average.
The Long and the Short of It is a 2013 IPA study by Les Binet and Peter Field of 996 advertising effectiveness cases. According to Binet and Field, campaigns reported the most very large business effects when about 60% of the budget went to brand building and 40% to sales activation. Their later work shows the best split varies, from 80:20 in financial services to 46:54 in B2B.
- Origin
- Les Binet and Peter Field, for the IPA, 2013; category splits 2018; B2B split 2019 with the LinkedIn B2B Institute
- Level
- 401 · Expert
- Fits
- Scale-up, Enterprise
- Time to apply
- half a day to classify last year's spend; a year or more to see the long-term effect of a change
- What you need
- last year's marketing spend, line by line, including paid search, promotions and sales incentives · a list of which spend aims at a response this month and which aims at future buyers · at least one long-term measure, such as market share, branded search or price elasticity · a finance lead who agrees to judge brand spend over more than one quarter
The Long and the Short of It is a study by Les Binet and Peter Field, published by the UK’s Institute of Practitioners in Advertising (IPA) in 2013, that compares what marketing achieves in the short term with what it achieves over years. Its best-known output is the 60:40 rule: across the cases they analysed, results peaked when about 60% of the budget went to brand building and 40% to sales activation.
Binet was head of effectiveness at the agency adam&eve DDB; Field is an independent consultant. The study built on their 2007 book Marketing in the Era of Accountability. According to the IPA’s summary slides, it was a meta-analysis of 996 campaigns for 700 brands in 83 categories, all drawn from the IPA Effectiveness Databank, the confidential data submitted with entries to the IPA Effectiveness Awards since 1980.
Two kinds of marketing
The study rests on a split between two jobs that marketing does. Sales activation is spend aimed at people ready to buy, designed to get a response now: a search ad, a discount, a retargeting banner, a sales call. Brand building is spend aimed at everyone who might buy one day, designed to be remembered: a TV spot, a sponsorship, a film people talk about.
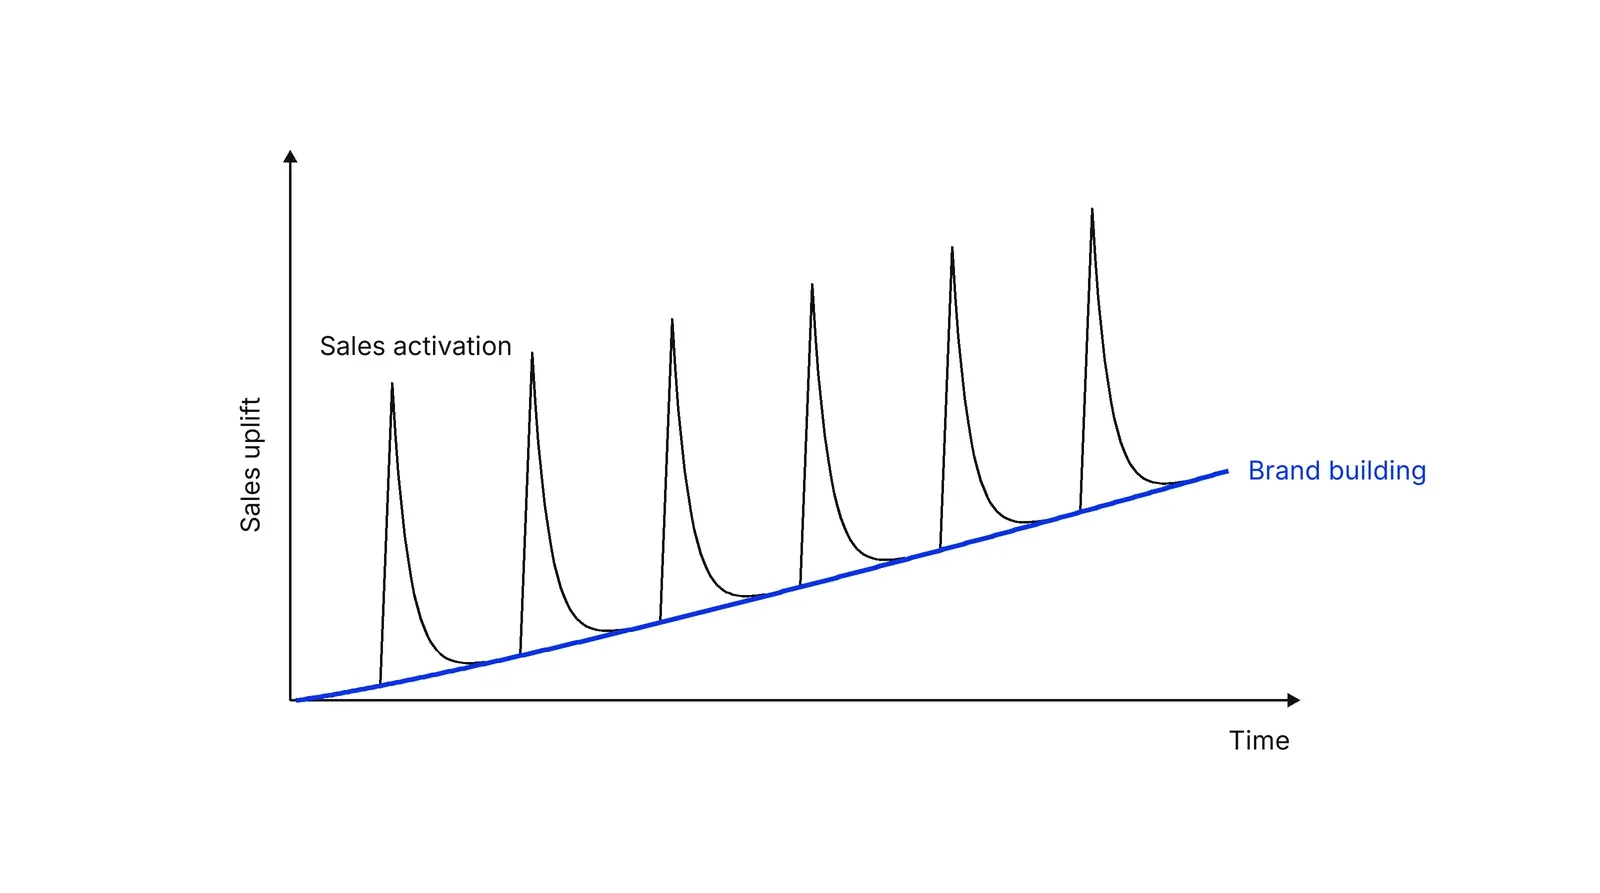
The two behave differently over time. Activation produces a quick spike in sales that soon fades. Brand building produces a smaller immediate effect that lasts and accumulates, and it makes buyers less sensitive to price. The slides put it as “no long term effects without short term”, and later work by the authors says long-term effects start to dominate after about six months.
Where the 60:40 figure comes from
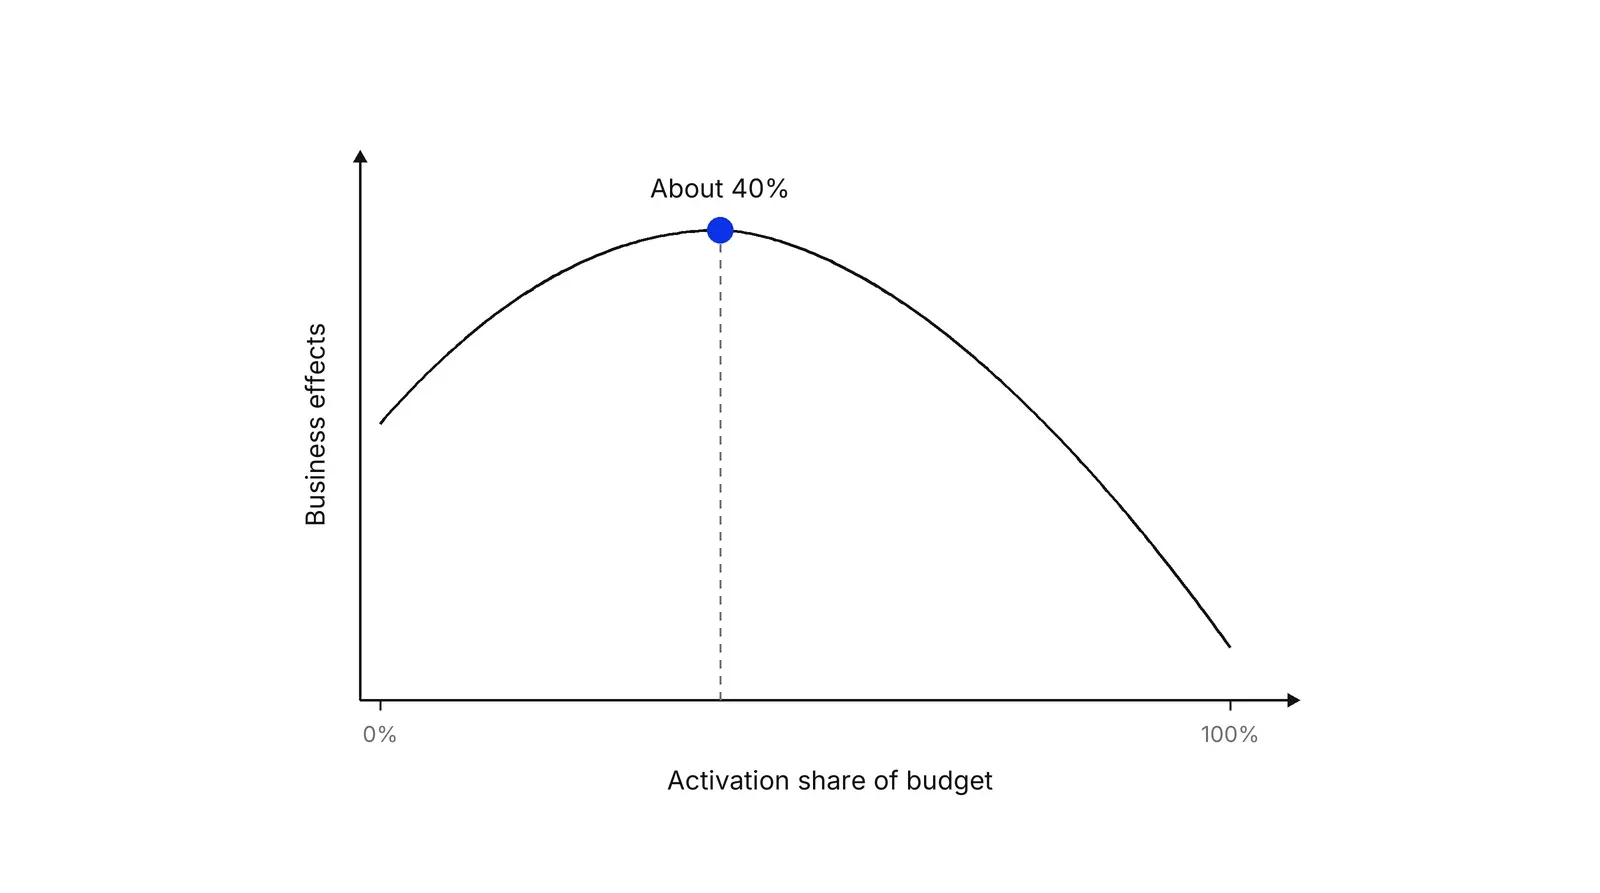
The 60:40 figure is an observed optimum, and it helps to know how it was measured. For each case, Binet and Field estimated what share of the budget went to activation and counted how many “very large” business effects the case reported (on profit, sales, market share, penetration, loyalty and price sensitivity). Plotted against each other, the two form an inverted U. The 2013 slide marks the top of that curve at an activation share of about 40%.
The authors kept checking the number. In 2017 Field presented their report Media in Focus and called 60% brand and 40% activation “still the best combination”, according to Advertising Council Australia. In Effectiveness in Context, presented in 2018 on 497 for-profit cases from 1998 to 2016, the all-context optimum came out at 62:38, which they say is unlikely to differ significantly from 60:40.
How the split varies by category
The average hides large differences. Effectiveness in Context gives the rule behind them: where brand building is hard or activation is easy, put more into brand; where brand building is easy or activation is hard, put more into activation.
| Context | Optimum brand : activation | Source |
|---|---|---|
| All for-profit cases | 62:38 | Effectiveness in Context |
| Financial services | 80:20 | Effectiveness in Context; B2B report |
| Non-automotive durables | 69:31 | Effectiveness in Context |
| Retail | 64:36 | Effectiveness in Context |
| FMCG | 60:40 | Effectiveness in Context |
| Other services | 51:49 | Effectiveness in Context |
| Travel, restaurants, media | 48:52 | Effectiveness in Context |
| B2B | 46:54 | B2B Institute report, 2019 |
| Not-for-profit | 44:56 | Effectiveness in Context |
| Brands in their first 1 to 2 years | 35:65 | Effectiveness in Context |
| Online or subscription sales | 74:26 | Effectiveness in Context |
The same report compares these optimums with what each sector spent. Per Effectiveness in Context, financial services averaged 54:46 in 2014 to 2016, 26 points short of its optimum on brand, and the authors call it the sector most out of balance. FMCG did the reverse and leaned more to brand than its optimum.
The B2B version: 46:54
In 2019 the LinkedIn B2B Institute commissioned the first B2B cut of the IPA data, published as The 5 Principles of Growth in B2B Marketing. Binet and Field found that efficiency peaked at around 46% brand and 54% activation, against 62:38 for the average consumer case in the same chart.
They are open about the limits. The B2B sample was fewer than 50 cases, skewed to the UK and to big budgets, and they write that the ratio “should not be followed too precisely”. They link the shift to their finding that B2B decisions are only slightly more rational than consumer ones, which brings rational activation messages a bit more to the fore. Work from the Ehrenberg-Bass Institute points the other way on emphasis: John Dawes estimates that only about 5% of B2B buyers are in the market at a given time, which argues for reaching the other 95% too.
What the evidence can and cannot show
The IPA data shows a pattern, and the pattern is correlational. The cases are award entries, so they lean toward campaigns that worked. Case authors rate their own effects on a four-point scale. Before 2014 the brand and activation shares were estimated from which channels were used, and the authors note that paid search and trade promotions are probably under-reported. No case was randomly assigned a budget split.
Critics have pressed on exactly this. Byron Sharp of the Ehrenberg-Bass Institute called award submissions “a very weird data set” at a 2022 summit, The Financial Services Forum reported. Mark Ritson accepted that the criticisms of method are fair but argued the conclusions still hold.
Independent research supports the mechanism, though not the exact ratio. In 55 controlled TV tests, Lodish and colleagues (1995) found that when extra advertising raised sales in the first year, the total effect, counting the two years after the test, was about double the first-year impact. A 2011 meta-analysis by Sethuraman, Tellis and Briesch put the average long-term advertising elasticity at 0.24, twice the short-term 0.12. A fair reading is to treat 60:40 and its variants as starting benchmarks, then test against your own data, for example with a marketing mix model. In Pushers’ marketing operational system work, the budget split is one line on the dashboard, measured over a year.
How to apply The long and the short of it (60/40 rule), step by step
- Sort last year's spend into two piles. Put every line of spend into brand building (broad reach, aimed at people who are not buying now, meant to be remembered) or sales activation (targeted, aimed at people ready to buy, meant to get a response now). Paid search, retargeting, promotions, affiliate fees and most lead generation go to activation. Result: your actual split, written as a ratio.
- Pick the benchmark for your context. Start from the published optimum closest to your business: about 60:40 overall, 80:20 for financial services, 64:36 for retail, 51:49 for other services, 46:54 for B2B. Then adjust for your situation: activation-heavy in the first year or two of a new brand, more brand weight if you sell online or by subscription. Result: a target ratio with the source of the number next to it.
- Measure the gap and decide on direction. Compare your actual split with the benchmark. A gap of a few points means little, since the benchmarks are rough averages. A gap of 20 points or more, like the financial services average the IPA data shows, is a reason to move. Result: a decision to shift toward brand, toward activation or to stay.
- Set measures for both time horizons. Keep the short-term measures you have (leads, sales, cost per acquisition) and add at least one that moves slowly: market share, share of search, the share of buyers who recall your brand, or how much you can raise prices without losing volume. Result: a dashboard where brand spend is not judged only by this month's leads.
- Shift in steps and test. Move budget a step at a time, for example 10 points of the total per half-year, ideally with a region or audience held back as a comparison, or check the change in a marketing mix model. Result: evidence from your own business that either confirms the direction or stops it.
Examples
Financial services in the IPA data
According to Binet and Field's Effectiveness in Context, financial services campaigns in the IPA Databank did best at about 80% brand and 20% activation, yet the average reported split for the sector in 2014 to 2016 was 54:46, a gap of 26 points. They describe it as the sector most out of line with its optimum. These are averages across award entries, so they say more about the sector than about any one bank or insurer.
A payments company splitting its budget
Illustrative, no real company implied. A payments company selling to online merchants spends a million a year on marketing: 850k on paid search, partner commissions and sales incentives, 150k on sponsorship and video. Its split is 15:85. Against the B2B benchmark of 46:54 it is short on brand by about 31 points. It moves 100k from the weakest search terms into video aimed at merchants who are not shopping for a provider yet, then tracks branded search volume and win rate for a year before moving more.
A new dental clinic in its first year
Illustrative, no real clinic implied. A newly opened dental clinic has no patients and no name in its district. The IPA data in Effectiveness in Context puts the best split for brands in their first one or two years at about 35:65, so most of its budget goes to bookings now: local search, maps listings, a first-visit offer. From the third year it moves toward the 57:43 the same data shows for launches after the early phase, with more money for local brand advertising.
When to use it
Use it when a company spends nearly all of its marketing budget on channels that report results within days, when growth from performance marketing has stalled while costs per acquisition rise, or when the leadership team argues about cutting brand spend to hit a quarter. It gives a published, evidence-based starting point for a budget split and a reason to measure over more than six months.
When not to use it
Do not use it as a formula for a brand-new product without proven demand, where the job is still to find buyers who respond at all. Treat it with care for very small budgets, single-channel businesses and markets far from the UK-heavy IPA sample. It does not tell you which campaign or channel to fund, only the rough balance between two kinds of work.
Common mistakes
- Quoting 60:40 as a law. Binet and Field present it as an average across hundreds of cases and publish very different optimums by sector, brand size and stage.
- Applying the consumer split to B2B, or the B2B split to a consumer brand. The B2B figure of 46:54 rests on fewer than 50 cases and the authors call it a rough estimate.
- Labelling rational product ads as brand building. In the IPA data these behave like activation, so counting them as brand spend overstates your brand share.
- Forgetting hidden activation spend, such as paid search run by another team, trade promotions or sales incentives, which makes the real split look more brand-heavy than it is.
- Judging the brand share after one quarter. In the 2013 study long-term effects only start to dominate after about six months.
FAQ
What is the 60/40 rule in marketing?
It is a finding from IPA effectiveness cases. According to Les Binet and Peter Field, campaigns reported the most very large business effects when about 60% of the budget went to long-term brand building and 40% to short-term sales activation. Their 2018 update put the overall figure at 62:38 and showed large differences by category.
What is the brand to activation ratio for B2B?
In their 2019 report for the LinkedIn B2B Institute, Binet and Field found B2B efficiency peaked at around 46% brand and 54% activation. The sample was fewer than 50 B2B cases, skewed to the UK and large budgets, so they say the ratio should not be followed precisely.
Does the 60:40 split apply to every category?
No. In Effectiveness in Context the optimum ranges from 80:20 in financial services to 48:52 in travel, restaurants and media, and 44:56 for not-for-profit campaigns. Brands in their first one or two years do best nearer 35:65, while online and subscription businesses sit near 74:26.
What is the difference between brand building and sales activation?
Brand building reaches people who are not buying now and leaves memories that make them more likely to choose the brand later, often at a higher price. Sales activation targets people ready to buy and prompts an immediate response, such as a click, a call or a purchase. Binet and Field argue a business needs both.
Is the 60:40 rule proven?
It is a pattern in observational data from IPA award entries, where case authors rate their own results, not an experiment. Byron Sharp of the Ehrenberg-Bass Institute has called award entries a very weird data set. Independent studies do confirm that advertising effects can last well beyond the campaign, which is the mechanism the rule depends on.
Sources
- IPA, Presentation: The long and short of it, Les Binet and Peter Field, September 2013
- Les Binet and Peter Field, The long and the short of it: 10 key principles of success, IPA presentation (PDF)
- Les Binet and Peter Field, Effectiveness in Context: A Manual for Brand Building, IPA (PDF)
- Thinkbox, Effectiveness in Context free download
- Les Binet and Peter Field, The 5 Principles of Growth in B2B Marketing, LinkedIn B2B Institute, 2019 (PDF)
- LinkedIn Marketing Solutions, B2B Ad Effectiveness Tips from Binet & Field
- WARC, The 5 principles of growth in B2B marketing: empirical observations on B2B effectiveness, April 2021
- IPA, Striking the right balance for your brand
- IPA, Effectiveness Databank
- Advertising Council Australia, Les Binet and Peter Field put marketing effectiveness on trial, August 2017
- WARC, Overview of Marketing in the Era of Accountability, Les Binet and Peter Field
- Ian Grant and Keith Crosier, review of Marketing in the Era of Accountability, University of Strathclyde, 2008
- IPA, The Crisis in Creative Effectiveness, Peter Field
- System1 Group, Saved by the baby: Binet and Field on Effectiveness in Context, October 2018
- LinkedIn B2B Institute, WARC and Lions, The B2B Effectiveness Code
- Ehrenberg-Bass Institute, The 95:5 rule is the new 60:40 rule (John Dawes)
- Leonard M. Lodish et al., A Summary of Fifty-Five In-Market Experimental Estimates of the Long-Term Effect of TV Advertising, Marketing Science 14(3), 1995
- Raj Sethuraman, Gerard J. Tellis, Richard A. Briesch, How Well Does Advertising Work? Generalizations from Meta-Analysis of Brand Advertising Elasticities, Journal of Marketing Research 48(3), 2011
- Marnik G. Dekimpe, Dominique M. Hanssens, The Persistence of Marketing Effects on Sales, Marketing Science 14(1), 1995
- Mark Ritson, Marketing Week, Binet and Field's research may not be perfect but that doesn't make it wrong, June 2019
- The Financial Services Forum, LinkedIn row breaks out over Binet and Field's 60:40 rule, August 2022
- B&T, Dan Machen, To Binet or not to Binet, that's not the question, September 2022
Last updated Oct 9, 2026


Marketing agency or growth system: when a company outgrows its agency
An agency is the right call while the founder still runs most of the company. Once the business starts copying itself into new locations or markets, it needs a system that sets goals, tests hypotheses and owns the result.

Why healthcare marketing agencies stall: the short, mid and long wins model we use with clinics
Most agencies own the click and nobody owns the front desk. How we structure clinic work in three horizons, the research behind each one, and one year of results.

The compliance layer under fintech marketing operations
A fintech marketing agency can build campaigns. It cannot own the compliance review, the KYC drop-off or the multi-market licensing rules that decide whether a lead ever becomes a customer.