Data maturity model
A data maturity model is a staged scale that rates how well an organization collects, manages and uses data, so a team can see where it stands and which gap to close next.
A data maturity model is a staged scale for rating how well an organization collects, governs and uses data, usually from ad hoc reporting up to analytics that drives decisions. Gartner, Davenport and Harris, the CMMI Institute and BCG each publish one. The stages are frameworks, not measured laws, so use them to find your weakest area, not to chase a level.
- Origin
- No single author. Descended from the SEI software maturity framework; published variants by Gartner, Davenport and Harris, the CMMI Institute and BCG with Google, 1986 (SEI framework); 2007; 2014; 2019
- Level
- 301 · Advanced
- Fits
- Scale-up, Enterprise
- Time to apply
- Half a day to score, one week to check the evidence
- What you need
- one published model chosen as your vocabulary · 4 to 6 people who see data from different sides: marketing, product, finance, engineering · the documents that prove each score: a tracking plan, a dashboard, a data owner list
A data maturity model is a staged scale that rates how well an organization collects, manages and uses data, from scattered spreadsheets at the bottom to analytics that shapes decisions at the top. There is no standard version. Gartner, Davenport and Harris, the CMMI Institute and BCG with Google each publish their own, and they cut the scale into different numbers of steps. This page compares four, says what the evidence behind them is, and shows how to use any of them without treating the stages as a law of nature.
Where the idea comes from
Data maturity models copy a pattern from software engineering. The Software Engineering Institute (SEI) at Carnegie Mellon began building a process maturity framework in 1986, and its Capability Maturity Model for Software, version 1.1, appeared in 1993. An earlier staged idea came from Richard Nolan, who described stages of computing growth in a 1979 Harvard Business Review article. Data models borrow the ladder shape: a few levels, each one more orderly than the last.
Four published models side by side
The four models answer slightly different questions, which is why they should not be merged.
| Model | Source and date | Steps | What it measures |
|---|---|---|---|
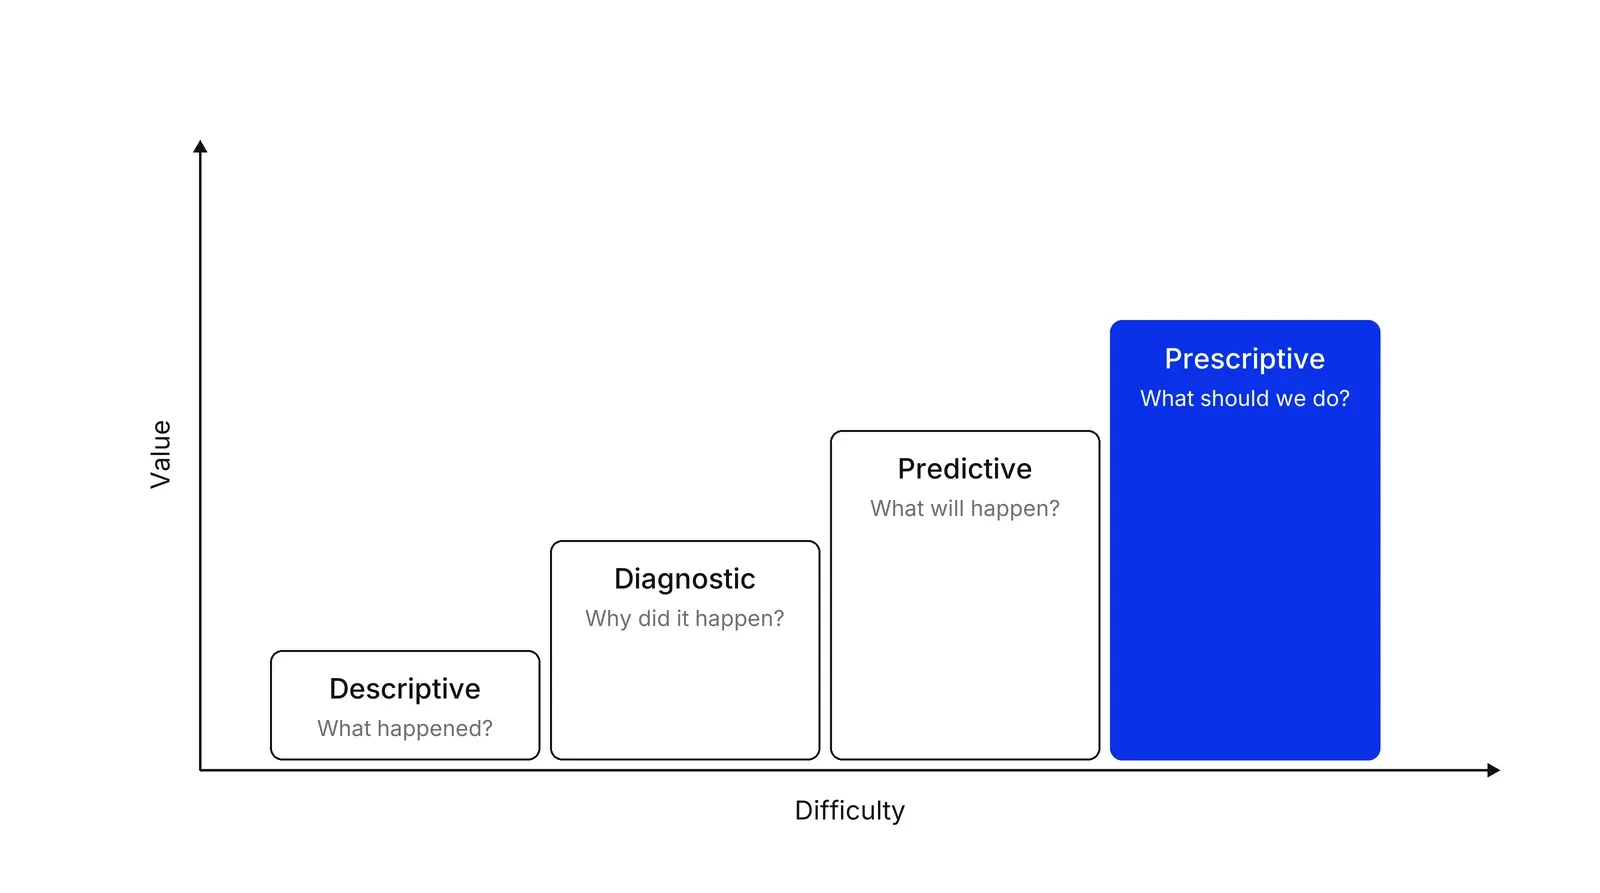
| Analytics ascendancy | Gartner; described in a 2019 preprint | Descriptive, diagnostic, predictive, prescriptive | Type of analysis, ranked by difficulty and value |
| Data and analytics maturity | Gartner, 2018 survey of 196 organizations, reported by MacTech | Five levels | Self-rated overall maturity |
| Stages of analytical competition | Davenport and Harris, 2007 | Five stages, from analytically impaired to analytical competitors | How far analytics reaches across the firm |
| Data Management Maturity (DMM) | CMMI Institute, 2014 | Five capability levels, six categories, 25 process areas | Management practices, such as governance and data quality |
| Digital marketing maturity | BCG for Google, 2019 | Nascent, emerging, connected, multimoment | Marketing data use across channels |
We could not open Gartner’s original ascendancy document, so that row relies on a research preprint that describes it as an “analytic value escalator” in which higher analysis types bring more value and more difficulty. For Davenport and Harris we could read only reviews: Information Age names the bottom and top stages and describes the bottom one as flying blind and asking backward-looking questions. The article that started the line of work is Davenport’s 2006 HBR piece.
The DMM is the most operational of the four. The SD Times reported in 2014 that it was built on CMMI principles with the Enterprise Data Management Council and reviewed by more than 140 experts. InfoQ’s interview with its program manager gives 25 process areas and more than 300 practice statements. The numbers moved during development: a 2012 SEI update listed 6 categories and 15 component areas. Level names differ between the secondary descriptions we found, so we leave them out.
The BCG study, published in 2019 and commissioned by Google, surveyed senior marketers at more than 200 brands during 2018. About 90% fell between emerging and connected. It reports that companies at the top stage claimed cost savings of up to 30% and revenue gains of up to 20%, and those figures are the companies’ own reports, not measured results. We found no earlier 2017 version.
What the evidence supports
Most of it is self-reported. In Gartner’s 2018 survey, respondents rated themselves: 5% at level 1, 21% at level 2, 34% at level 3, 31% at level 4 and 9% at level 5. A rating by the people being rated says what they believe about themselves.
Two studies are stronger. Brynjolfsson, Hitt and Kim studied 179 large firms and found that data-driven decision making went with output and productivity 5 to 6% above what the firms’ other investments predicted. They also ran tests against reverse causality. That study measures practices, not scores on any of the models above. Lismont and colleagues surveyed firms on five dimensions and used clustering to derive four stages: no analytics, bootstrappers, sustainable adopters and disruptive innovators. Their stages came from the data, not from a vendor’s diagram.
The stages are frameworks, not measured laws
We found no study showing that firms move through any of these stages in order, or that each stage causes the next benefit. The track record of the older staged models is a warning. King and Kraemer assessed Nolan’s stage model in 1983 and concluded it was a useful organizing framework but not the empirically validated model its supporters claimed.
Maturity-model research raises the same concerns. Becker, Knackstedt and Pöppelbuß counted more than a hundred IT maturity models in 2009 and described their development methods as poorly documented. Röglinger, Pöppelbuß and Becker tested ten process-management models and found that design principles for prescriptive use, meaning telling you how to improve, were hardly met. Treat a stage as a description of what organizations at that stage tend to do, not as a roadmap with guaranteed returns.
Gartner’s own 2011 framework points the same way: it says there is no single right instantiation and puts people and process next to platform.
Use it as a profile, not a rank
Score areas separately. A single level hides the thing that holds you back, as the illustration shows.
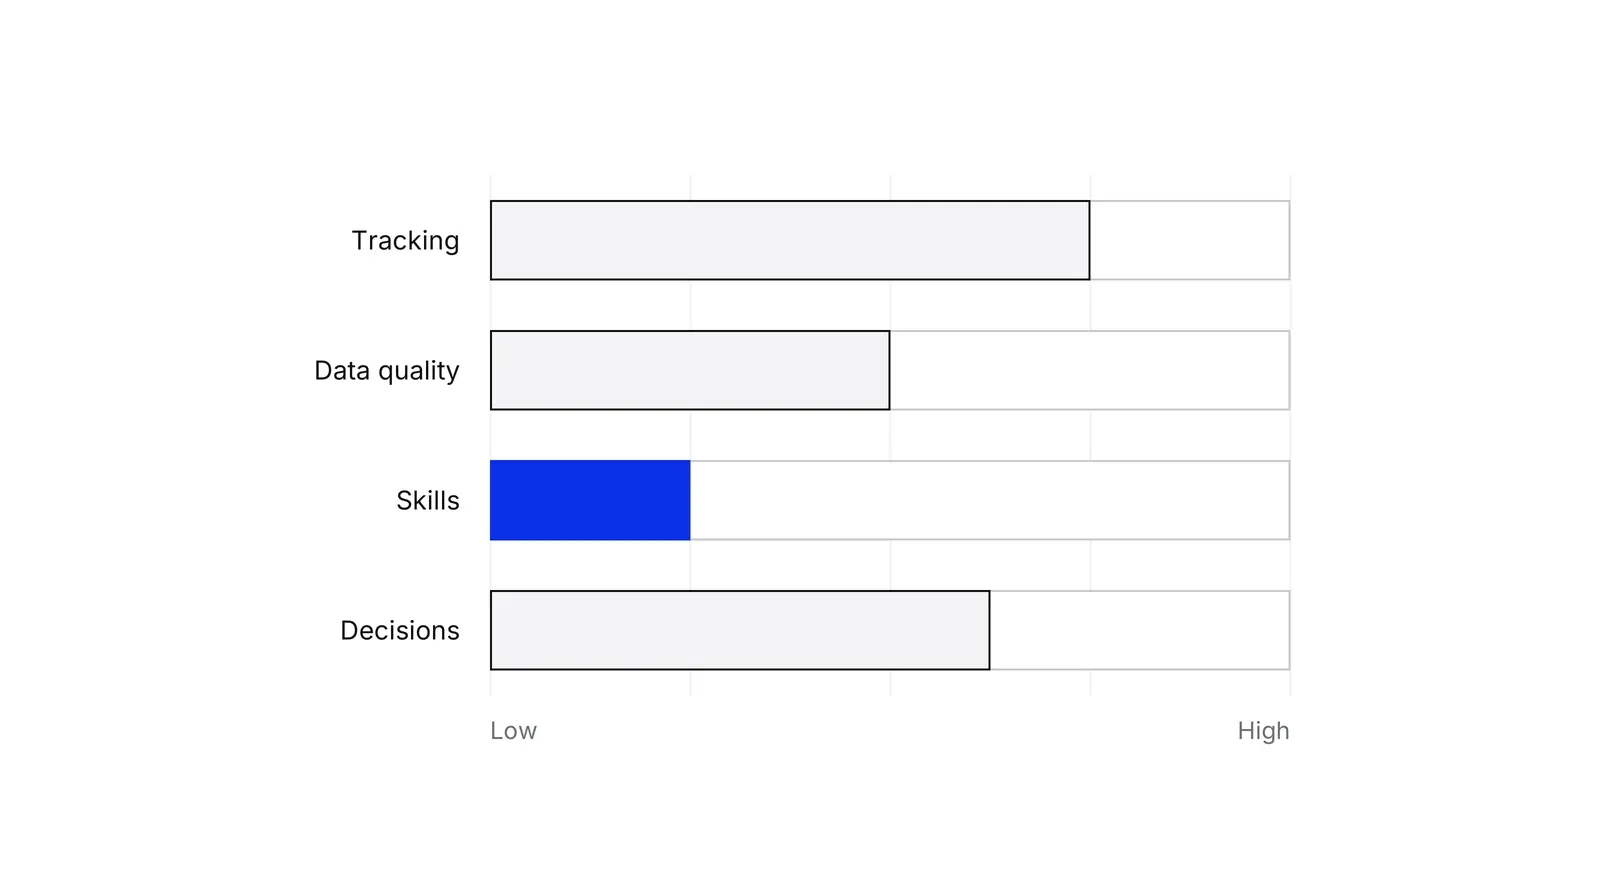
Each area connects to a framework you can act on. Tracking is an event tracking plan. Joined customer records come from a customer data platform. Trust in channel numbers depends on unified measurement. Decisions improve when metrics hang on a KPI tree with named owners. A Growth Lab plan starts from a profile like this, then picks the one area whose improvement changes a real decision.
How to apply Data maturity model, step by step
- Pick one model and keep it. Choose a single published scale, such as Gartner's five levels or the CMMI Institute's DMM, and do not mix stage names from several. Result: one shared vocabulary for every later conversation.
- Split data work into 4 to 6 areas. Score areas separately, for example tracking, data quality, ownership, skills and use in decisions. The DMM does the same, with six categories. Result: a list of areas instead of one blurred company-wide level.
- Score each area from evidence, not opinion. For each score, ask for an artifact: the tracking plan, the dashboard opened in the last leadership meeting, the named owner of a metric. No artifact, no score above the lowest level. Result: scores that a skeptical colleague can check.
- Find the weakest area that blocks a decision. Take the lowest score and ask which business decision it stops. A weak data quality score matters if it makes you distrust the conversion report you plan budget on. Result: one gap tied to a named decision.
- Set a one-step target with a metric. Aim to move one or two areas up a single step, and attach a measurable result from your KPI tree. Skipping steps is how teams buy tools they cannot use. Result: a target with an owner and a date.
- Re-score on a schedule. Repeat the same scoring in six months with the same evidence rules and the same people. Result: a trend you can compare, not a one-off snapshot.
Examples
A dental clinic group planning its fourth site
Illustrative. The group scores five areas from 1 to 5. Tracking gets a 4: online bookings are tagged and reach the booking system. Data quality gets a 3. Skills gets a 2, because one analyst builds every report. Decisions gets a 3. An overall average of 3.2 would suggest everything is roughly fine. The profile says otherwise: the single analyst caps how fast the group can answer questions. The one-step target is to train two site managers to read the dashboard, so skills moves from 2 to 3.
A payments startup preparing for a regulator's data review
Illustrative. The startup scores itself high on analytics, with a churn model in production, but low on ownership: nobody is named for transaction data definitions, and two teams count active customers differently. Following the DMM's logic, where governance and data quality are categories of their own, the startup postpones a second model and spends the quarter on definitions and owners. The result to check is one agreed definition of an active customer.
When to use it
Use it when leadership asks whether the company is ready for a larger analytics investment, when two teams argue over whose numbers are right, or before choosing a data platform. It gives a shared scale for the first honest conversation about gaps.
When not to use it
Skip it when the problem is one broken report or one missing event, where a tracking plan fixes it in a day. Do not use a score as a target to report upward, and do not buy a benchmark report to learn how you compare, because many published figures are self-rated by the respondents.
Common mistakes
- Treating the top level as the goal. A clinic with three sites does not need prescriptive analytics. Match the level to the decisions you actually make.
- Using one overall score. Averages hide the weakest area, which is usually the one limiting the rest.
- Scoring from opinion. Gartner's 2018 figures come from organizations rating themselves, and a self-rating with no artifact behind it cannot be checked.
- Skipping stages. Buying predictive tooling when the tracking plan is incomplete means models trained on missing data.
- Making maturity an IT project. A 2021 survey of data executives found 92% named people, process and culture, not technology, as the main barrier to becoming data-driven.
FAQ
What are the levels of data maturity?
It depends on the model. Gartner's data and analytics model has five levels, Davenport and Harris describe five stages from analytically impaired to analytical competitors, the CMMI Institute's DMM has five capability levels, and BCG with Google uses four stages from nascent to multimoment. No single scale is standard.
What is a data management maturity model?
It is a maturity model for how data is managed, not only analyzed. The CMMI Institute's Data Management Maturity (DMM) model, released in 2014, covers six categories, including strategy, governance and data quality, across 25 process areas, and is assessed against five capability levels.
How do you assess data maturity?
Pick one model, score four to six areas separately, and require an artifact for each score, such as a tracking plan or a named metric owner. Then find the lowest area that blocks a real decision and plan a one-step improvement. Re-score after six months.
Is a higher data maturity level always better?
No evidence says so for every company. The best-known link is Brynjolfsson, Hitt and Kim's 2011 study of 179 firms, which tied data-driven decision making to 5 to 6% higher productivity, but it studied practices, not stage scores. Higher stages cost more, so match the level to your decisions.
Sources
- BCG, Dividends of digital marketing maturity (Field, Patel, Leon), 2019
- MacTech, reporting Gartner's 2018 survey on data and analytics maturity
- Gartner, Gartner's Business Analytics Framework, G00219420, 2011
- Leonard Heilig et al., From digitalization to data-driven decision making in container terminals, arXiv preprint, 2019
- Harvard Business Review, Thomas H. Davenport, Competing on analytics, 2006
- Information Age, Ian Cowley, Competing on analytics (review of Davenport and Harris), 2007
- Harvard Business Review, Thomas H. Davenport, Analytics 3.0, 2013
- SD Times, CMMI Institute looks to improve data management with DMM model, 2014
- InfoQ, Improving data management with the DMM (Melanie Mecca interview), 2014
- Software Engineering Institute, Rawdon Young, Data Management Maturity (DMM) Model update, 2012
- Software Engineering Institute, Paulk et al., Capability Maturity Model for Software, Version 1.1, 1993
- Harvard Business Review, Richard L. Nolan, Managing the crises in data processing, 1979
- John L. King, Kenneth L. Kraemer, Evolution and organizational information systems: an assessment of Nolan's stage model, ICIS 1983
- Jörg Becker, Ralf Knackstedt, Jens Pöppelbuß, Developing maturity models for IT management, Business and Information Systems Engineering 1(3), 2009
- Jens Pöppelbuß, Maximilian Röglinger, What makes a useful maturity model?, ECIS 2011
- Maximilian Röglinger, Jens Pöppelbuß, Jörg Becker, Maturity models in business process management, Business Process Management Journal 18(2), 2012
- Roy Wendler, The maturity of maturity model research: a systematic mapping study, Information and Software Technology 54(12), 2012
- Erik Brynjolfsson, Lorin Hitt, Heekyung Kim, Strength in numbers: how does data-driven decisionmaking affect firm performance?, ICIS 2011
- Jasmien Lismont, Jan Vanthienen, Bart Baesens, Wilfried Lemahieu, Defining analytics maturity indicators: a survey approach, International Journal of Information Management 37(3), 2017
- MIT Sloan Management Review, Thomas H. Davenport, Randy Bean, Execs bullish on AI but wary of data leadership, 2021
Last updated Oct 9, 2026


Marketing agency or growth system: when a company outgrows its agency
An agency is the right call while the founder still runs most of the company. Once the business starts copying itself into new locations or markets, it needs a system that sets goals, tests hypotheses and owns the result.

Why healthcare marketing agencies stall: the short, mid and long wins model we use with clinics
Most agencies own the click and nobody owns the front desk. How we structure clinic work in three horizons, the research behind each one, and one year of results.

The compliance layer under fintech marketing operations
A fintech marketing agency can build campaigns. It cannot own the compliance review, the KYC drop-off or the multi-market licensing rules that decide whether a lead ever becomes a customer.