Attribution models
Attribution models are rules that decide which marketing touchpoint gets credit for a sale; the classic rule-based ones divide credit by position or timing, which makes them useful for reporting and unreliable as proof of what worked.
An attribution model is a rule for deciding which marketing touchpoints get credit for a conversion. The five classic rule-based models are last click, first click, linear, time decay and position-based. They divide credit by a touch's position or timing, not by what it caused, so they describe the path to a sale without showing which ads actually produced it.
- Origin
- Digital analytics practice with no single inventor; formalised in tools such as the Google Analytics model comparison report, No single date; Google retired four rule-based models in 2023
- Level
- 201 · Tool
- Fits
- Startup, Small and mid-size, Scale-up
- Time to apply
- half a day to compare models on one conversion, then a quarter to test the biggest gaps
- What you need
- an analytics or ad account that records the touchpoints before a conversion · one conversion that matters, such as a booking, a paid order or a first transaction · 30 to 90 days of path data for that conversion
An attribution model is a rule that decides which touchpoints get credit for a conversion. A buyer rarely arrives through one door: an ad, an article, an email, then a search for your name. The model turns that path into a split of credit, and the split becomes the channel report that budgets follow. No single person invented the rule-based versions. They grew out of web analytics tools, and Google’s own help documents describe them in the same terms: 100% to the last click, 100% to the first, an equal split, or a weighting by time or position.
The important point is what a rule can and cannot do. A rule divides sales that already happened. It does not observe what the buyer would have done without the ad, which is the question a budget decision turns on.
The five rule-based models
Each rule gives a different winner for the same sale. Google’s analytics help defines last interaction as 100% of credit to the final click before the conversion, first interaction as 100% to the click that began the path, and position-based as 40% to the first and last interactions with the remaining 20% spread across the middle. Linear splits credit equally. Time decay gives more to touches closer to the sale.
| Model | Rule | Favours | Blind spot |
|---|---|---|---|
| Last click | 100% to the final touch | Channels near the purchase, such as brand search and email | Everything that built the intent |
| First click | 100% to the first touch | Discovery channels | Everything that closed the deal |
| Linear | Equal share to every touch | Channels that appear often | Treats a banner glimpse like a sales call |
| Time decay | More credit nearer the sale | Closers, with some credit to earlier touches | Slow-burn channels with long cycles |
| Position-based | 40% first, 40% last, 20% shared | A balance of opener and closer | The 40/20/40 split is a convention, not a finding |
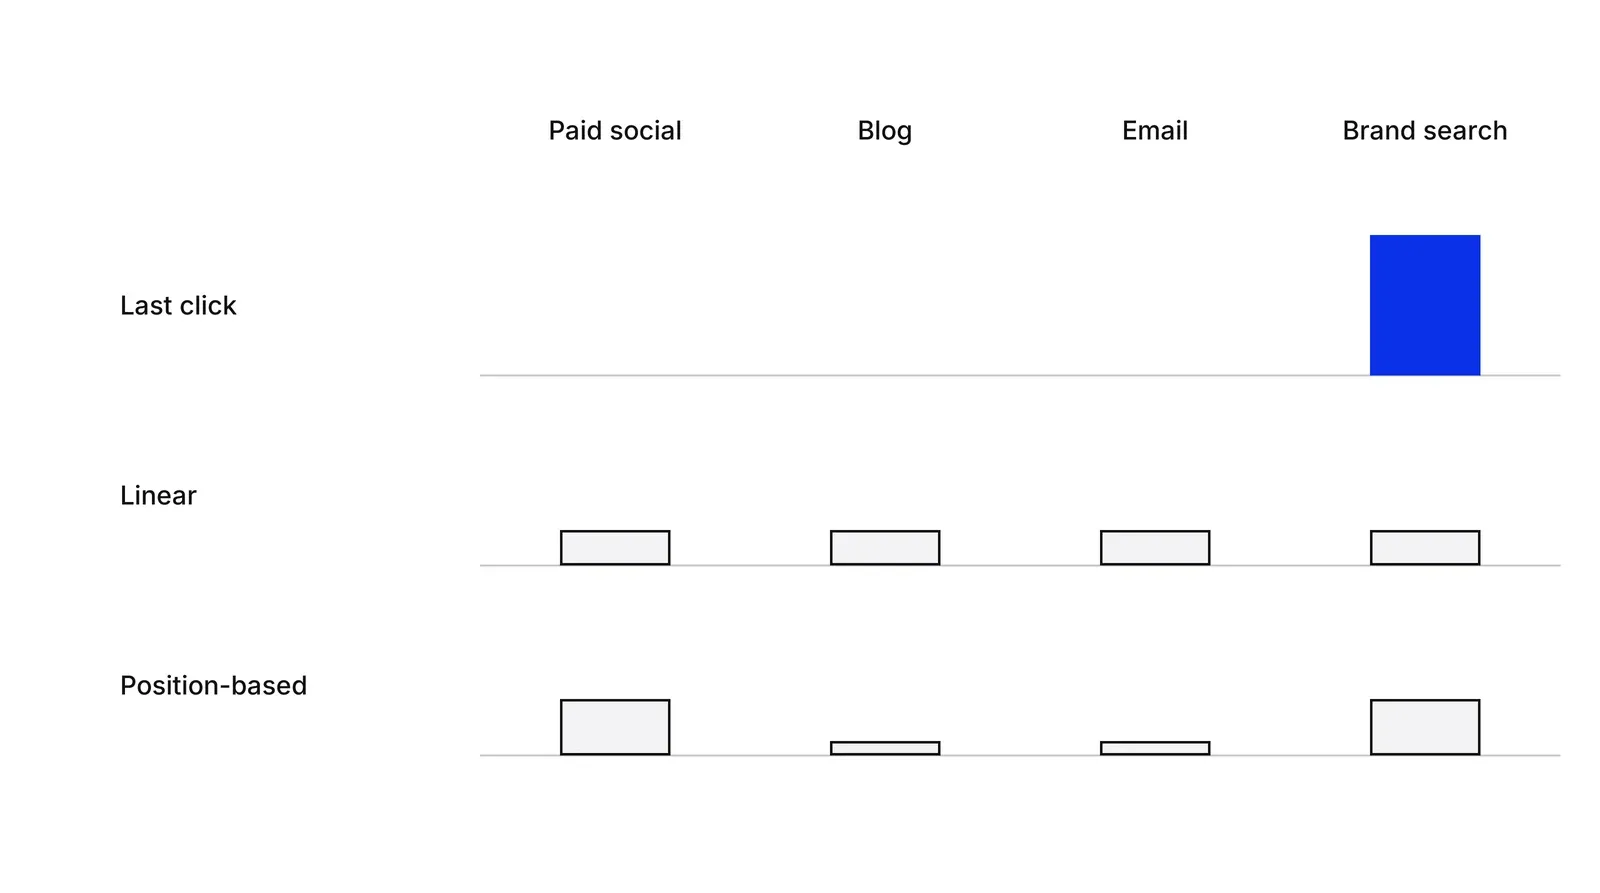
The weights in the table come from convention. Nothing in the data says the first and last touches deserve 40% each. Research on attribution models treats this as the central weakness: Kannan, Reinartz and Verhoef’s survey of the field describes the aim of attribution as estimating each touch’s incremental value, which a fixed rule does not do.
Why rule-based models are not causal
Credit is not cause. A person who searched for your clinic by name was likely to book already, and the click that preceded the booking gets all the credit under last click. Blake, Nosko and Tadelis tested this with eBay, and their abstract reports that brand-keyword ads had no measurable short-term benefit and that returns from paid search were a fraction of conventional non-experimental estimates.
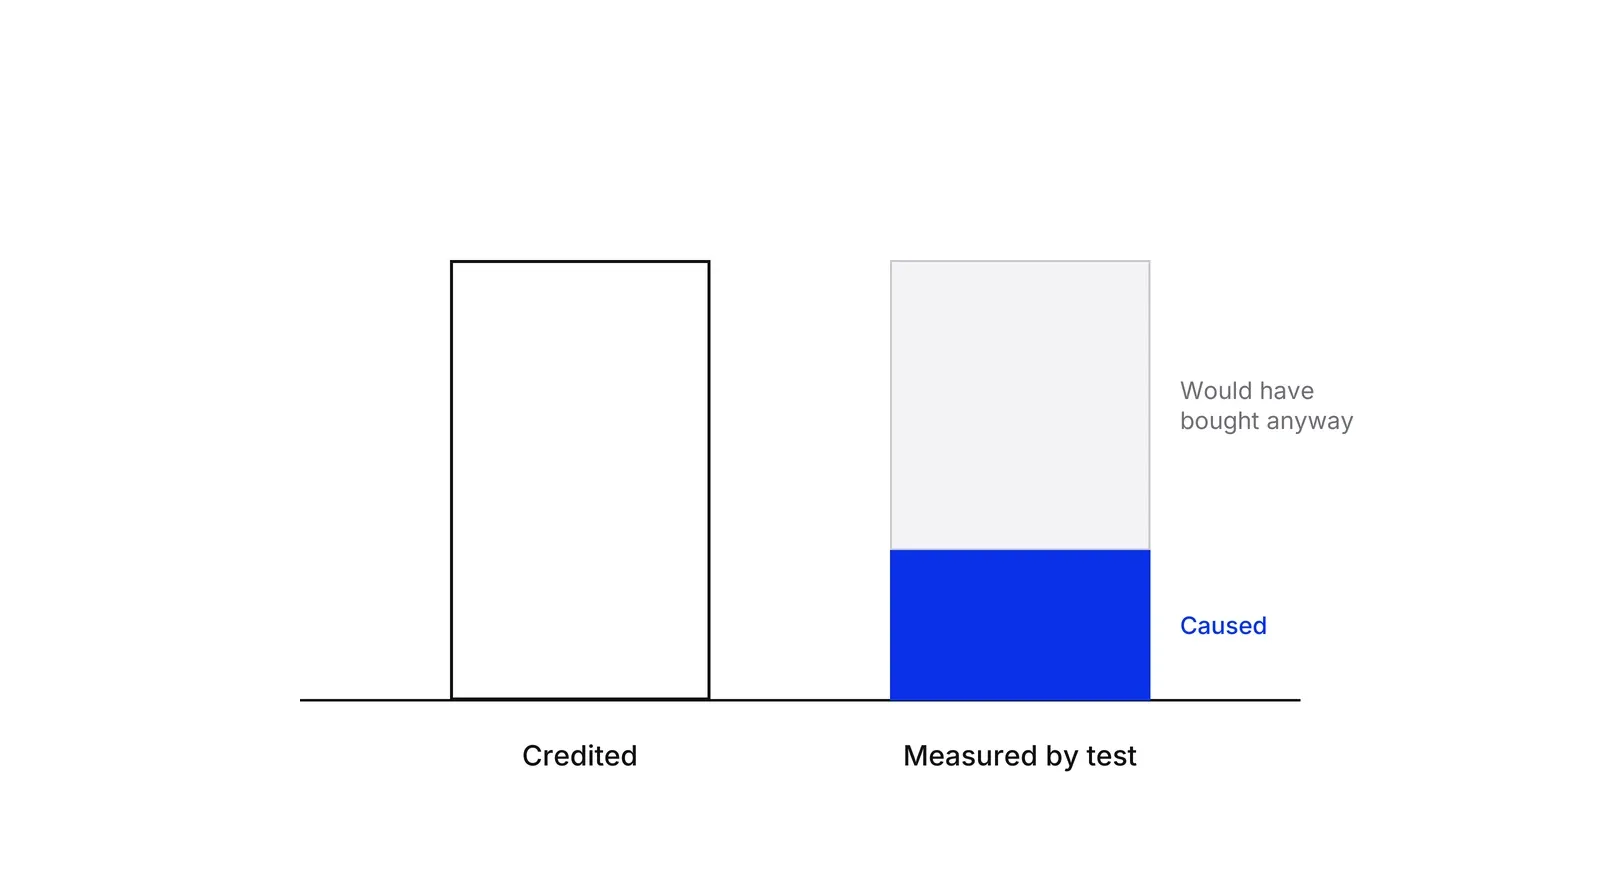
Experiments elsewhere agree. Gordon and colleagues compared observational methods with randomized tests at Facebook and found that observational methods often fail to recover the true treatment effects. Their 2023 follow-up, using 663 experiments, concluded that even with rich data they could not reliably estimate an ad campaign’s causal effect without experiments. Lewis and Rao ran 25 large field experiments and report that selection bias, caused by the targeted nature of advertising, is a crippling concern for observational methods.
Rules also fail on what they cannot see. In a Yahoo experiment, Lewis and Reiley found that 78% of the sales increase came from consumers who never click the ads, per the authors’ seminar description, and 93% of it happened in stores. A click-based rule has nothing to credit there. Shares of dark social and word of mouth are invisible for the same reason, as the dark social page explains.
Berman adds a second problem: the rule itself changes behaviour. In his analysis of publisher incentives, last-touch attribution is shown to overincentivize ad exposures, often resulting in lower advertiser profits. The Shapley value, a game-theory method from 1953, performed better in his model.
What Google retired in 2023
Google announced on 6 April 2023 that first click, linear, time decay and position-based would leave Google Ads and GA4. Its help page gives the schedule: from June 2023 the models could not be selected for conversion actions not already using them, and from September 2023 conversion actions still using them switched to data-driven attribution, or to last click if the advertiser chose it. The company said that less than 3% of Google Ads web conversions used the four models, based on February to March 2023 data.
Google Analytics help now lists only data-driven, paid and organic last click, and Google paid channels last click, and states that the four models are “no longer available as of November 2023”. Google Ads help lists last click and data-driven, with data-driven the default for most conversion actions. If you want a linear or position-based view of Google data today, you rebuild it outside these tools.
Yandex Metrica attribution models
Yandex Metrica’s help describes four models: last click, cross-device first click, cross-device last significant click, and automatic attribution. Last click gives each visit its own source with no visit history. Last significant click gives visits from insignificant sources, such as direct visits, to the previous significant source. Automatic attribution combines cross-device conversion detection with household accounting built on anonymized data, with its data counted from 8 April 2023.
The help also says that from 20 May 2026 the models first click, last significant click, last click from Direct and last click from Direct cross-device are disabled in Metrica and Direct, and that saved reports switch to current models. The visit-history window is 90 days between visits, and users cannot change it. Check your own account before you rely on any of this, because Yandex edits these pages and the text of its help is not fully consistent across sections.
Where data-driven attribution fits
Data-driven attribution replaces fixed weights with a model fitted to converting and non-converting paths. Google says its model compares what happened with what could have occurred and recommends at least 200 conversions and 2,000 ad interactions in 30 days for a good fit. Earlier academic work along these lines includes Shao and Li in 2011 and Dalessandro and colleagues in 2012, who framed attribution as a causal estimation problem. Li and Kannan found that channel contributions from their model differed significantly from other metrics in use, and Anderl and colleagues report that their path models differ substantially from heuristics such as last click. It still credits only touches that a platform can observe, so it is a better report, not a replacement for experiments. The queued page on data-driven attribution and MTA covers the method.
Pairing rules with causal measurement
Use two or three rules side by side for trends, and use incrementality testing or geo-lift testing where the budget is large. Marketing mix modeling covers channels that leave no click, and unified measurement shows how the three layers fit together. Johnson, Lewis and Nubbemeyer’s ghost ads method describes a cheaper way to build the holdout, with at least an order of magnitude lower cost than older designs for an equally precise lift. A Growth Lab plan starts from a report that shows credit under several rules, then picks the one or two channels to test.
How to apply Attribution models, step by step
- Pick one conversion and one window. Choose the single event that pays the bills, such as a paid booking or a first card payment, and fix a lookback window, for example 30 days. Mixing conversions or windows makes models impossible to compare. Result: one conversion and one window written at the top of the report.
- Run the same data through two or three rules. Take last click, first click and one spread model such as linear or position-based. Google no longer offers the spread models, so compute them from exported paths in a spreadsheet or your warehouse. Result: a table with channels as rows and each rule's credit as columns.
- Mark the channels whose credit swings. A channel that keeps its share under every rule is measured reasonably well. A channel that moves from 40% to 5% depends on the rule you picked. Result: a short list of channels where the model, not the market, decides the number.
- Ask what each swing channel would do without ads. For every channel on the list, name the people who would have bought anyway, such as those searching for your brand by name. Result: a ranked list of channels where credit is most likely to exceed cause.
- Test the top one or two. Run a holdout or a regional test on the channels at the top of the list, following the incrementality and geo-lift pages. Result: a measured lift for the channels where budget decisions are largest.
- Fix a reporting rule and stop arguing about it. Choose one rule for the weekly report, say so in the report header, and change it only when tests disagree with it. Result: one stable number for trends, plus a calibration note from the latest tests.
Examples
eBay and its own brand name
In a field experiment, Blake, Nosko and Tadelis found that brand-keyword ads, where eBay paid for people searching its own name, had no measurable short-term benefit. Most of the clicks and sales the ads were credited with arrived through unpaid search when the ads were switched off. A last-click report counts every one of those sales as paid search success.
A dental clinic with a four-touch path
Illustrative, no real clinic implied. A patient books an implant consultation worth 100 in first-visit value. The path is a paid social ad, a blog article found in search, a clinic newsletter, then a search for the clinic's name. Last click gives all 100 to brand search. First click gives all 100 to the social ad. Linear gives 25 to each. Position-based gives 40 to the ad, 10 each to the article and email, and 40 to brand search. Same patient, four different budget stories.
A cross-border payments company
Illustrative, no real company implied. A B2B payments company sees that 70% of last-click sign-ups come from brand search and from direct visits. It moves budget from podcast sponsorships to more brand keywords. Sign-ups from those keywords look flat because those buyers were already looking for the company, and over the next quarter new-lead volume falls. The cut channel had created the later branded searches that last click credited elsewhere.
When to use it
Use rule-based models for weekly reporting, for spotting which channels look different under different rules, and as a first draft before testing. They are free in most tools, easy to explain and stable from week to week, which makes them good for trends. Use two or three of them side by side, not one.
When not to use it
Do not use a rule-based model to justify moving a large budget, to prove that a channel works, or to compare a channel that leaves clicks (search) with one that mostly works through views and word of mouth. Those decisions need an experiment, a marketing mix model or both.
Common mistakes
- Treating the model's output as a measurement of effect, when it only divides the sales that already happened.
- Reading last click as proof that brand search or direct drives sales, when many of those visitors were already decided.
- Changing the attribution model mid-quarter and reading the resulting shifts as performance changes.
- Comparing a platform's own attributed numbers with analytics numbers without checking that windows and rules match.
- Choosing a model because it makes your favourite channel look good, then using it to defend the budget.
FAQ
What are the main attribution models?
The five classic rule-based models are last click, first click, linear, time decay and position-based. They credit the final touch, the first touch, every touch equally, the touches closest to the sale, or 40% each to the first and last with 20% shared in the middle. Data-driven attribution is a separate, algorithmic family.
Which attribution models does Google Ads still offer?
Google Ads help lists last click and data-driven, with data-driven the default for most conversion actions. First click, linear, time decay and position-based are no longer supported there. Google announced their removal on 6 April 2023, and GA4 stopped offering them in November 2023.
What attribution models does Yandex Metrica have?
Metrica's help describes last click, cross-device first click, cross-device last significant click and automatic attribution. It states that from 20 May 2026 the models first click, last significant click and the two last-click-from-Direct models are disabled in Metrica and Direct. Saved reports move to current models automatically.
Why are rule-based attribution models not causal?
They divide credit among touches that happened. They never observe what the buyer would have done without the ad. Experiments at eBay and Facebook found that observational estimates often miss the true effect, sometimes by a wide margin, because people who click ads tend to be people already likely to buy.
Is data-driven attribution the same as incrementality?
No. Google says its data-driven model contrasts what happened with what could have occurred. It still works inside one platform and credits only the touches that platform can see, so it needs a holdout or geo test as a check.
Sources
- Google Ads Help, First click, linear, time decay, and position-based attribution models are going away
- Google Ads Help, About attribution models
- Google Ads Help, About data-driven attribution
- Google Analytics Help, Advertising and attribution (GA4)
- Google Analytics Help, Attribution modeling overview (Universal Analytics)
- Yandex Metrica Help, Attribution models
- Yandex Metrica Help, Attribution models and cross-device
- Ron Berman, Beyond the Last Touch: Attribution in Online Advertising, Marketing Science 37(5), 2018
- Brett R. Gordon, Florian Zettelmeyer, Neha Bhargava, Dan Chapsky, A Comparison of Approaches to Advertising Measurement: Evidence from Big Field Experiments at Facebook, Marketing Science 38(2), 2019
- Brett R. Gordon, Robert Moakler, Florian Zettelmeyer, Close Enough? A Large-Scale Exploration of Non-Experimental Approaches to Advertising Measurement, Marketing Science 42(4), 2023
- Thomas Blake, Chris Nosko, Steven Tadelis, Consumer Heterogeneity and Paid Search Effectiveness: A Large-Scale Field Experiment, NBER Working Paper 20171, 2014
- Thomas Blake, Chris Nosko, Steven Tadelis, Consumer Heterogeneity and Paid Search Effectiveness, Econometrica 83(1), 2015
- Randall A. Lewis, Justin M. Rao, The Unfavorable Economics of Measuring the Returns to Advertising, Quarterly Journal of Economics 130(4), 2015
- Randall A. Lewis, David H. Reiley, Online ads and offline sales: measuring the effect of retail advertising via a controlled experiment on Yahoo!, Quantitative Marketing and Economics 12(3), 2014
- UC Berkeley School of Information, Online Ads and Offline Sales, seminar description, 2014
- Hongshuang (Alice) Li, P. K. Kannan, Attributing Conversions in a Multichannel Online Marketing Environment, Journal of Marketing Research 51(1), 2014
- Eva Anderl, Ingo Becker, Florian von Wangenheim, Jan H. Schumann, Mapping the customer journey: Lessons learned from graph-based online attribution modeling, International Journal of Research in Marketing 33(3), 2016
- P. K. Kannan, Werner Reinartz, Peter C. Verhoef, The path to purchase and attribution modeling: Introduction to special section, International Journal of Research in Marketing 33(3), 2016
- Brian Dalessandro, Claudia Perlich, Ori Stitelman, Foster Provost, Causally motivated attribution for online advertising, ADKDD 2012
- Xuhui Shao, Lexin Li, Data-driven multi-touch attribution models, ACM SIGKDD 2011
- Garrett A. Johnson, Randall A. Lewis, Elmar I. Nubbemeyer, Ghost Ads: Improving the Economics of Measuring Online Ad Effectiveness, Journal of Marketing Research 54(6), 2017
- Lloyd S. Shapley, A Value for n-Person Games, in Contributions to the Theory of Games II, Princeton University Press, 1953
Last updated Oct 9, 2026


Marketing agency or growth system: when a company outgrows its agency
An agency is the right call while the founder still runs most of the company. Once the business starts copying itself into new locations or markets, it needs a system that sets goals, tests hypotheses and owns the result.

Why healthcare marketing agencies stall: the short, mid and long wins model we use with clinics
Most agencies own the click and nobody owns the front desk. How we structure clinic work in three horizons, the research behind each one, and one year of results.

Why channel tests stall after month three
Most paid channel tests do not end with a decision. They end when the budget runs out, the attribution model changes, or everyone quietly stops looking at the dashboard.