Financial model for growth
A financial model for growth is a driver-based spreadsheet that links marketing and sales inputs to revenue, costs and cash, so a team can see what a plan does to the bank balance before it spends the money.
A financial model is a time-based set of calculations that turns assumptions into a forecast. A growth model is built from drivers: ad spend, conversion rates, price and churn feed revenue, costs and monthly cash. Its value is the ability to change one driver and see the effect on cash, which makes scenario and sensitivity analysis possible.
- Origin
- No single originator; FP&A and corporate finance practice, Practice; no single date
- Level
- 301 · Advanced
- Fits
- Startup, Small and mid-size, Scale-up
- Time to apply
- One to two days for a first working model, then a monthly update
- What you need
- last 6 to 12 months of funnel counts, revenue and costs · an opening cash balance and the dates when large bills fall due · one owner who accepts the model's numbers
A financial model is a time-based set of financial calculations in a spreadsheet that builds a forecast from one or more sets of input variables. That is how the ICAEW’s Financial Modelling Code defines it, and the definition fits a growth model well. The inputs are the numbers a marketing and sales team already tracks. The output is the number a founder worries about, which is cash in the bank next quarter.
This page covers the type of model that connects marketing, sales and money: a driver-based model. It sits above unit economics, which prices one customer, and above the P&L and cash flow statements, which describe what already happened.
What makes a model driver-based
A driver-based model calculates revenue and costs from operating drivers, the few numbers that move the result, and not from typed-in totals. KPMG describes the approach as choosing the most material parts of a plan, the ones management can act on, and using them to model the effect of future events on financial metrics. It also notes that the work of finding which drivers matter takes time, and that some drivers affect others.
In practice the drivers are the ones a KPI tree would list: spend, cost per lead, conversion at each stage, price, churn, margin, headcount. The model chains them in a fixed order.
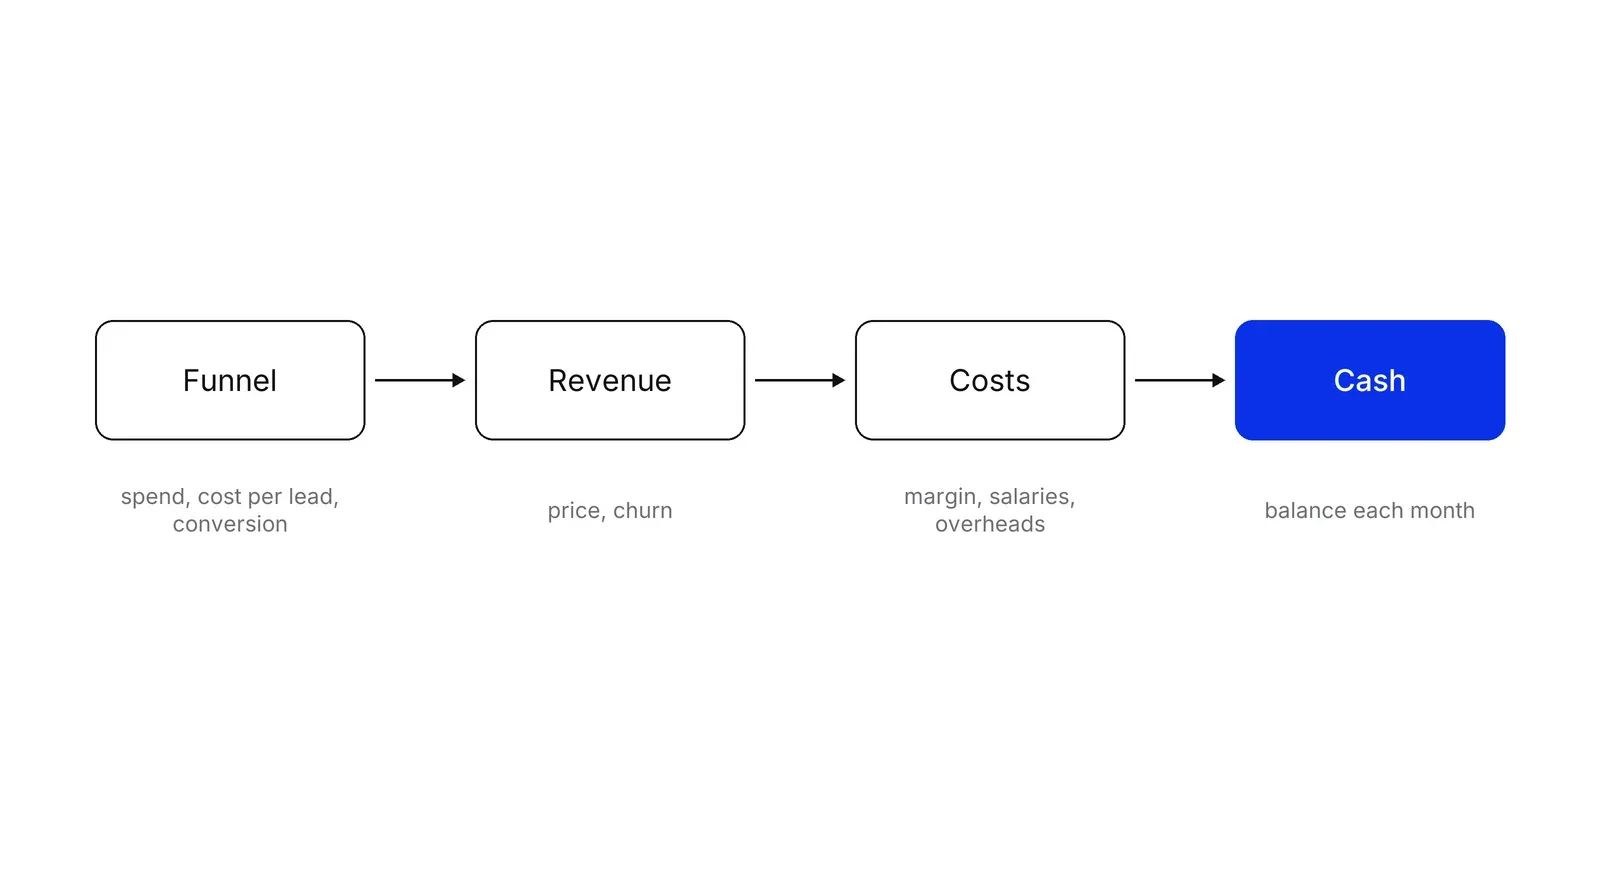
Each link has its own arithmetic. Spend divided by cost per lead gives leads. Leads times conversion gives customers. Customers times price gives revenue, less churn. Revenue less cost of sales, salaries and overheads gives profit, and profit adjusted for payment timing gives cash. Hiring plans can enter the same chain through sales capacity, where the number of reps limits how many deals can close.
A worked example from funnel to cash
An illustrative company spends $20,000 a month on ads at $50 a lead. That buys 400 leads. If 5% become customers, it wins 20 a month. The price is $500 a month, gross margin 80%, churn 3% a month, the sales team costs $15,000 and overheads $40,000. It starts with 100 customers and $150,000.
| Driver or result | Value |
|---|---|
| New customers per month | 20 |
| Media-only acquisition cost per customer | $1,000 |
| Acquisition cost including the sales team | $1,750 |
| Monthly gross profit per customer | $400 |
| Simple payback on acquisition cost | about 4.4 months |
| Customers after 12 months | about 274 |
| Cash after 12 months | about $206,000 |
| Lowest cash balance in the year | about $73,000 |
The payback line is a simple division that ignores churn. For reference, David Skok suggests recovering acquisition cost in under 12 months, and Bessemer’s portfolio data from 2021 points to targets under 12 months for small-business sales, under 18 for mid-market and under 24 for enterprise. See CAC payback for the full treatment.
Scenarios and sensitivity: testing the plan
A scenario is a coherent alternative future built by changing several inputs together. A sensitivity analysis is different: it moves one input at a time to see how much the output changes. Both need the same thing from the model, which the ICAEW code calls an engine through which alternative scenarios and sensitivities can be passed. The FAST Standard lists the same requirement under its first principle, flexible.
The scenario habit has a history. Pierre Wack wrote in Harvard Business Review in 1985 that forecasting-based planning worked in the stable 1950s and 1960s and became unreliable after the early 1970s. See scenario planning for the method. David Hertz argued in Harvard Business Review that every assumption in an investment case carries its own uncertainty, and that these combine into a large total uncertainty.
In the example, we moved four drivers 20% each way and recorded cash at month 12.
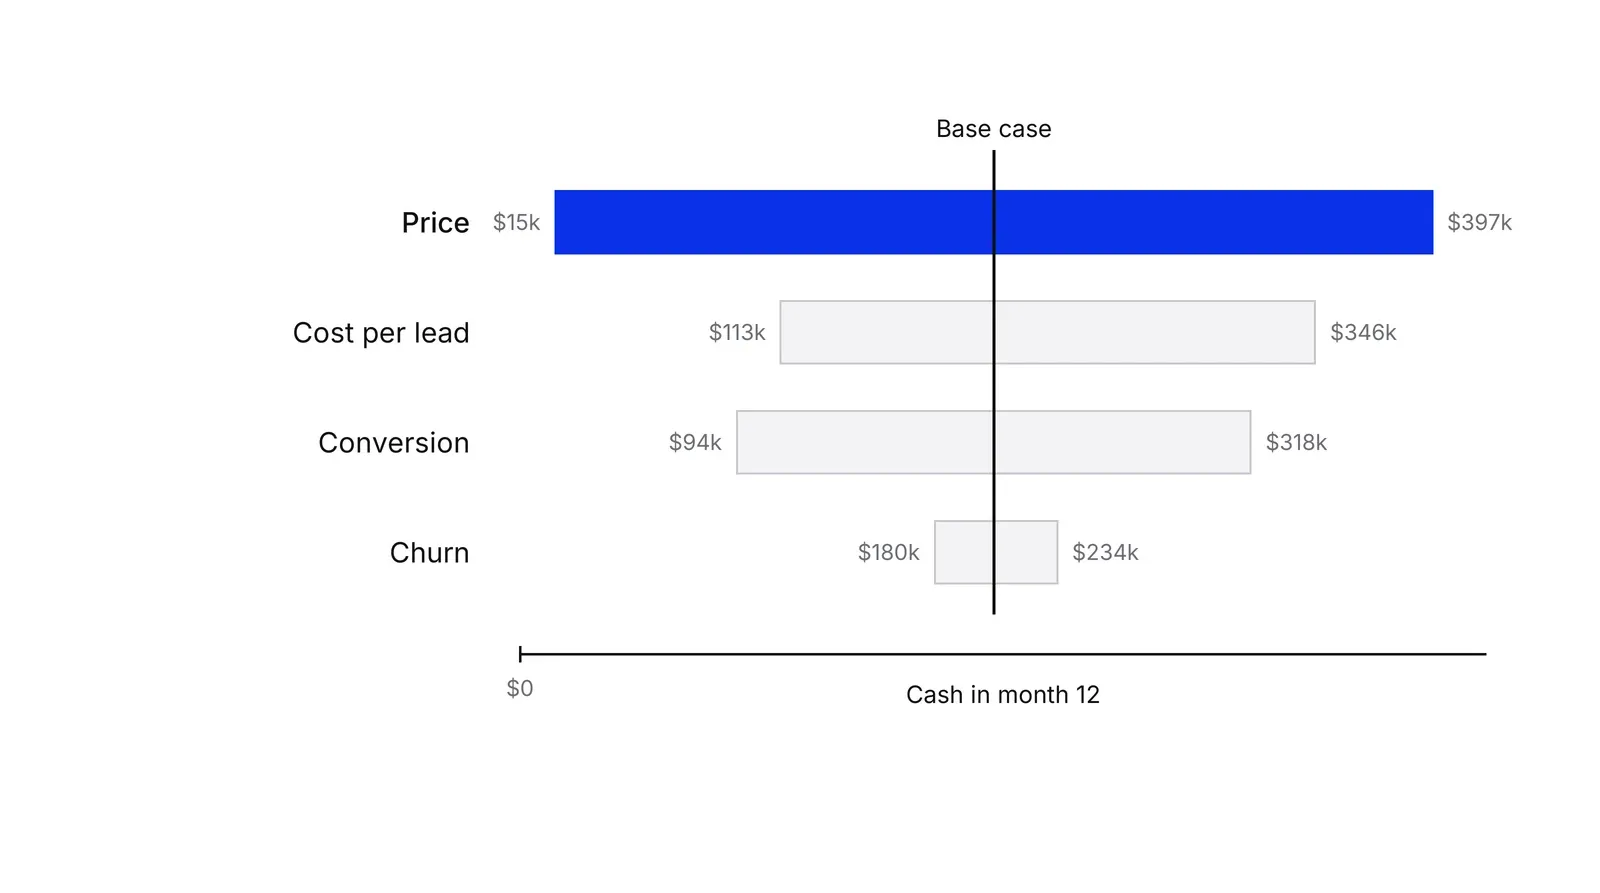
Price, at $400 or $600 instead of $500, swings cash from $15,000 to $397,000, and the low point in the downside case falls below zero. Cost per lead and conversion matter nearly as much. Churn matters least here, because a 12-month window gives it little time to compound. Over three years the ranking would change, which is one reason to rerun the analysis on a longer horizon before relying on it.
One-at-a-time sensitivity has a limit: it misses interactions, such as a price cut that also lifts conversion. Scenarios cover those, which is why a good model carries both.
Why spreadsheet models fail, and what to do about it
Spreadsheet errors are well documented and common. Raymond Panko collected audits of real spreadsheets: errors turned up in 24% of 367 audited files, and in at least 86% in the latest audits, which used better methods. In his laboratory experiments, 51% of the spreadsheets contained errors even though most had only 25 to 50 cells. His 2016 review concluded that errors are rare in any single cell but large spreadsheets very likely contain at least one wrong bottom-line value, and that developers are overconfident about accuracy.
The damage can be large. Herndon, Ash and Pollin found that a spreadsheet error excluded five countries from Reinhart and Rogoff’s widely cited 2010 analysis, and that the corrected average growth for high-debt countries was about 2.2%, not the published figure of roughly negative 0.1%. In England in 2020, test results stored in an old Excel file format were cut off at the row limit, so 15,841 cases went unreported for about a week. A review of JPMorgan’s 2012 trading loss found a risk model built from several Excel sheets where data was cut and pasted by hand, with spreadsheet errors that lowered the risk estimate, though the author is clear that the model was not the primary cause.
The remedies are plain. The ICAEW code asks for inputs that are easy to find, no duplicated calculations, consistent formulas across a row, built-in checks and a master check. Panko found that cell-by-cell code inspection is the one method with evidence behind it, so have a second person read the logic.
Where the model’s numbers come from
A model only repeats its inputs. Lovallo and Kahneman describe how optimism pushes forecasts upward, and Flyvbjerg adds that some forecasts are shaded on purpose to win approval. Counter both by setting the base case from the last six to twelve months of actuals, keeping the downside case honest, and replacing forecasts with actuals each month. Hope and Fraser argued that fixed annual budgets slow a company’s reaction to the market, and a monthly driver refresh is a practical alternative. For the forecasting techniques behind individual drivers, see sales forecasting methods and Hyndman and Athanasopoulos, whose online textbook includes scenario forecasting.
A Marketing-Operational System plan from Pushers starts from the same driver list.
How to apply Financial model for growth, step by step
- State the question the model must answer. Write one sentence: can we double paid acquisition and stay above two months of cash, or what happens to cash if prices fall. The ICAEW code asks for a clear purpose and a defined output before any building starts. Result: a scope that keeps the model small.
- Choose 8 to 15 drivers and sort them into inputs. Take the funnel and money chain: spend, cost per lead, conversion at each stage, price, churn, gross margin, sales cost, overheads, payment terms. Put every one on a single inputs sheet with a source or an owner next to it. Result: one page where every assumption lives.
- Build the chain in order: funnel, revenue, costs, cash. Calculate leads and customers from spend and rates, revenue from customers and price, costs from revenue and fixed lines, and cash from profit and timing. Use the same formula across every month. Result: a monthly cash balance that moves when an input moves.
- Add checks before the first scenario. Test that customers never go negative, that revenue by segment adds up to the total, and that opening cash plus movements equals closing cash. Show one master check on every sheet, as the ICAEW code recommends. Result: a model that tells you when it is broken.
- Run a base case and three to five scenarios. Set the base case from recent actuals, then build an upside, a downside and the scenario the board fears most. Change inputs only, never formulas. Result: a table of cash by month for each scenario.
- Rank the drivers with a sensitivity run. Move each driver 20% up and down while the others stay put, and record month-12 cash and the lowest balance. Result: a ranked list of the few drivers that decide the plan, which is where management attention and measurement should go.
- Review monthly and re-forecast. Each month replace forecast with actuals, update the inputs and read the gap. Large misses point to a wrong driver, not a bad month. Result: a model that stays current and a short list of assumptions to re-test.
Examples
A B2B subscription company planning next year
Illustrative, with the arithmetic laid out in the worked example in the text. Ad spend feeds leads, a conversion rate turns leads into customers, and a price and a churn rate turn customers into revenue. After 12 months the base case ends with healthy cash, while a 20% price cut leaves almost none and pushes the balance below zero along the way.
A private clinic adding a second site
Illustrative. A clinic's drivers are enquiries from search and referrals, booking rate, show-up rate, average treatment value, doctor-hours available and rent. Because doctor capacity caps visits, the model takes the lower of demand and capacity each month. The cash view includes the fit-out spend and the weeks before the new site fills. The answer is how many months of the second site the clinic can fund from the first.
When to use it
Use it before a large spend decision, such as hiring a sales team, doubling ad budgets, entering a market or raising money, and whenever the plan depends on several linked assumptions. It also suits a monthly management review, where the model shows which driver explains the gap.
When not to use it
Skip it for a decision that one number answers: a simple payback check on one channel is a unit economics calculation, not a model. Do not build one before you have any funnel or revenue history, because every driver would be a guess. For a regulated entity's formal capital or liquidity reporting, follow the regulator's templates, not a growth model.
Common mistakes
- Hard-coding numbers inside formulas. A changed assumption then has to be hunted down in many cells, which is how mistakes hide. Keep every assumption on the inputs sheet.
- Modelling revenue but not cash. Payment terms, annual prepayments and large one-off bills decide whether the company runs out of money, so build the cash view next to the profit view.
- A single optimistic case. Lovallo and Kahneman describe how optimism distorts forecasts, and a lone base case turns that bias into a plan. Build downside scenarios too.
- Trusting the model without checks. Audits of real spreadsheets found errors in most of the large ones, so add balance checks and have a second person review the logic.
- Too many drivers. Each driver needs data and an owner. A model with 60 inputs gets abandoned, so keep to the handful that move cash.
FAQ
What is a driver-based financial model?
It is a model in which revenue and costs are calculated from operating drivers such as leads, conversion rate, price, churn and headcount, instead of being typed in as totals. Change a driver and every downstream number updates. KPMG describes it as built on the most material parts of a plan, the ones management can act on.
How is a financial model different from a budget?
A budget fixes targets for a period. A model is a working engine: it takes assumptions and returns a forecast that can be rerun with different inputs. A budget can be one output of a model. Hope and Fraser argued in [Harvard Business Review](https://hbr.org/2003/02/who-needs-budgets) that fixed annual budgets slow adaptation, which is why many teams add rolling forecasts.
How common are errors in financial spreadsheets?
Common. Field audits reviewed by Raymond Panko found errors in 24% of 367 audited spreadsheets overall, and at least 86% in the most recent audits that used better methods. Errors in any one cell are rare, but a large spreadsheet very likely contains at least one wrong bottom-line figure.
Should a growth model live in Excel?
Often yes, at first. ICAEW's code asks modellers to check that a spreadsheet is the right tool before starting. Excel handles scenarios and review well when inputs, calculations and outputs are separate and checks are built in. Move to planning software when many people edit the model at once or data feeds are automated.
How many scenarios should I run?
Three to five is enough. A base case, an upside and a downside show the range, and one case built around the event you fear most tests survival. More cases rarely add insight. A sensitivity run on each driver then shows which assumptions deserve measurement.
Sources
- Raymond R. Panko, Spreadsheet Errors: What We Know. What We Think We Can Do, EuSpRIG 2000 (arXiv)
- Raymond R. Panko, What We Don't Know About Spreadsheet Errors Today, EuSpRIG 2015 (arXiv)
- Raymond R. Panko, Reducing Overconfidence in Spreadsheet Development, EuSpRIG 2003 (arXiv)
- Grenville J. Croll, Spreadsheets and the Financial Collapse, EuSpRIG 2009 (arXiv)
- Patrick McConnell, Dissecting the JPMorgan whale: a post-mortem, Journal of Operational Risk 9(2), 2014
- Thomas Herndon, Michael Ash, Robert Pollin, Does high public debt consistently stifle economic growth? A critique of Reinhart and Rogoff, PERI Working Paper 322, 2013
- Carmen M. Reinhart, Kenneth S. Rogoff, Growth in a Time of Debt, American Economic Review 100(2), 2010
- The Register, Excel row limit and England's lost COVID-19 test results, 5 October 2020
- Microsoft, Excel specifications and limits
- ICAEW IT Faculty, Financial Modelling Code, 2018
- FAST Standard Organisation, The FAST Standard
- KPMG, Driver-based planning: Elevating FP&A, February 2023
- Jeremy Hope, Robin Fraser, Who Needs Budgets?, Harvard Business Review, February 2003
- Pierre Wack, Scenarios: Uncharted Waters Ahead, Harvard Business Review, September 1985
- Dan Lovallo, Daniel Kahneman, Delusions of Success, Harvard Business Review, July 2003
- Bent Flyvbjerg, Delusions of Success: Comment on Dan Lovallo and Daniel Kahneman, Harvard Business Review, December 2003 (arXiv)
- David B. Hertz, Risk Analysis in Capital Investment, Harvard Business Review (1964; 1979 reprint)
- David Skok, SaaS Metrics 2.0, For Entrepreneurs
- David Skok, Startup Killer: the Cost of Customer Acquisition, For Entrepreneurs
- Andreessen Horowitz, 16 Startup Metrics, 2015
- Bessemer Venture Partners, Scaling to $100 Million, 2021
- Rob J. Hyndman, George Athanasopoulos, Forecasting: Principles and Practice, 3rd edition, OTexts
Last updated Oct 9, 2026


How to calculate channel payback and unit economics
A CAC number that only marketing believes will not survive a finance review. This guide calculates channel payback so both teams work from the same model.

Fractional CFO vs finance operations: which gap do you actually have
A fractional CFO is a person. Finance operations is a system. Companies searching for one are often missing the other, or both.