RICE scoring
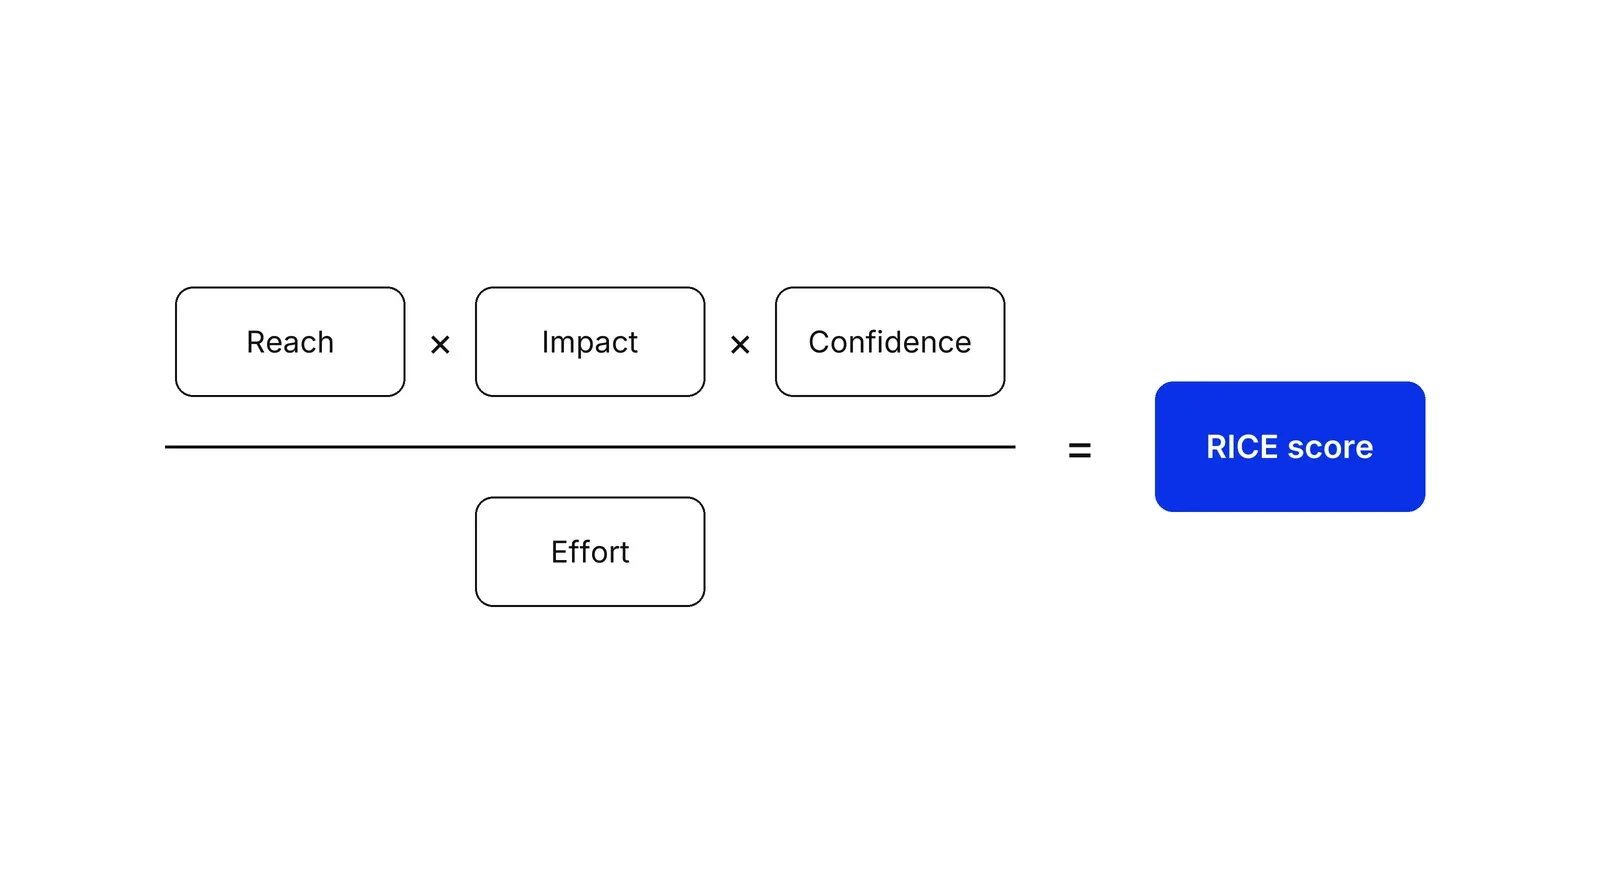
RICE scoring ranks product and growth ideas by multiplying Reach, Impact and Confidence and dividing by Effort, so a team can compare very different ideas on one number.
RICE scoring is a prioritization method that ranks ideas by the formula Reach × Impact × Confidence ÷ Effort. Reach counts the people affected in a set period, Impact rates the effect on each person, Confidence discounts guesses, and Effort is the work in person-months. Sean McBride described it in a 2016 post on Intercom's blog as a way to compare unlike projects on one scale.
- Origin
- Sean McBride and the product team at Intercom, 2016
- Level
- 201 · Tool
- Fits
- Startup, Small and mid-size, Scale-up
- Time to apply
- Two to three hours to score a backlog of 20 to 30 ideas the first time; minutes per idea after that
- What you need
- a list of candidate ideas written as specific changes, not themes · one goal metric that Impact is judged against · product analytics to count Reach, and someone who can estimate effort
RICE scoring is a prioritization method that gives each idea one number: Reach times Impact times Confidence, divided by Effort. Sean McBride, a product manager at Intercom, described it in a post titled “RICE: Simple prioritization for product managers”. The live page now shows a 2018 date, but the archived original carries a publication time of 15 March 2016. McBride wrote that his team could not find a scoring model that compared different ideas consistently, so it started building its own the previous August.
Product and growth teams use it when the backlog mixes things that are hard to compare: a pricing test, an onboarding fix, a new integration. The score works out how much value each idea delivers per unit of work.
What do the four factors measure?
Each factor answers one question, and Intercom gave each one a fixed unit or scale so that scores stay comparable across ideas.
| Factor | Question | Unit or scale in the Intercom post |
|---|---|---|
| Reach | How many people or events will this touch in a set period? | A count, such as customers per quarter |
| Impact | How much will it move the goal for each person reached? | 3 massive, 2 high, 1 medium, 0.5 low, 0.25 minimal |
| Confidence | How sure are we of the other estimates? | 100% high, 80% medium, 50% low |
| Effort | How much work will it take? | Person-months across product, design and engineering |
Reach is the factor that sets RICE apart from older scoring. It forces the team to count people from analytics instead of rating “importance” on a feeling. McBride called anything under 50% Confidence a “total moonshot”, and the ProductPlan glossary repeats the advice to put priorities elsewhere.
How to calculate a RICE score: a worked example
Take a fintech app’s growth team with one goal for the quarter: more new users completing their first transfer. Four ideas are on the table. The numbers below are illustrative arithmetic, not data from a real company.
| Idea | Reach (people per quarter) | Impact | Confidence | Effort (person-months) | RICE score |
|---|---|---|---|---|---|
| Shorter KYC upload step | 6,000 | 1 | 80% | 2 | 2,400 |
| Clearer pricing page | 2,500 | 0.5 | 80% | 0.5 | 2,000 |
| Referral bonus | 1,500 | 2 | 50% | 1 | 1,500 |
| Spending insights dashboard | 20,000 | 0.25 | 50% | 4 | 625 |
The dashboard reaches the most people and still comes last. Its effect on each user is small, the team has no evidence for it, and it costs eight times the effort of the pricing page.
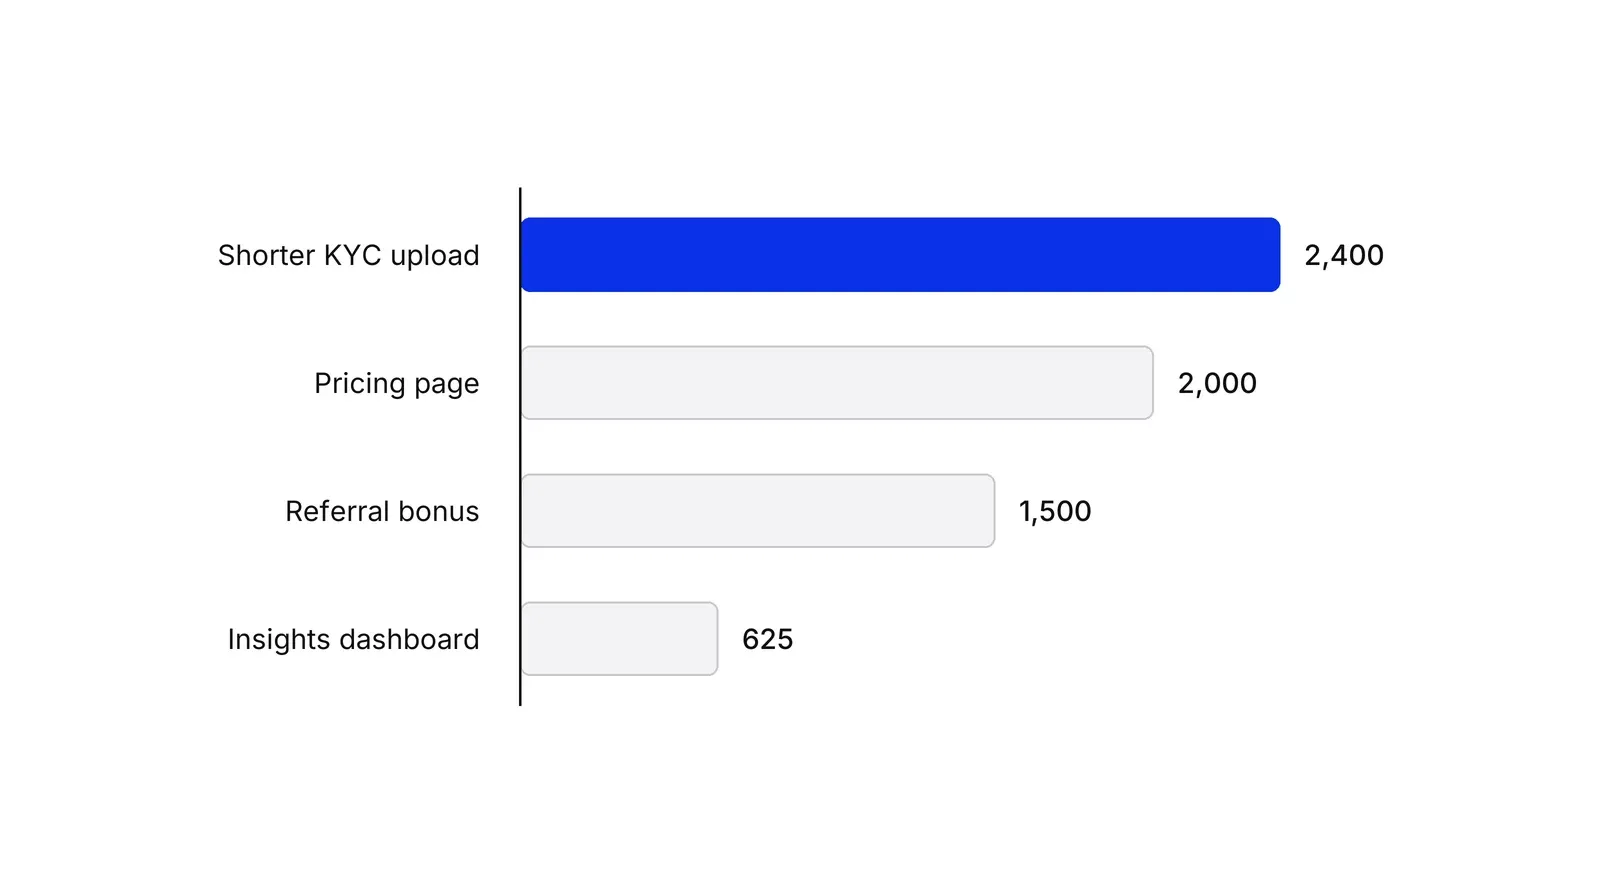
Now test how fragile the top spot is. Drop the KYC idea’s Confidence from 80% to 50% and its score falls to 1,500, level with the referral bonus. One honest change in a single input reshuffles the list, which is why the inputs deserve more argument than the output.
RICE vs ICE and other scoring methods
RICE is often confused with ICE, its closest relative. In a SaaStr talk in 2016, Sean Ellis described ICE as rating a test idea on impact, confidence and ease, each from 1 to 10. Ellis, co-author of Hacking Growth, used it to decide which growth tests to run next. Sources disagree on whether the three ratings were originally added or multiplied; most teams now multiply.
| Method | Formula | Best for | Main weakness |
|---|---|---|---|
| RICE | Reach × Impact × Confidence ÷ Effort | Mixed product and growth backlogs with analytics data | Counts people, not revenue |
| ICE | Impact, Confidence, Ease, each 1 to 10 | Fast ranking of growth experiments | Every input is a subjective rating |
| WSJF | Cost of delay ÷ job size | Large programmes where waiting has a price | Cost of delay is hard to estimate |
| MoSCoW | Four buckets against a fixed deadline | Agreeing the scope of one release | No ranking inside a bucket |
Weighted Shortest Job First, used in the Scaled Agile Framework, divides cost of delay by job size and quotes Don Reinertsen’s advice to quantify cost of delay if you quantify one thing. MoSCoW prioritization answers a different question: what a fixed deadline will deliver.
Value over cost is an old idea
RICE did not invent the logic of dividing value by cost. Joachim Karlsson and Kevin Ryan published a cost-value approach in IEEE Software in 1997, ranking software requirements by relative value and relative cost and testing it on two telecom projects. In 1999 Karl Wiegers proposed a spreadsheet model that divides each feature’s share of value by a weighted share of cost and risk. He warned that the result is a guideline and that it applies “only to negotiable features”.
What Intercom added was a separate Reach count and a Confidence discount. The research on these methods also flags their limits. A 2014 review of 73 studies by Philip Achimugu and colleagues found 49 prioritization techniques, and listed common problems: they scale poorly, struggle to update ranks as requirements change, and ignore dependencies between requirements. RICE shares the last problem, since it scores each idea alone.
Why Confidence and Effort are usually wrong
Most RICE sheets overrate Confidence. Experiment data from Microsoft shows why: Bing reported in 2013 that of the ideas tested in controlled experiments, “less than a third” moved the metrics they were designed to improve. The KDD 2013 paper by Ron Kohavi and colleagues adds that many ideas move key metrics by about 1% and are not well estimated in advance. Surprises run in both directions: Ron Kohavi and Stefan Thomke describe in Harvard Business Review a 2012 headline change at Bing that raised revenue by 12%, after the idea had been judged low priority and left untouched for more than six months. Psychologists Don Moore and Paul Healy found that overprecision, excessive certainty in one’s own beliefs, is the most persistent form of overconfidence.
Itamar Gilad’s Confidence Meter is a practical fix: confidence comes only from evidence. Opinions and trends score near zero, interviews score more, and usage data from a live test scores most.
Effort runs the other way, usually too low. Roger Buehler and colleagues showed in 1994 that people underestimate their own completion times because they picture the plan and ignore past experience. Bent Flyvbjerg and Alexander Budzier studied 1,471 IT projects and found an average cost overrun of 27%, with about one in six overrunning cost by more than 200%. Ask for effort estimates from the people doing the work, and compare them with how long similar work took last time.
Use the score, then overrule it in writing
McBride’s post says RICE should not be a hard rule. Dependencies and table-stakes features can justify working out of order. Olha Kashpur makes a similar point in Mind the Product: when two options score within 20% of each other, stop arguing about the number and decide on judgment. Tools support the formula directly; Jira Product Discovery lets teams build RICE from custom fields and a formula.
In our Growth Lab work a ranked idea becomes a HADI hypothesis with a date to check it, and the measured result replaces the guessed Impact and Confidence in the next round of scoring.
How to apply RICE scoring, step by step
- Pick the goal and the time window. Write down the one metric every idea is judged against, such as trial-to-paid conversion, and the period Reach is counted over, usually a quarter. Without a shared goal, Impact scores measure different things for different people. Result: one sentence at the top of the scoring sheet.
- Count Reach from data. For each idea, estimate how many people or events it touches in the window, using analytics rather than memory: users who reach a screen, signups who hit a step, customers on a plan. Result: a column of real counts in the same unit.
- Rate Impact and Confidence on fixed scales. Score Impact on Intercom's scale of 3, 2, 1, 0.5 or 0.25, and Confidence at 100%, 80% or 50%. Write next to each Confidence score the evidence behind it, such as an experiment, interviews or nothing but opinion. Result: two columns that anyone can challenge by asking for the evidence.
- Estimate Effort in person-months. Ask the people who will do the work to estimate the total time across product, design and engineering, using whole person-months and 0.5 for anything well under a month. Result: a cost column in one unit.
- Calculate, sort and argue with the ranking. Multiply Reach, Impact and Confidence, divide by Effort, and sort from highest to lowest. Then look for scores that feel wrong and re-check their inputs, and pull forward any dependency or table-stakes item the formula undervalues. Result: an ordered list with written reasons for every exception.
- Re-score when the evidence changes. After an experiment ships, replace estimated Impact and Confidence with what you learned, and re-score the rest of the list each quarter. Result: a backlog whose order reflects the latest evidence instead of the first round of guesses.
Examples
A dental clinic's marketing quarter
Illustrative. The goal is fewer empty chair hours. An SMS reminder flow reaches the 1,200 patients booked per quarter, with Impact 1 on no-shows, Confidence 80% because the booking system already shows reminded patients miss fewer visits, and Effort 0.5: score 1,920. A new implant landing page reaches 900 visitors, Impact 2, Confidence 50%, Effort 1: score 900. An Instagram video series reaches 5,000 people per quarter, Impact 0.25, Confidence 50%, Effort 2: score about 310. The reminders go first, although the video series has the biggest audience.
A B2B SaaS growth team and the enterprise request
Illustrative. An in-app checklist for trial accounts reaches 2,000 trial accounts per quarter, with Impact 1, Confidence 80% and Effort 1: score 1,600. Single sign-on, requested by three enterprise prospects, reaches 3 accounts, with Impact 3, Confidence 100% and Effort 3: score 3. RICE counts heads, so it buries a feature that a few large contracts depend on. The team treats SSO as table stakes for the enterprise plan and schedules it outside the ranking, writing down why, which is what Intercom's own post allows.
When to use it
Use RICE when a growth or product team has more ideas than capacity, the ideas differ in kind (a pricing test, a feature, an onboarding fix), and there is enough analytics data to count Reach. It suits quarterly planning and experiment backlogs, where a shared formula stops the loudest person from setting the order.
When not to use it
Skip it for work you must do regardless, such as compliance changes, security fixes and contractual commitments, and for items that depend on each other, which a per-item score cannot see. It also misleads when value is concentrated in a few large accounts, because Reach counts people rather than revenue. For deadline-bound scope decisions, MoSCoW is a better fit.
Common mistakes
- Mixing units in Reach, so one idea counts users per quarter and another counts page views per month.
- Giving every idea 80% or 100% Confidence on the strength of opinion, which lets weak ideas outrank tested ones.
- Letting the person who proposed an idea estimate its Effort alone, which makes favoured ideas look cheap.
- Treating a small gap between two scores as a real difference when every input is a rough guess.
- Scoring once and never updating the numbers after experiments return real results.
FAQ
How do you calculate a RICE score?
Multiply Reach by Impact by Confidence, then divide by Effort. An idea that reaches 2,000 users per quarter, with Impact 1, Confidence 80% and Effort 2 person-months, scores 2,000 × 1 × 0.8 ÷ 2 = 800. The number only means something next to other ideas scored with the same units and scales.
What is the difference between RICE and ICE?
ICE, associated with Sean Ellis, rates Impact, Confidence and Ease from 1 to 10. RICE splits impact into Reach, counted in real people, and Impact per person, and replaces Ease with Effort in person-months as a divisor. RICE takes more data to run but is harder to inflate. ICE is faster for a growth experiment backlog.
What is a good RICE score?
There is no good score in absolute terms. RICE is relative: the number depends on your Reach unit, time window and Effort unit, so a score of 500 can top one team's list and sit last on another's. Compare scores only inside one list, and treat small gaps between scores as ties.
How do you prioritize a backlog with RICE?
Agree on one goal metric and a time window, score every item on the same scales, sort by score, then review the top of the list for dependencies and must-do items the formula misses. Re-score each quarter and after every experiment, replacing guesses with measured results.
Who created the RICE framework?
Sean McBride, a product manager at Intercom, published it on the Inside Intercom blog in March 2016, describing a scoring system his team built because existing models did not compare ideas consistently. The live Intercom page now carries a 2018 date, but an archived copy of the original shows 15 March 2016.
Sources
- Sean McBride, RICE: Simple prioritization for product managers, Inside Intercom
- Internet Archive, original Inside Intercom post on blog.intercom.com (published 15 March 2016), 2017 capture
- Joachim Karlsson, Kevin Ryan, A Cost-Value Approach for Prioritizing Requirements, IEEE Software 14(5), 1997
- Karl E. Wiegers, First Things First: Prioritizing Requirements, Software Development, September 1999
- Philip Achimugu, Ali Selamat, Roliana Ibrahim, Mohd Naz'ri Mahrin, A systematic literature review of software requirements prioritization research, Information and Software Technology 56, 2014
- SaaStr, Sean Ellis: Building a company-wide growth culture, SaaStr Annual 2016 transcript
- Penguin Random House, Hacking Growth by Sean Ellis and Morgan Brown, 2017
- Scaled Agile Framework, Weighted Shortest Job First
- Agile Business Consortium, DSDM Project Framework Handbook, MoSCoW Prioritisation
- Itamar Gilad, The Tool that Will Help You Choose Better Product Ideas (Confidence Meter)
- Bing Search Quality Insights, Ronny Kohavi and Harry Shum, Large Scale Experimentation at Bing, August 2013
- Ron Kohavi, Alex Deng, Brian Frasca, Toby Walker, Ya Xu, Nils Pohlmann, Online Controlled Experiments at Large Scale, KDD 2013
- Harvard Business Review, Ron Kohavi and Stefan Thomke, The Surprising Power of Online Experiments, 2017
- Don A. Moore, Paul J. Healy, The Trouble With Overconfidence, Psychological Review 115(2), 2008
- Roger Buehler, Dale Griffin, Michael Ross, Exploring the Planning Fallacy, Journal of Personality and Social Psychology 67(3), 1994
- Bent Flyvbjerg, Alexander Budzier, Why Your IT Project Might Be Riskier Than You Think, arXiv (Harvard Business Review, 2011)
- Harvard Business Review, Dan Lovallo and Daniel Kahneman, Delusions of Success: How Optimism Undermines Executives' Decisions, 2003
- Atlassian, Jira Product Discovery fields overview
- ProductPlan, RICE Scoring Model
- Mind the Product, Olha Kashpur, ROI is a PM tool, not a finance deliverable, 2026
Last updated Oct 9, 2026


Marketing agency or growth system: when a company outgrows its agency
An agency is the right call while the founder still runs most of the company. Once the business starts copying itself into new locations or markets, it needs a system that sets goals, tests hypotheses and owns the result.

Why healthcare marketing agencies stall: the short, mid and long wins model we use with clinics
Most agencies own the click and nobody owns the front desk. How we structure clinic work in three horizons, the research behind each one, and one year of results.

Why channel tests stall after month three
Most paid channel tests do not end with a decision. They end when the budget runs out, the attribution model changes, or everyone quietly stops looking at the dashboard.