LIFT model
The LIFT model is a six-factor checklist from Chris Goward that helps you judge a web page from the visitor's side and turn what is wrong with it into test hypotheses.
The LIFT model is a conversion framework from Chris Goward that scores a web page on six factors: value proposition, relevance, clarity, urgency, anxiety and distraction. The value proposition sets the page's potential, relevance, clarity and urgency drive action, and anxiety and distraction hold it back. Teams use it to turn a vague sense that a page underperforms into specific A/B test hypotheses.
- Origin
- Chris Goward (WiderFunnel, now Conversion.com), 2009
- Level
- 201 · Tool
- Fits
- Startup, Small and mid-size, Scale-up
- Time to apply
- 2 to 3 hours to review one page, then one test cycle per hypothesis
- What you need
- one page and one conversion goal, such as a booking, a sign-up or a paid order · the ad, email or link that sends traffic to that page · two or three colleagues who have never seen the page, to score it independently · funnel or analytics data for the page, if you have it
The LIFT model is a checklist for judging a web page from the visitor’s side. It rates a page on six factors: value proposition, relevance, clarity, urgency, anxiety and distraction. The result is a ranked list of what is likely holding conversions back, which you then test. Chris Goward introduced it in 2009, and LIFT stands for Landing Page Influence Function for Tests.
Where did the LIFT model come from?
Goward built LIFT while running WiderFunnel, a conversion agency, and gave it a large part of his book You Should Test That!, published by Wiley in 2013. Scott Brinker’s review calls the model simple and powerful. Conversion.com says LIFT has raised client conversion rates by 10% to 277%, a self-reported range we cannot verify.
The best-known early case is Rudder, and its sources disagree. MarketingSherpa wrote in January 2009 that the winning variation lifted conversion by 43.5%. Goward’s own article reports a 45% rise in registrations. The test ran in late 2008, before the model’s stated date, and the trade-press story never says LIFT. Read it as one company’s story, not as proof that the model works.
What are the six LIFT factors?
The six factors are a value proposition at the centre, three conversion drivers and two conversion inhibitors.
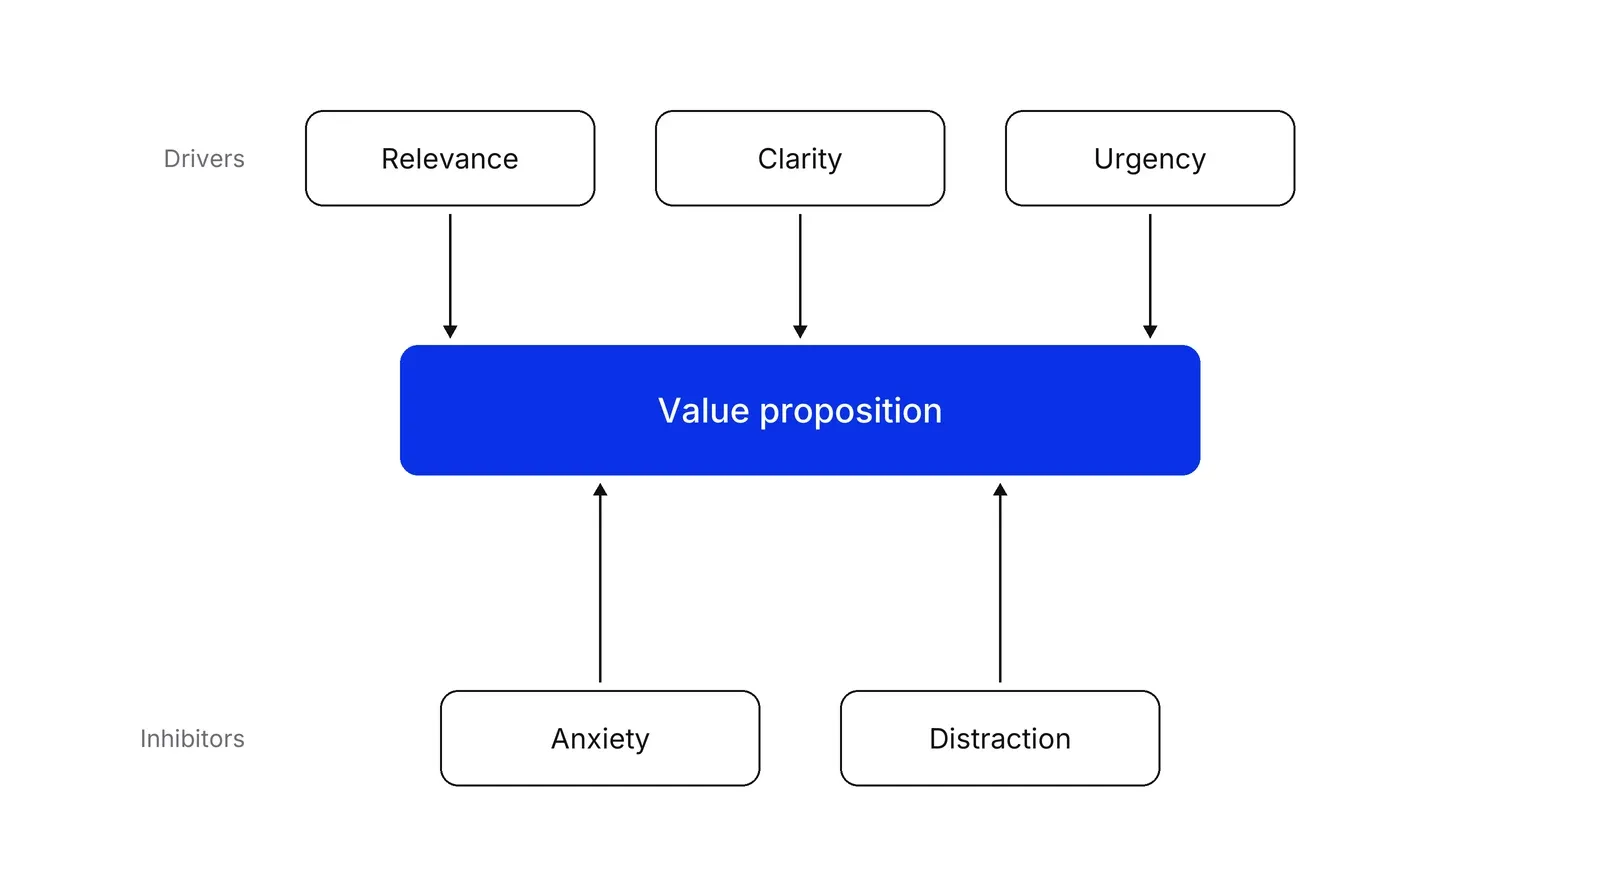
| Factor | Role | Question to ask |
|---|---|---|
| Value proposition | Centre | Do the benefits outweigh the costs, compared with the alternatives? |
| Relevance | Driver | Does the page match what the visitor expected to see? |
| Clarity | Driver | Are the offer and the next step obvious? |
| Urgency | Driver | Is there a reason to act now? |
| Anxiety | Inhibitor | What doubts might the visitor have? |
| Distraction | Inhibitor | What pulls attention from the goal? |
These questions come from Goward’s description. Some summaries rename or reorder factors, for example Econsultancy’s 2014 write-up uses “reducing anxiety” and “minimizing distractions”. Use Goward’s wording when you brief a team.
Why does the value proposition come first?
Goward’s position is that “your value proposition determines your potential conversion rate.” A page can only help visitors reach that rate, never raise it. The other five factors tune how much of the potential you capture.
This matters for budgeting your effort. If three people outside the team cannot say why they would choose you over the next option, no amount of layout work helps, and the job moves to value proposition or offer architecture.
How do relevance, clarity and urgency drive conversion?
Relevance is a match between the promise that brought the visitor and the page they land on. Google’s own definition of landing page experience includes whether the page meets the expectations set by the ad. The Nielsen Norman Group calls the underlying idea information scent: a link’s promise can be wasted by a page that does not confirm it.
Clarity is about speed. Nielsen’s 2011 analysis of dwell times, drawn from 205,873 pages in a Microsoft Research dataset, says the first 10 seconds of a visit are critical and that a clear value proposition is what earns longer attention. People also scan: the F-shaped reading pattern is the default when nothing on the page draws the eye. Goward splits clarity into design, which creates an unblocked eye flow, and content, which shortens the time to understand.
Urgency has an internal side, what the visitor already feels on arrival, and an external side, which the marketer creates with deadlines and offers. Keep the external side honest. A crawl of about 11,000 shopping sites by Mathur and colleagues found 157 deceptive countdown timers on 140 sites, defined as timers that reset or ran out while the offer stayed valid.
What do anxiety and distraction cost?
Anxiety and distraction are the two inhibitors. They reduce conversion even when the offer is good.
For anxiety, Baymard’s survey of US shoppers, which sits beside a 70.22% average cart abandonment rate across 50 studies, found that among those who left a checkout, 19% did not trust the site with their card details, 18% were forced to create an account and 13% disliked the return policy. Credibility is often judged by looks: in a 2002 Stanford study with Consumer WebWatch, design look was mentioned in 46.1% of comments when people judged a site’s credibility.
For distraction, count what competes with the goal. Baymard found the average checkout had 11.3 form fields in 2024 and says most sites need 8. Do not read this as “fewer choices always win”. A meta-analysis of 50 experiments with 5,036 participants found a mean choice-overload effect of virtually zero, while a 2015 meta-analysis of 99 observations found overload appears when choice sets are complex or people are unsure what they want.
How do you score a page with LIFT?
Score each factor from 1 to 5, have several people do it separately, and start with the lowest.
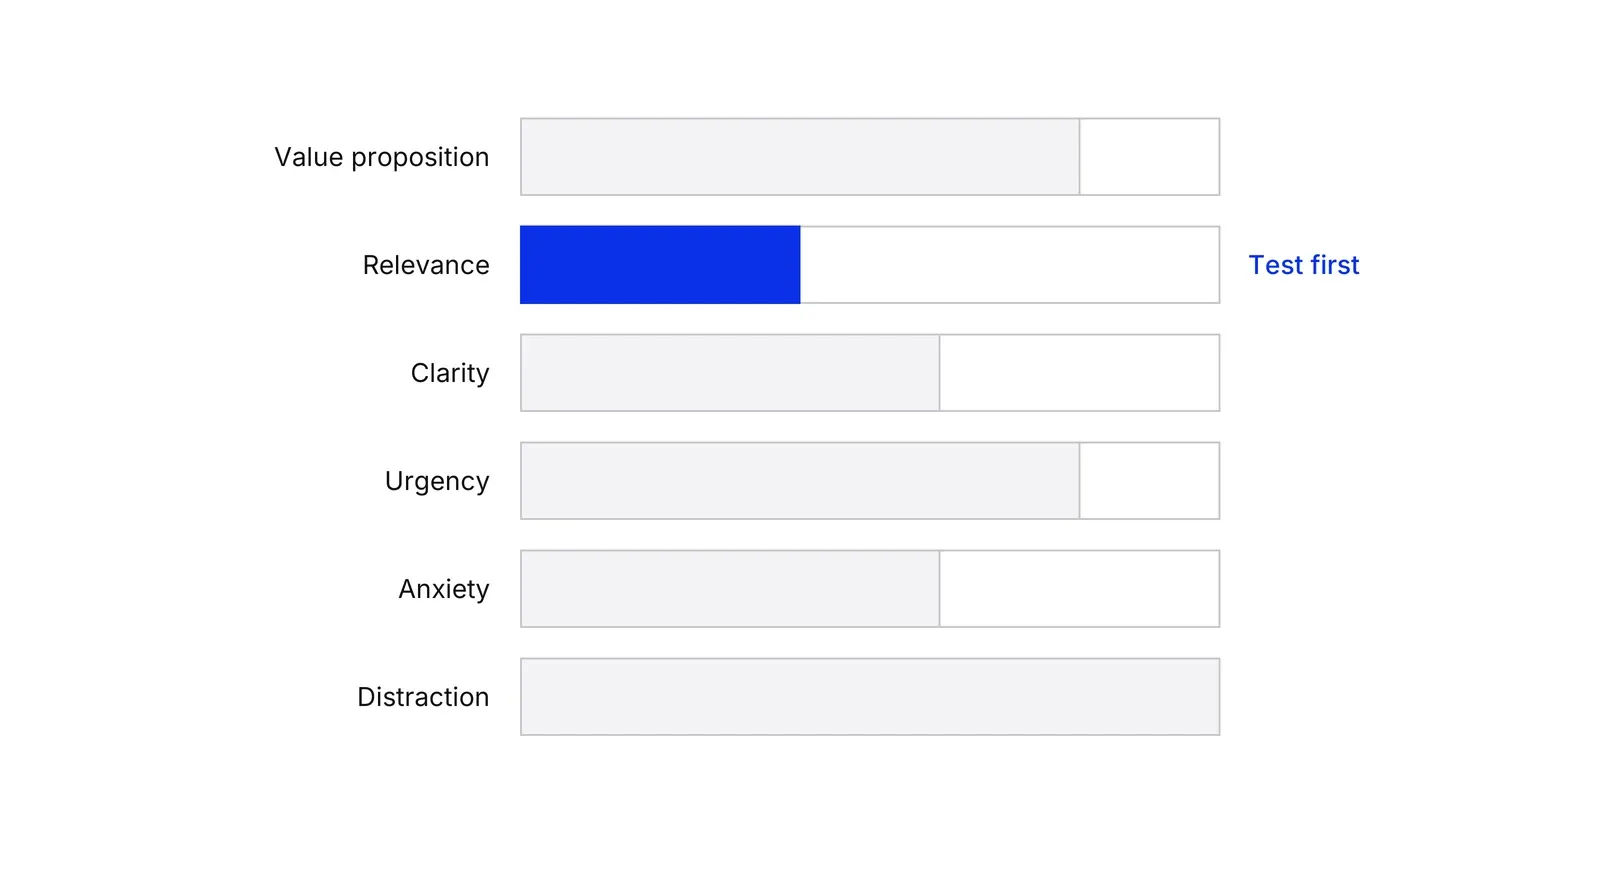
Goward’s published method lists issues rather than scores, so this scorecard is our simplification. Scoring independently matters, because reviewers disagree more than they expect: in a study by Jacobsen, Hertzum and John, only 20% of the 93 problems found were spotted by all four evaluators. Turn the weakest factors into hypotheses and rank them, for example with ICE scoring.
What are the limits of LIFT?
LIFT is a heuristic review: an expert reading of a page against a checklist. It generates hypotheses and cannot confirm them. The best-known set of heuristics, Nielsen’s ten usability heuristics, are broad rules of thumb, and the same applies here. LEAP, a conversion agency, adds that not every distraction is bad when it supports the main goal. Speero’s ResearchXL model treats heuristic analysis as the first of eight research steps, graded on relevance, clarity, value, friction and distraction, and then adds analytics, mouse tracking, polls, surveys and user tests.
Expert judgment is also a weak predictor of winners, which is why Kohavi, Henne and Sommerfield urged teams to listen to customers, not the highest-paid person’s opinion. Kohavi and Thomke describe a small Bing ad-headline change that was shelved as low priority and then raised revenue by 12% when tested. Run LIFT findings through the loop in our CRO guide, and size the tests with an experimentation program in mind. Page speed is outside LIFT too: a Deloitte study of 37 brands linked a 0.1 second faster mobile site to 8.4% higher retail conversion.
LIFT compared with its neighbours
| Method | Question it answers | Output |
|---|---|---|
| LIFT model | What on this page is likely to hold conversions back? | A ranked list of hypotheses |
| Funnel analysis | At which step do visitors leave? | A map of leaks |
| Fogg behavior model | Does the visitor lack motivation, ability or a prompt? | A diagnosis of the behavior |
| CRO | How do we raise the share who finish? | A research-led test loop |
The Fogg behavior model says motivation, ability and a prompt must meet at the same moment, which makes it a good partner when LIFT flags clarity or anxiety. Funnel analysis tells you which page to review first.
A Growth Lab plan starts from the funnel leak, reviews the leaking page with a structure like LIFT and sequences the tests by what your traffic can answer, as described in our Growth Lab practice.
How to apply LIFT model, step by step
- Pick one page and one goal. Choose a page with real traffic and write down the single action it should produce, plus the source that sends visitors to it. Result: a page, a goal and a traffic source on one line.
- Write the value proposition from the visitor's side. Complete one sentence: 'Visitors get X, at the cost of Y, and not from a rival because Z.' Show it to three people outside the team. Result: a sentence that either holds up or exposes that the offer, not the page, is the problem.
- Walk the page as a first-time visitor. Arrive the way real visitors do, from the exact ad or link. Ask whether the page matches what that source promised (relevance), whether the offer and the next step are clear in the first ten seconds (clarity) and whether anything gives a reason to act now (urgency). Result: a list of gaps for each driver.
- List the anxieties and distractions. Note every doubt a visitor could have about trust, cost, privacy or returns, and everything on the page that competes with the goal: extra links, menus, options and fields. Result: a list of inhibitors with the place each one appears.
- Score the six factors. Have each reviewer rate every factor from 1 to 5 on their own, then compare. Average the scores and discuss any factor where reviewers differ by two points or more. Result: a ranked list with the weakest factor at the top.
- Write hypotheses and test them. For the weakest factors write 'Because we saw X, changing Y will raise Z', rank them with a scoring method, and run the top ones as A/B tests with enough traffic to read the result. Result: one to three tests with a metric and a decision rule.
Examples
Rudder, a documented case
In 2008 Rudder, a free service that emailed daily bank balances, turned its home page into a single-purpose landing page. [MarketingSherpa reported](https://marketingsherpa.com/article/case-study/43-boost) that the winning variation raised conversion by 43.5%, with a clearer headline and a larger button above the fold. Conversion.com says a LIFT evaluation of that page found 18 priority factors and reports a 45% rise in registrations. The two accounts differ on the figure, and the 2009 article does not mention LIFT.
A dental clinic landing page
Illustrative. An ad promises 'same-day crowns' and sends 2,000 clicks a month to the home page, which lists twelve services and a menu with eight links. 40 people request a booking, a 2% rate. The review marks relevance low, because the visitor must hunt for crowns, and distraction high. The first hypothesis: a crown-only page with the price range, the same-day promise and one booking form should convert better.
A business account sign-up in fintech
Illustrative. The page headline reads 'Modern banking for modern teams' and step one asks for an ID upload with no explanation. Clarity is weak because the offer is vague, and anxiety is high because the request comes before any reason to trust the company. The hypotheses: state who the account is for and what it costs, and say why ID is needed, how long it takes and how the data is protected.
When to use it
Use LIFT when one page or one short flow underperforms and you need a structured way to decide what to test first: landing pages for paid traffic, product pages, sign-up forms and booking pages. It suits teams without a full research budget, because the first pass costs a few hours.
When not to use it
Skip it when the page gets too little traffic to ever read a test, and use user interviews instead. It also says little about slow loading, broken tracking or a weak offer; check those first. Do not use it as proof of what works: LIFT produces hypotheses, and only a test confirms one.
Common mistakes
- Scoring alone. One person's view of a page is biased by having built it. In a study of four evaluators, only 20% of 93 problems were found by all four.
- Fixing the page when the offer is the problem. If the value proposition is weak, a clearer layout only explains a weak offer more clearly.
- Adding fake urgency. Countdown timers that reset, or run out while the offer stays valid, teach visitors to distrust every deadline on the page.
- Removing options without checking. The research on choice overload shows no universal effect, so cut distractions that compete with the goal, not everything.
- Treating the checklist as the test. A LIFT review ends with hypotheses, not with a redesign.
FAQ
What does LIFT stand for in the LIFT model?
LIFT stands for Landing Page Influence Function for Tests. It is the name of Chris Goward's framework, not an acronym for its factors. The six factors are value proposition, relevance, clarity, urgency, anxiety and distraction, and none of them spells LIFT.
Who created the LIFT model?
Chris Goward, founder and CEO of the conversion agency WiderFunnel, introduced it in 2009 according to Conversion.com, which hosts his writing. He gave it a large part of his 2013 book You Should Test That!, published by Wiley, according to Scott Brinker's review.
Is LIFT a formula?
No. Goward's own pages present LIFT as six questions about a page, with the value proposition at the centre. Some websites print it as a ratio with anxiety and distraction in the denominator, but that is not in his published description. Treat it as a diagnostic checklist.
How is the LIFT model different from CRO?
CRO is the whole practice of measuring, researching, testing and deciding. LIFT is one tool inside it, used to review a page and generate hypotheses. Research methods such as analytics, polls and user tests tell you whether LIFT's conclusions match what real visitors do.
Does the LIFT model replace A/B testing?
No. LIFT proposes what to test; an experiment shows whether the change worked. Expert opinion is a poor guide to winners, as a Bing headline change shelved as low priority and later worth 12% more revenue showed, so a LIFT finding stays a hypothesis until a test supports it.
Sources
- Chris Goward, Conversion.com, The LIFT Model: Use these six factors to increase your conversion rate
- Conversion.com, The LIFT Model
- Wiley, You Should Test That! Conversion Optimization for More Leads, Sales and Profit, by Chris Goward
- Scott Brinker, MarTech, No, Really, You Should Test That
- MarketingSherpa, Rudder.com case study: 43% boost in conversion
- Shane Jones, Econsultancy, Improve your web conversions with the LIFT model
- LEAP Digital Marketing, The LIFT model: How to systematically increase your conversion rate
- Jakob Nielsen, Nielsen Norman Group, How Long Do Users Stay on Web Pages?
- Raluca Budiu, Nielsen Norman Group, Information Scent: How Users Decide Where to Go Next
- Nielsen Norman Group, F-Shaped Pattern of Reading on the Web
- Nielsen Norman Group, 10 Usability Heuristics for User Interface Design
- Baymard Institute, Cart Abandonment Rate Statistics
- Baymard Institute, Checkout Flow Average Form Fields
- Arunesh Mathur and colleagues, Dark Patterns at Scale: Findings from a Crawl of 11K Shopping Websites, CSCW 2019
- Jacobsen, Hertzum and John, The Evaluator Effect in Usability Studies, HFES 42nd Annual Meeting, 1998
- Ron Kohavi, Stefan Thomke, Harvard Business Review, The Surprising Power of Online Experiments
- Ron Kohavi, Randal Henne, Dan Sommerfield, Practical Guide to Controlled Experiments on the Web, KDD 2007
- Google, web.dev, Milliseconds make millions
- Google, Search Ads 360 Help, Landing page experience
- Speero, How to create winning tests using the ResearchXL model
- Stanford Persuasive Technology Lab with Consumer WebWatch, How Do People Evaluate a Web Site's Credibility?, 2002
- Benjamin Scheibehenne, Rainer Greifeneder, Peter Todd, Can There Ever Be Too Many Options? A Meta-Analytic Review of Choice Overload, 2010
- Alexander Chernev, Ulf Böckenholt, Joseph Goodman, Choice overload: A conceptual review and meta-analysis, Journal of Consumer Psychology, 2015
- Stanford Behavior Design Lab, Fogg Behavior Model
Last updated Oct 9, 2026


Marketing agency or growth system: when a company outgrows its agency
An agency is the right call while the founder still runs most of the company. Once the business starts copying itself into new locations or markets, it needs a system that sets goals, tests hypotheses and owns the result.

Why healthcare marketing agencies stall: the short, mid and long wins model we use with clinics
Most agencies own the click and nobody owns the front desk. How we structure clinic work in three horizons, the research behind each one, and one year of results.

Why channel tests stall after month three
Most paid channel tests do not end with a decision. They end when the budget runs out, the attribution model changes, or everyone quietly stops looking at the dashboard.